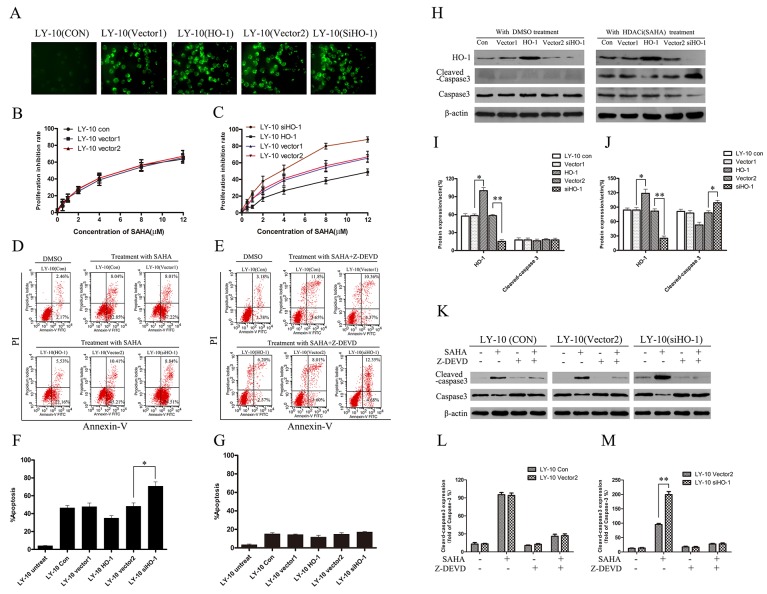
Figure 3. Silencing HO-1 gene expression sensitized LY-10 cells to apoptosis induced by vorinostat (SAHA).
(A) LY-10 cells were grouped into LY-10 (control), LY-10 (vector 1), LY-10 (HO-1), LY-10 (vector 2), and LY-10 (siHO-1). The positivity of lentivirus-mediated HO-1 and siHO-1 transduction (>95%) was observed by fluorescence microscopy. (B, C) Different groups of LY-10 cells were treated with vorinostat (SAHA) (0.1–12 μM) for 24 h. Cell proliferation inhibitions were detected with a cell-counting kit. (D, F) Different groups of LY-10 cells were treated with SAHA (8 μM) or DMSO (0.1%) for 24 h. Apoptosis rate was detected by flow cytometry. (E, G) Different groups of LY-10 cells were treated with SAHA (8 μM) combined with caspase-3 inhibitor (Z-DEVD) (50 μM) or DMSO (0.1%) for 24 h. Apoptosis rate was detected by flow cytometry. (H-J) Protein expressions of HO-1, caspase-3, and cleaved caspase-3 were detected by Western blot. (K-M) LY-10 (control), LY-10 (vector 2), and LY-10 (siHO-1) were treated with caspase-3 inhibitor (Z-DEVD) (50 μM) with or without SAHA (8 μM). Protein expressions of caspase-3 and cleaved caspase-3 were detected by Western blot. Western blot bands were quantified with Quantity One software. Data were analyzed with Prism V5.0 (GraphPad Software, San Diego, CA, USA). Each sample was normalized by related β-actin expression or caspase-3 expression. All experiments were repeated three times. *P<0.05, **P<0.01.

