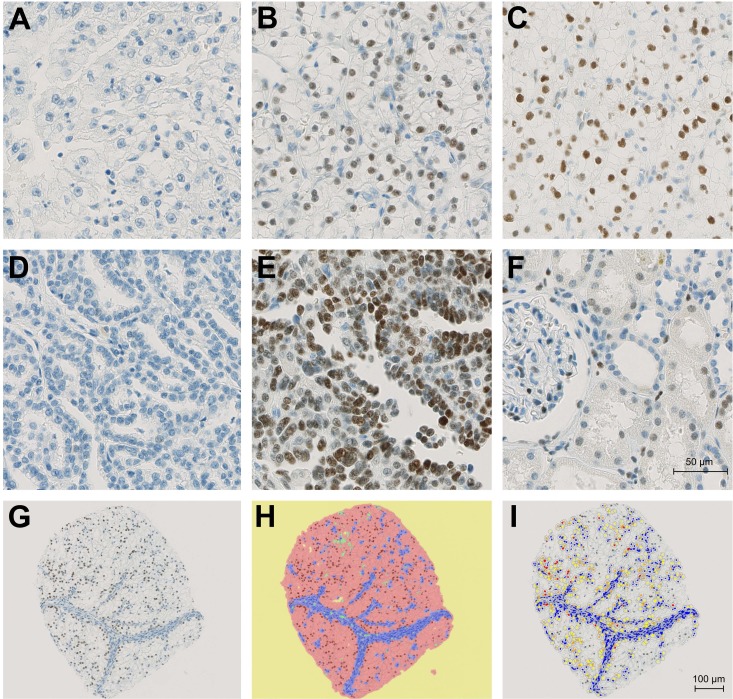
Figure 1. Immunohistochemical demonstration of AR expression.
(A) AR-negative ccRCC. (B) Moderate positivity in an subset of ccRCC cells. (C) Strong positivity in most ccRCC cells. (D) AR-negative papRCC. (E) Strong positivity in most papRCC cells. (F) Weak to moderate positivity in parietal podocytes, proximal and distal tubuli. (G) Representative core after IHC staining. (H) Core with representative classifier markup: yellow = background, red = tumor, blue = stroma, green = vessels. (I) Core with positive cell count markup. Blue nuclei are negative; yellow, orange and red nuclei are positive.

