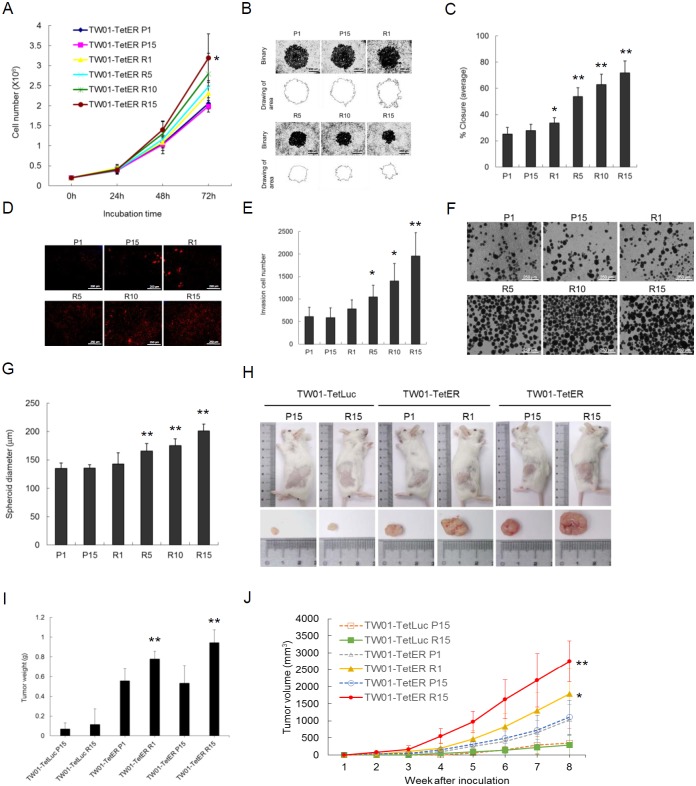
Figure 8. Recurrent BRLF1 expression aggravates the tumorigenic features of NPC cells.
(A) After incubation for 1-3 days, the cells at passages 1, 5, 10 and 15 were harvested and the numbers of viable cells were determined by cell proliferation assay. Data are presented as means ± SD. *, P < 0.05, compared to P1. (B) The cell migration was determined by the numbers of cells that had migrated into the central blank area after 24 h incubation. The images were captured by microscopy. (C) The area of a cell-free zone was measured by digital image processing software ImageJ.Cell migration was determined as percent closure. Data are presented as means ± SD. P < 0.05; **, P < 0.01, compared to P1. (D) The invading cells were visualized using propidium iodide staining and the images were captured by microscopy. (E) The numbers of invading cells were counted by ImageJ. Data are presented as means ± SD. P < 0.05; **, P < 0.01, compared to P1. (F) The cells were transferred to 10 cm non-treated plates for 7 days incubation for spheroid assay, and the images were captured by microscopy. (G) The diameters of the spheroids were calculated by ImageJ. Data are presented as means ± SD. **, P < 0.01, compared to P1. (H) The cells harvested at passages 1 and 15 were injected subcutaneously into NOD/SCID mice. Nine animals per group were studied for 8 weeks.Thesacrificed mice and excised tumor nodules were photographed at week 8. (I) The excised tumor nodules were weighed. Data are presented as means ± SD. **, P < 0.01, compared to TW01-TetER P1. (J) The tumor sizes were measured weekly. Data are presented as means ± SD. *, P < 0.05; **, P < 0.01, compared to TW01-TetER P1.

