Abstract
Shear wave elasticity imaging (SWEI) enables the quantitative assessment of the mechanical properties of tissue. In SWEI, the effective generation of acoustic radiation force is of paramount importance. Consequently, several research groups have investigated various transmit beamforming and pulse-sequencing methods. To further improve the efficiency of shear wave generation, and therefore, to increase the quality of SWEI, we introduce a technique referred to as “multi-angle compound SWEI” (MAC-SWEI), which uses simultaneous multi-angular push beams created by dual-phase transmit focusing. By applying a constant phase offset on every other element of an array transducer, dual-phase transmit focusing creates both main and grating lobes (i.e., multi-angular push beams for pushing) to simultaneously generate shear waves with several wave-front angles. The shear waves propagating at different angles are separated by multi-directional filtering in the frequency domain, leading to the reconstruction of multiple spatially co-registered shear-wave velocity maps. To form a single elasticity image, these maps are combined, while regions associated with known artifacts created by the push beams are omitted. Overall, we developed and tested the MAC-SWEI method using Field II quantitative simulations and the experiments performed using a programmable ultrasound imaging system. Our results suggest that MAC-SWEI with dual-phase transmit focusing may improve the quality of elasticity maps.
Index Terms: Shear wave elasticity imaging, multi-angular push beams, grating lobes, angular compounding
I. Introduction
DURING the past two decades, because of the ability of non-invasive, quantitative, and real-time assessment of tissue stiffness, which closely relates to many pathological conditions including liver fibrosis and breast cancer, shear wave elasticity imaging (SWEI) has drawn considerable attention in the field of medical ultrasound [1–4]. SWEI is based on the relationship between shear modulus G of tissue and shear-wave velocity (SWV) cs: in isotropic, linear, and elastic media, where ρ is the density of soft tissue, typically assumed to be 1,000 kg/m3 [2]. Thus, in SWEI, because SWV is estimated from ultrasound imaging of the propagation of shear waves, the adequate generation of shear waves is essential [5–7].
Since acoustic radiation force was introduced to remotely generate a motion within tissue [1], both acoustic radiation force impulse (ARFI) [5, 8] and SWEI-based methods [9, 10] have gradually progressed in their development, using the advantages associated with high-frame-rate ultrasound imaging. Several research groups have investigated various SWEI-based methods, many of which are related to transmit beamforming and pulse-sequencing methods for the sophisticated application of push pulses. Bercoff et al. introduced supersonic shear imaging (SSI), creating cone-shaped shear waves by consecutive excitations of push beams at multiple depths [9]. With ultrafast ultrasound imaging (over a several kHz frame rate), SSI visualizes the propagation of shear waves and reconstructs a two-dimensional quantitative map of tissue stiffness. McAleavey et al. developed the spatially modulated ultrasound radiation force (SMURF), which induces acoustic radiation force of a known spatial frequency to estimate an unknown shear modulus [11]. To explore the visco-elastic properties of tissue, Chen et al. introduced shear-wave dispersion vibrometry (SDUV), using multi-frequency harmonic vibration [12], and Deffieux et al. developed shear wave spectroscopy (SWS), by measuring frequency-dependent properties of shear waves using SSI [13]. More recently, to increase the frame rate of SWEI and improve the image quality, Song et al. introduced comb-push ultrasound shear elastography (CUSE), which uses multiple unfocused push beams simultaneously [14]. To produce stronger shear waves, various transmit beamforming methods referred to as “focused, marching, and axicon CUSE” were developed [15, 16].
One of the remaining challenges in ultrasound SWEI-based methods is to reduce the number of push-beam excitations without sacrificing the image quality. For example, to reconstruct an SWV map of an entire field of view (FOV), push beams should be applied multiple times at different locations because the propagation of shear waves in the push regions are not observable [17]. Furthermore, the push beams applied on the stiff inclusion or target can also cause overestimation of SWV [7]. Unfortunately, this multiple push beam-based approach reduces the frame rate of SWV images and may lead to motion artifacts resulting from physiological motion such as carotid artery pulsation, respiration, and cardiac activity [18]. Moreover, the frequent generation of long push beams may raise safety concerns for patients, shorten the ultrasound transducer life time, and require a longer cooling time of the transducer [19, 20]. Hence, fewer push events are desirable.
In this paper, we address these tradeoffs by introducing simultaneous multi-angular push beams. Specifically, in a single pushing and tracking event, by creating the shear waves of various wave-front angles, which can be separated by multi-directional filtering [21–24], we simultaneously obtain multiple SWV maps corresponding to shear waves with different orientations and propagating in different directions. Thus, similar to CUSE methods [14–16], our method applies multiple push beams simultaneously and creates multiple SWV maps through multi-directional filtering. However, we use multi-angular push beams instead of parallel push beams, to allow us to omit undesired regions on which the push beams are applied, before combining SWV maps. Furthermore, because of the angular compounding effect, we achieve the improved quality of SWV maps and reconstructed elasticity images.
To effectively create simultaneous multi-angular push beams, we introduce a new transmit beamforming technique called “dual-phase transmit focusing,” which alternates the phase of ultrasound waves between every other element of an array transducer. Dual-phase transmit focusing generates both main and grating lobes as effective angular pushing beams. An overall imaging method that both uses simultaneous multi-angular push beams created by dual-phase transmit focusing, and combines multiple SWV maps after eliminating undesirable SWV in the pushing regions, is referred to as “multi-angle compound SWEI” (MAC-SWEI). The developed MAC-SWEI approach, not only improves the quality of elasticity images because of angular compounding, but also suppresses overestimated SWV in the pushing regions, because MAC-SWEI allows for the masking of these regions before combining SWV maps.
II. Materials and Methods
A. Dual-phase Transmit Focusing for Multi-Angular Pushing
Grating lobes, caused by the discrete nature of array transducers, obstruct the identification of the exact positions of targets and have been widely regarded as unwanted artifacts in ultrasound imaging [25]. If the spatial sampling of the array is insufficient, grating lobes periodically appear in the imaging plane. The angles of grating lobes θm can be written as
| (1) |
where λ is the wavelength of an ultrasound wave, d is the element pitch (or spacing) of the transducer, and m represents the periodicity of the grating lobes [26, 27]. For example, if λ is 385 μm (i.e., if the sound speed of 1,540 m/s and the wave frequency of 4 MHz are assumed), and d is 300 μm (i.e., typical spacing in clinical linear array transducers), the grating lobes are outside of the field of view (FOV). Hence, the ultrasound array transducer, operating within the typical frequency range, is designed to avoid the grating lobes. However, if we double the element spacing similar to the sparse-array techniques [27], then d becomes 600 μm, and the first incident angle of the grating lobes becomes about ±40° according to equation (1), which indicates that the sparse-array approach can create grating lobes within the FOV for mechanically perturbing tissue. However, the sparse-array approach suffers from significant loss in acoustic energy because it uses only half the number of elements for firing. More importantly, the relative magnitudes between grating lobes and a main lobe are not adjustable.
To generate multi-angular push beams adequately and simultaneously, we introduce an effective way of creating both grating lobes and a main lobe, referred to as “dual-phase transmit focusing.” Unlike conventional focusing, which assigns the same phase on time-delayed transmit pulses for coherent focusing, dual-phase transmit focusing repeatedly applies phase-shifted (by ϕ0 and ϕ1) push pulses on every other element of the transducer, as depicted in Fig. 1. In other words, in dual-phase transmit focusing, transmitted pulses focus at the same focal point as in conventional focusing; however, the pulses have two different alternating phases on every other element (i.e., the phase is the same on every other element and there is a constant phase difference between two adjacent elements). As a result of this repetitive phase difference between two adjacent elements, dual-phase transmit focusing produces the grating lobes at the same angles and positions as the sparse-array technique does. However, unlike the sparse-array technique, dual-phase transmit focusing can adjust the magnitude of grating lobes, because the grating lobes are a function of the dual-phase difference. Thus, dual-phase transmit focusing enables the adequate generation of both main and grating lobes with equivalent magnitudes. Note that the phase difference in dual-phase transmit focusing only determines the magnitudes of the grating and main lobes. The angles of grating lobes (θm) are determined by equation (1) and the focus of the grating lobes is determined by focus of the main lobe.
Fig. 1.
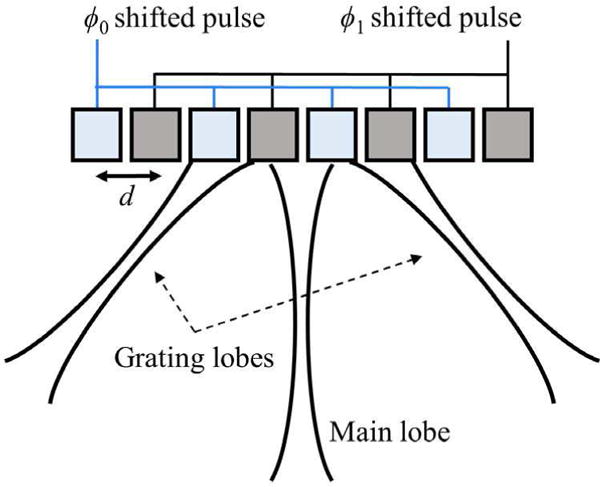
Generation of multi-angular push beams using the dual-phase transmit focusing approach.
According to the phase difference, defined as Δϕ = |ϕ0 − ϕ1| and ranging from 0° to 180°, a variety of pushing configurations can be realized. For example, for Δϕ = 0°, because of the same phase applied to the push pulses, this configuration produces only the main lobe, as in the conventional pushing strategy. By contrast, if Δϕ = 180°, there is barely any amplitude of the main lobe at the focus because of the cancellation of two waves with opposite phases. Instead, we obtain two strong grating lobes. Overall, as Δϕ increases from 0° to 180°, the magnitude of the main lobe decreases; however, the magnitudes of the two grating lobes increase, indicating that the magnitudes of the grating lobes and the main lobe can be adjusted based on the value of Δϕ. To assess dual-phase transmit focusing, we simulated acoustic fields using a Field II program [28, 29]. A transducer modeled for the simulation was the same as the linear array transducer used in experiments (L7-4, Philips Healthcare, Andover, MA, USA). All relevant simulation parameters are listed in Table I. To evaluate the pushing ability of dual-phase transmit focusing, we obtained 181 fields with varying Δϕ from 0° to 180° with 1° increment.
TABLE I.
Parameters used in the field ii simulation
| Parameter | Value | |
|---|---|---|
| Transducer (L7-4) | Element pitch (mm) | 0.298 |
| Element width (mm) | 0.250 | |
| Element height (mm) | 7.0 | |
| Elevational focus (mm) | 25 | |
| −6dB bandwidth (MHz) | 3.5 to 6.5 | |
| Number of elements | 128 | |
| Excitation pulse | Center frequency (MHz) | 4.0 |
| Sampling frequency (MHz) | 100 | |
| Pulse duration (μs) | 10 | |
| Pushing Focus (mm) | 20 | |
| f-number | 1.4 | |
| Apodization | Hanning window | |
| Medium | Attenuation coefficient (dB/cm/MHz) | 0.5 |
| Speed of sound (m/s) | 1,540 |
B. Multi-Angle Compound Shear Wave Elasticity Imaging
Through dual-phase transmit focusing, which effectively produces simultaneous multi-angular push beams, we implemented multi-angle compound SWEI (MAC-SWEI). Like other SWEI-based methods, MAC-SWEI also consists of three steps, shown in Fig. 2: (1) pushing the tissue to generate shear waves, (2) tracking the propagation of shear waves, and (3) reconstructing and compounding SWV maps. The main difference between MAC-SWEI and other SWEI-based techniques is that MAC-SWEI employs grating and main lobes created simultaneously by dual-phase transmit focusing as pushing sources, generating the shear waves with various wave-front angles. Multi-directional filtering was used to separate these angular shear waves, leading to the reconstruction of corresponding individual SWV maps. Since we know the exact location of push regions and the fact that the SWV values in push regions have the potential to be unreliable, our method excludes all SWV values in each push region before combining them. Thus, this approach can result in a reliable SWV map, spanning a full FOV in a single pushing and tracking event.
Fig. 2.
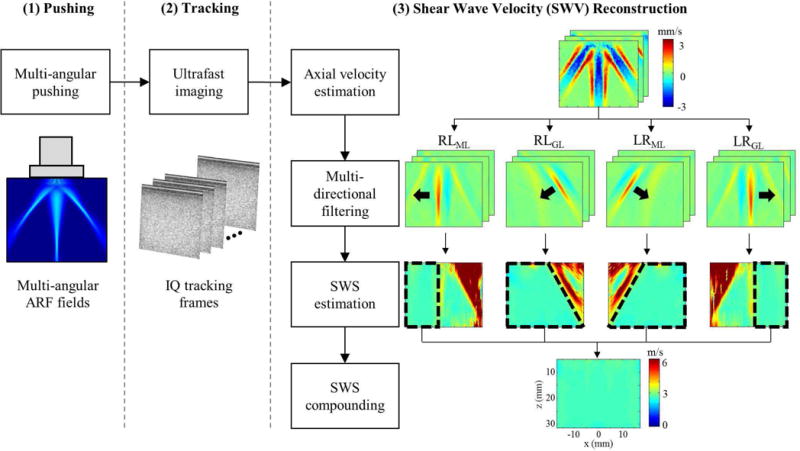
Overall procedures of multi-angle compound SWEI (MAC-SWEI).
A programmable ultrasound research machine (Vantage-256, Verasonics Inc., Redmond, WA, USA), equipped with the L7-4 linear array transducer (see Table I) was used in this study. The ultrasound system was used to generate push pulses and to record post-beamformed IQ data. The acquired data were processed offline using MATLAB (The MathWorks Inc., Natick, MA, USA). To create the multi-angular push beams (one main and two left/right grating lobes), we applied Δϕ of 140° for dual-phase transmit focusing. Additionally, we used Δϕ’s of 0° and 180° to analyze how the choice of Δϕ affects the generation of shear waves.
To realize the phase shift Δϕ, we delayed the signals on every other element. The corresponding time delay τΔϕ was defined as
| (2) |
where f0 is the center frequency of a push pulse. For example, for f0 = 4 MHz and Δϕ = 140°, the required time delay τΔϕ was about 97.2 ns. Due to a master clock of 250 MHz in the Verasonics system, τΔϕ applied in the system was 96 ns (i.e., the closest multiple of 4 ns time resolution), indicating that ideal Δϕ’s of 140° and 180° were implemented with 138.24° and 178.56° in the system.
In experiments, the duration excitation pulse was 600 μs while in Field II simulation, we used a pulse duration of 10 μs to decrease the computational time. All other parameters were the same as listed in Table I. After applying the pulse, shear waves were recorded using ultrafast plane wave imaging [30]. The three angles of the plane waves, whose center frequency was 4.3 MHz, were −4°, 0°, and 4°. Their pulse repetition frequency (PRF) was 10 kHz, and thus, the effective PRF was 3.33 kHz.
To visualize the propagation of shear waves, we estimated axial particle velocities from acquired IQ sequences using a two-dimensional auto-correlation approach [31, 32]. The number of ensemble was three, and the length of the auto-correlation kernel was 2λ. Then, we applied multi-directional filtering [22–24], originally introduced in magnetic resonance elastography [21] to multi-angular shear waves to separate them in space and time. To design the multi-directional filter, we calculated the angles of two grating lobes, 40°, from equation (1). Although our dual-phase configuration± generated six shear waves from three push beams (i.e., one main and two left/right grating lobes), we eliminated two shear waves that were traveling toward the upper right and upper left corners of FOV because of their small propagation distances. Thus, MAC-SWEI utilized four shear waves: right-to-left from the left grating lobe (RLGL), right-to-left from the main lobe (RLML), left-to-right from the right grating lobe (LRGL), and left-to-right from the main lobe (LRML), depicted in Fig. 2.
From the four shear-wave sequences (RLGL, RLML, LRGL, and LRML), four corresponding SWV maps were reconstructed using two-dimensional cross-correlation [22, 33]. Here, the distance between the cross-correlating shear wave signals in both lateral and axial directions was 2.1 mm. Thereafter, the reconstructed SWV maps were filtered using a two-dimensional median filter (1.0 mm × 1.0 mm). Before combining these four SWV maps, because we know the positions and the angles of all pushing sources, the regions excited by push beams were excluded. Thus, we defined the binary maps R(x,y,n) (indicated by black dashed regions in Fig. 2), which determined the SWV maps that will be combined. Here, x and y represent the lateral and axial positions and n denotes the order of the SWV maps used for compounding (n = 1,2,3,4). R(x,y,n) = 1 or 0 represents an SWV value of the nth SWV map at x and y, which is included or excluded, respectively, in the combined SWV map. To produce a combined single SWV map, a weighted summation of four SWV maps was used
| (3) |
where SWVCMPND(x,y) is the compounded SWV map, and x and y represent the lateral and axial positions. SWV(x,y,n) contains four SWV maps acquired from their corresponding angular shear waves. Because the push regions can be eliminated, the combined MAC-SWEI SWV maps are bias-reduced and reliable. Furthermore, by combining multiple SWV maps resulting from shear waves, oriented differently and propagating in different directions, MAC-SWEI improves the quality of an SWV map similar to angular-spatial compounding used in the B-mode or strain elastography [34].
In addition to MAC-SWEI with the shear waves with four wave-front angles, created by applying Δϕ of 140°, we realized two more configurations with Δϕ’s of 0° and 180° for comparison (Fig. 3). First, Δϕ of 0° generated only the main lobe, resulting in two SWV maps from RLML and LRML. By contrast, Δϕ of 180° created only the two grating lobes resulting in two SWV maps from RLGL and LRGL. With Δϕ = 140°, four SWV maps from all three lobes were generated. Thus, for Δϕ ≠ 0°, the two shear waves (RLGL and LRGL) from the two grating lobes propagate the push regions of each other (i.e., RLGL travels to the region where LRGL is created, and vice versa), allowing for the reconstruction of SWV maps with an entire FOV.
Fig. 3.
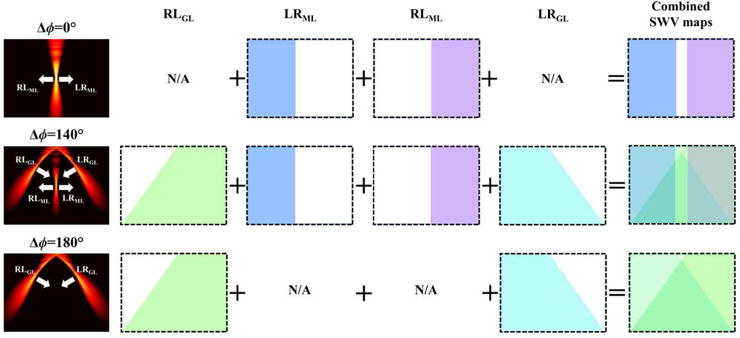
Three available pushing configurations by dual-phase transmit focusing and combining of corresponding SWV maps.
C. Phantom Experiments and Assessment Metrics
To assess the performance of MAC-SWEI, we imaged a quality assurance elasticity phantom (Model 049, CIRS Inc., Norfolk, VA, USA) containing several spherical inclusions within a homogeneous background. The nominal SWV values of the stiffest inclusion and the background are 5.11 m/s and 2.86 m/s (80 kPa and 25 kPa in terms of Young’s modulus), respectively. To verify and compare various available configurations of dual-phase transmit focusing, the stiffest inclusion and the homogeneous background were evaluated with three Δϕ’s—0°, 140°, and 180° —, which create one main lobe, three lobes, and two grating lobes, respectively. In addition, we placed the inclusion at two locations: the center of the image and +10 mm to the right from the center (i.e., the inclusion was positioned at the same depth, but it was displaced laterally). For quantitative evaluation, we calculated the mean and the standard deviation (STD) of the SWV values in a region-of-interest (ROI). For the homogeneous background, when Δϕ= 0°, the means and the STDs were estimated only in the non-pushing regions, but when Δϕ = 140° and 180°, all of the SWV regions were used. To evaluate the area of phantom with inclusion, two circular ROIs at the same depth covering the inclusion and the background region were used. We also assessed a blind area (BA) to explore the amount of unacceptable outliers in the SWV map [35]. Here, we classified an SWV value larger than (mean+3·STD) or less than (mean 3·STD) as an unacceptable SWV value and then computed the· BA by the number of unreliable pixels in the SWV map, divided by the number of all pixels. Furthermore, we evaluated a contrast-to-noise ratio (CNR) [14] and % error defined as
| (4) |
| (5) |
where μI and μB, and σI and σB in equation (4) indicate the means and the STDs of the SWV values in the inclusion and background regions, respectively. For % error (5), cE and cN represent the estimated and nominal SWV values in the ROI, respectively.
D. Safety Measurements
To ensure the clinical applicability of the MAC-SWEI technique, we measured acoustic parameters, including the mechanical index (MI), the spatial peak temporal average intensity (ISPTA), and the spatial peak pulse average intensity (ISPPA). Currently, the Food and Drug Administration (FDA) limits the MI, the ISPTA, and the ISPPA to 1.9, 720 mW/cm2, and 190 W/cm2, respectively. The MI, the ISPTA, and the ISPPA are defined as follows [36]:
| (6) |
| (7) |
| (8) |
where Pr,derated is the derated peak rarefactional pressure at the focus of the main and grating lobes (MPa), and fC is the center frequency (4.0 MHz). PIIderated is the derated pulse intensity integral (μJ/cm2), PRF is the pulse repetition frequency (1 Hz), and PD is the pulse duration (600 μs). Here, Pr and PII are defined as
| (9) |
| (10) |
where υ(t) represents the measured voltage. The sensitivity of a hydrophone is denoted by Ml(fC), where fC is the center frequency of a pulsed wave. The beginning and end times of the pulse are denoted by t1 and t2, ρ is the density of water (1,000 kg/m3), and c is the speed of sound in water (1,484 m/s). To reflect the attenuation of ultrasound in tissue, we derated the recorded waveforms with an attenuation coefficient of 0.3 dB/cm/MHz. We used a 0.2-mm needle hydrophone (Precision Acoustics Ltd., Dorchester, Dorset, UK) and a DC coupler (DCPS233, Precision Acoustics Ltd., Dorchester, Dorset, UK) to acquire acoustic pressures, recorded by an oscilloscope (PicoScope 3406D, Pico Technology Ltd., St Neots, Cambridgeshire, UK).
III. Results and Discussion
A. Multi-Angular Acoustic Radiation Force Fields
Field II simulation results of normalized acoustic pressure fields created by dual-phase transmit focusing with four selected Δϕ’s (0°, 60°, 120°, and 180°) are shown in Fig. 4. In total, 181 fields (from 0° to 180°) were simulated, and an average execution time for each field was 165.8 s on a desktop computer with Intel(R) Core(TM) i7-6700K at 4.0 GHz. For Δϕ = 0°, dual-phase transmit focusing created only the main lobe (Fig. 4 (a)). However, for Δϕ ≠ 0°, the periodic incoherency in the transmit phases introduced the desirable grating lobes in the FOV. As Δϕ increased from 0° to 180°, the magnitudes of the grating lobes increased, while that of the main lobe decreased. Finally, because Δϕ of 180° canceled the main lobe at the focus, only the two and strongest grating lobes are observed (Fig. 4 (d)).
Fig. 4.

Simulated multi-angular acoustic pressure fields created by dual-phase transmit focusing with Δϕ’s of (a) 0°, (b) 60°, (c) 120°, and (d) 180°.
Figure 5 shows the maximum acoustic pressure of the main and grating lobes as a function of Δϕ. Again, as Δϕ increased, the magnitude of the main lobe decreased whereas those of the grating lobes increased. The intersection of the main and grating lobe curves (a red circle in Fig. 5) indicates that the value of phase difference (Δϕ is around 130°) could generate three push beams of equal magnitude. Therefore, the phase difference (Δϕ) determines the distribution of the acoustic energy between the main and grating lobes in dual-phase transmit focusing. These results suggest that the magnitude of the multi-angular push beams can be carefully controlled.
Fig. 5.
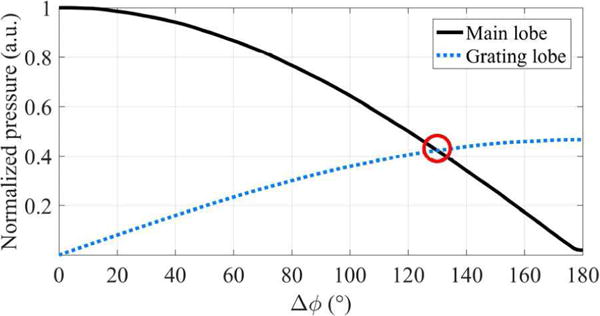
Normalized acoustic pressure of the main lobe and the grating lobes as a function of Δϕ.
B. Shear Waves Created with Dual-Phase Transmit Focusing
The generation and the propagation of shear waves, created by dual-phase transmit focusing with three Δϕ’s (0°, 140°, and 180°) in the homogeneous background region of the phantom as a function of time, are shown in Fig. 6. Here, we applied three Δϕ’s to demonstrate that dual-phase transmit focusing generates shear waves as expected. Indeed, Δϕ = 0° generated two shear waves from the main lobe, similar to conventional SWEI; Δϕ = 140° created one main and two grating lobes that induced the shear waves of three distinct angles. As the shear waves induced by the grating lobes traveled a greater distance than those induced by the main lobe in the FOV, we applied 140° (instead of 130°, as indicated in Fig. 5) of Δϕ, which resulted in the slightly stronger grating lobes compared with the main lobe. Finally, for Δϕ = 180°, only two grating lobes were produced, and thus, propagation of two tilted shear waves were observed.
Fig. 6.
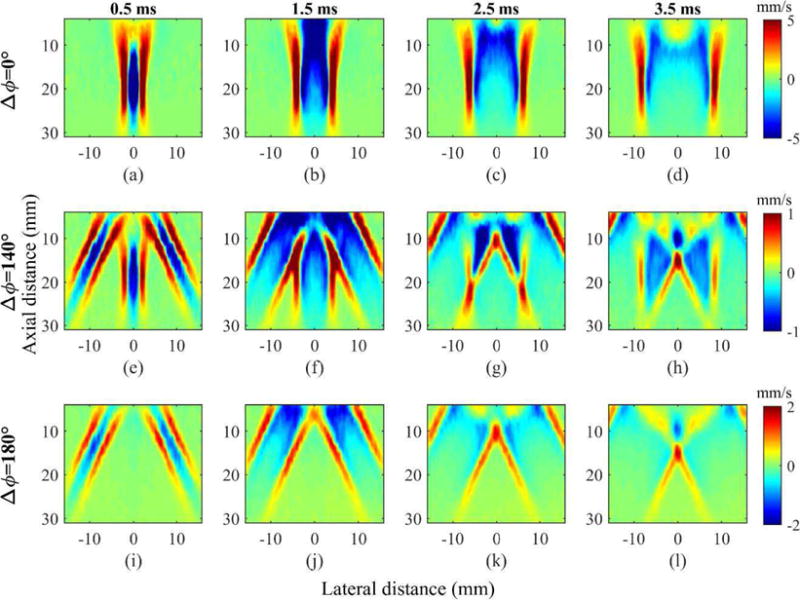
Estimated axial velocity sequences in the homogeneous region of the phantom with multiple choices of Δϕ’s at various time points. Rows represent three Δϕ’s (0°, 140°, and 180°). Columns represent four time points (0.5 ms, 1.5 ms, 2.5 ms, and 3.5 ms) after pushing.
C. Homogeneous Region
From three sets of shear-wave sequences (Fig. 6) created by three pushing configurations (Δϕ’s of 0°, 140°, and 180°), we reconstructed the final combined SWV maps, as shown in Fig. 7. To obtain the SWV maps in Fig. 7, we first applied multi-directional filtering that separates shear waves with several angles, leading to the reconstruction of corresponding SWV maps. Thereafter, these SWV maps were combined, allowing us to obtain final SWV maps covering a full FOV, as shown in Fig. 7. For Δϕ = 0°, none of the two shear waves (RLML and LRML) from a main lobe propagated through the pushing region, and a final SWV map had a limited FOV (Fig. 7 (b)). By contrast, for Δϕ ≠ 0° (i.e., Δϕ = 140° and Δϕ 180°), shear waves covered the pushing regions of each other, and a final SWV map had a full FOV (Figs. 7 (c) and (d)). However, because multi-directional filtering cannot completely separate different angles of shear waves, slightly overestimated SWV values were observed in the regions where the two grating lobes were generated. To reduce these possible artifacts, multi-directional filter masks should be carefully designed according to the angle and the bandwidth of the shear waves.
Fig. 7.

Experimental results on the homogeneous region. (a) B-scan image and reconstructed SWV maps with Δϕ’s of (b) 0°, (c) 140°, and (d) 180°.
For the quantitative evaluation, we computed the mean, the STD, the % error, and the BA of the SWV maps in the homogeneous background regions (Table II). Here, for Δϕ = 0°, the mean and the STD were estimated only in the non-pushing regions (as indicated by dotted black boxes in Fig. 7 (b)), but for Δϕ = 140° and Δϕ = 180°, all of the SWV regions were used. However, for computing the BA, the entire region of the SWV maps was used. The differences among the means, the STDs, and the % errors obtained from the three Δϕ’s were not noticeable. The BA indicates that Δϕ of 140° yields the most reliable SWV map with the widest FOV coverage. For Δϕ of 0°, accurate reconstruction of the SWV map within the pushing region was not possible due to artifacts, resulting in the largest BA among the three pushing schemes.
TABLE II.
Quantitative assessment results in the homogeneous background
| Δϕ = 0° | Δϕ = 140° | Δϕ = 180° | |
|---|---|---|---|
| Mean ± STD (m/s) | 2.84 ±0.15 | 2.85 ±0.14 | 2.86 ±0.16 |
| % error (%) | −0.86 | −0.28 | 0.07 |
| Blind area (BA) (%) | 15.28 | 0.62 | 2.26 |
D. Single Hard Spherical Inclusion within Background
Figure 8 shows the reconstructed SWV maps of a region with a single hard spherical inclusion at two positions (0 mm and +10 mm) using three Δϕ’s (0°, 140°, and 180°). As a result, measurement at Δϕ = 0° failed to reliably reconstruct the inclusion in the pushing region (Fig. 8 (b)), but once the push beam was off the inclusion, the inclusion was appropriately reconstructed in the SWV map (Fig. 8 (f)). However, regardless of the inclusion location, both Δϕ’s of 140° and 180° consistently and reliably reconstructed the SWV maps. The dotted black circles (10 mm diameter) in Fig. 8 outline the position and the size of the inclusion. Overall, the shape and the size of the inclusion obtained, based on the SWV map values, show good agreement with the actual characteristics of the inclusion. However, the size of the inclusion in the SWV maps appears to be slightly smaller than the actual size of the inclusion. This is partially due to the kernel length of correlation used for estimating SWV values.
Fig. 8.
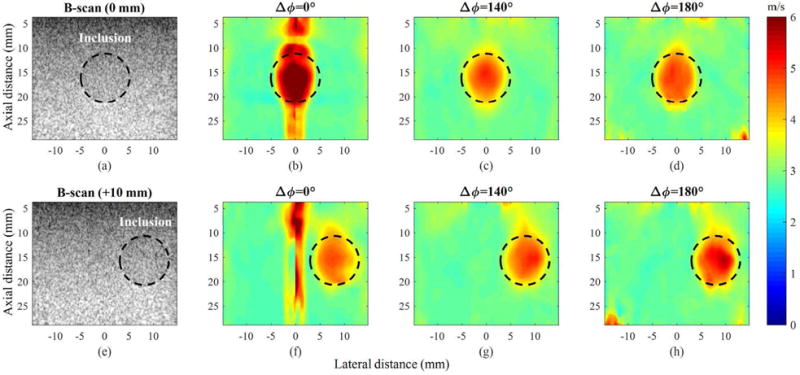
Experimental results from the region of the phantom containing a single stiff inclusion at two lateral positions (0 mm and + 10 mm). (a) B-scan image where the inclusion is located at 0 mm and the corresponding SWV maps obtained with Δϕ’s of (b) 0°, (c) 140°, and (d) 180°. (e) B-scan image where the inclusion is located at +10 mm and the corresponding SWV maps obtained with Δϕ’s of (f) 0°, (g) 140°, and (h) 180°.
Table III summarizes the quantitative assessment of the SWV maps presented in Fig. 8 using the mean, the STD, the % error, and the CNR. First, for the inclusion located at the center (0 mm), the measurement with Δϕ of 0° suffered from overestimation of SWV within the inclusion region (% error is 24.39%) while Δϕ’s of 140° and 180° led to relatively stable reconstruction of SWV both within the inclusion region and the background. Furthermore, the CNR improvements of Δϕ’s of 140° and 180° over that of 0° were 61.21% and 142.65%, respectively. For the inclusion displaced +10 mm laterally, none of the methods suffered from an overestimation of SWV within the inclusion region. The % error results merely show slight underestimation of SWV in the inclusion, which may be due to a measurement error in the nominal value (±5%) or the spherical shape of the inclusion [37]. The CNR values of the three methods were similar, but Δϕ of 140° yielded the highest CNR. Overall, at two positions of inclusion, the measurements with Δϕ of 140°, compared to the other measurements, showed the most consistent means and STDs.
TABLE III.
Quantitative assessment results in the phantom with a stiff spherical target
| Inclusion position | Δϕ =0° | Δϕ =140° | Δϕ =180° | ||
|---|---|---|---|---|---|
| 0 mm | Mean ± STD (m/s) | Inclusion | 6.36 ± 0.64 | 4.71 + 0.19 | 4.69 + 0.13 |
| Background | 2.81 ± 0.12 | 2.87 ± 0.08 | 2.87 ± 0.04 | ||
| % error (%) | Inclusion | 24.39 | −7.87 | −8.19 | |
| Background | −1.91 | 0.33 | 0.46 | ||
| CNR | 5.44 | 8.77 | 13.20 | ||
|
| |||||
| +10 mm | Mean ± STD (m/s) | Inclusion | 4.56 + 0.15 | 4.73 ± 0.16 | 5.09 ± 0.28 |
| Background | 2.79 + 0.11 | 2.82 ± 0.05 | 2.85 ± 0.06 | ||
| % error (%) | Inclusion | −10.81 | −7.35 | −0.43 | |
| Background | −2.33 | −1.23 | −0.49 | ||
| CNR | 11.22 | 7.85 | |||
E. Safety Measurements
The MI, the ISPTA, and the ISPPA, measured for three Δϕ’s (0°, 140°, and 180°) at the foci of the main and grating lobes (Table IV), indicate that the measured safety parameters were below the FDA regulatory limits. It is important to note that although we induced the same voltage (80 Vpp) and used the same number of active elements (i.e., the same f-number) to generate ultrasound waves for the three pushing configurations, the distribution and the concentration of acoustic energy within FOV varied according to Δϕ. As illustrated in Fig. 5, the acoustic pressure of the grating and main lobes is a function of Δϕ. For Δϕ = 0°, all acoustic energy is concentrated mostly in a main lobe, thus the acoustic outputs are the highest but within the FDA guideline. By contrast, pulses with Δϕ’s of 140° and 180° divided the total acoustic energy into more than one push beam and, therefore, may further reduce the safety concerns, thus providing another benefit of dual-phase transmit focusing.
TABLE IV.
Measured safety parameters with three Δϕ’s (0°, 140°, and 180°)
| Δϕ | MI | ISPTA (mW/cm2) | ISPPA (W/cm2) |
|---|---|---|---|
| 0° | 1.73 | 70.49 | 117.48 |
| 140° | 0.77 | 11.40 | 19.00 |
| 180° | 0.72 | 9.45 | 15.76 |
|
| |||
| FDA limit | 1.9 | 720 | 190 |
F. Two Potential Candidates for Creating Simultaneous Multi-Angular Push Beams
We can produce simultaneous multi-angular push beams in two more ways. One approach is to arrange and excite differently steered beams using the sub-divided apertures of an ultrasound transducer. This overall concept is similar to CUSE [14], but the steering angles of the push beams differ, as shown in Fig. 9 (a). However, a typical linear array transducer (e.g., L7-4, Philips Healthcare, Andover, MA, USA) has an element spacing of about 300 μm, which is similar to a wavelength of 4–5 MHz ultrasound, unwanted grating lobes could appear in the FOV once the ultrasound beams are steered. These undesirable grating lobes cause the loss of acoustic energy and obscure the appropriate formation of acoustic radiation force fields. In addition, the sub-divided, reduced size of sub-apertures broadens the width of each beam and degrades the pushing efficiency. Another way is to apply the sparse array technique that drives ultrasound waves using every other element of an array, which deliberately brings two desirable grating lobes into the FOV for angular pushing, is illustrated in Fig. 9 (b). However, as only half of the elements are used, half of the acoustic energy is lost accordingly. Furthermore, not only are we unable to control the magnitudes of the grating lobes, but their magnitudes are also much weaker than that of the main lobe [27]. Therefore, this approach may be ineffective in the creation of multi-angular push beams.
Fig. 9.
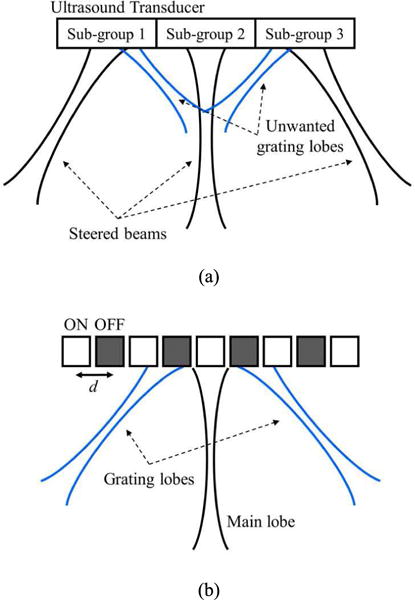
Two possible ways of generating simultaneous multi-angular push beams: (a) steering with sub-divided apertures and (b) a sparse array technique.
Field II simulated acoustic pressure maps, produced with these two methods (i.e., steering with sub-apertures and the sparse array technique), are shown in Fig. 10. For fair comparison, the same parameters, as listed in Table I, were used for push pulses (except their arrangements on the transducer). First, for the steering angles of 10°, no grating lobes appeared (Fig. 10 (a)). However, as the steering angle increased from ±10° to ±40°, the grating lobes started to appear. As the steering angles became ±40°, which is desirable to separate the resultant multi-angular shear waves, the magnitudes of the unwanted grating lobes became similar to those of their main lobes (Fig. 10 (c)). The sparse array technique simultaneously created desirable grating lobes and a main lobe (Fig. 10 (d)). However, the magnitude of the grating lobes, compared to the main lobe, was considerably weaker and intractable. Dual-phase transmit focusing effectively overcame these limitations. According to the selected phase difference, dual-phase transmit focusing distributed the total acoustic energy to one main and two grating lobes, and unlike the sparse array technique, the approach did not suffer from energy loss. In addition, the dual-phase transmit approach uses an entire aperture (not sub-divided apertures) to create multi-angular push beams, and thus, the width of the push beams, unlike those produced by sub-apertures, do not widen.
Fig. 10.

Simulated multi-angular acoustic pressure fields created by the sub-divided aperture approach with steering angles of (a) −10°, 0°, +10°, (b) −25°, 0°, +25°, (c) −40°, 0°,+40°, and (d) the sparse array technique.
Table V summarizes the results of the quantitative assessment of angular push beams based on Field II simulations. Here, we compared three methods (i.e., steering with sub-apertures, the sparse array technique, and dual-phase transmit focusing) with push beams of the same angles (± 40°). For dual-phase transmit focusing, we applied Δϕ of 140°. First, steering with sub-apertures caused energy loss because of undesirable grating lobes, and the reduced size of sub-divided apertures yielded the lowest peak pressure in both the main lobe and the angular beams. In addition, although the sub-aperture approach produced the longest depth of focus (DOF), the larger f-number of sub-divided apertures broadened the lateral beam width, and thus, increased the full width at half maximum (FWHM). The sparse array technique yielded a narrower FWHM than those of the sub-divided apertures, but the peak pressure of the angular beams, compared to that of the main lobe, became less than half. Overall, dual-phase transmit focusing maintained the lateral beam width while preserving peak pressures, which could be ideal in the simultaneous creation of multi-angular push beams. Nevertheless, further studies on optimizing the angular push beams are necessary for the clinical translation of this technique, because our approach distributes the given acoustic energy into three lobes, which lowers the magnitude of shear wave signals compared to single push-based SWEI approaches.
TABLE V.
Quantitative assessment results of push beams created by three methods
| Main lobe | Angular beams | |||||
|---|---|---|---|---|---|---|
|
|
||||||
| Peak pressure (a.u.) | FWHM (mm) | DOF (mm) | Peak pressure (a.u.) | FWHM (mm) | DOF (mm) | |
| Steering with sub-apertures | 0.36 | 2.21 | 10.82 | 0.20 | 3.30 | 13.54 |
| Sparse array technique | 0.50 | 0.91 | 6.41 | 0.23 | 1.67 | 9.61 |
| Dual-phase transmit focusing | 0.42 | 0.91 | 6.43 | 0.42 | 1.65 | 9.56 |
G. Computational Complexity
Computational complexity of MAC-SWEI, requiring multi-directional filtering and reconstruction of four SWV maps, could be one of the concerns for real-time imaging. However, many SWEI-based methods have already adopted (multi-) directional filtering to remove reflected shear waves from boundaries of inclusions or targets [22–24]. In addition, unlike single-push SWEI methods, MAC-SWEI completes the final reconstruction of an SWV map within a single pushing-tracking event; if a pulse repetition frequency of a push pulse is 1 Hz, then the frame rate of SWV maps created by MAC-SWEI is also 1 Hz. However, in conventional SWEI methods, the frame rate could be ½Hz to ¼Hz (depending on the number of push beam applications). Thus, although MAC-SWEI requires four-fold more computations to create a final SWV map, it provides a two- to four-fold faster frame rate. Therefore, for the given frame rate of SWV images, both MAC-SWEI and single-push SWEI methods will have similar computational complexity in terms of the number of estimation of SWV maps. Furthermore, single-push SWEI methods could require longer overall computation times due to additional processes, including beamforming and image formation, for multiple data sets acquired.
IV. Conclusion
We introduced a new way of creating multi-angular push beams, referred to as “dual-phase transmit focusing.” By defining a phase offset that is applied to every other element, dual-phase transmit focusing efficiently and simultaneously creates one main and two grating lobes as pushing sources, which realizes multi-angle compound SWEI (MAC-SWEI). We found that the phase difference Δϕ determines the energy distribution to these three lobes. We investigated three representative configurations with Δϕ’s of 0°, 140°, and 180°, and quantitatively assessed the performance of MAC-SWEI using an elasticity phantom with a single stiff inclusion. Our results suggest that MAC-SWEI can be used to visualize SWV maps reliably, and with improved image quality. Optimizing dual-phase transmit focusing, necessitates additional study related to the optimal selection of Δϕ’s, which may depend on size, shape, or location of a lesion. Thus, our future work will be focused on the optimization of dual-phase transmit focusing and the clinical translation of this technique.
Acknowledgments
The authors would like to thank Jane Chisholm of the Georgia Institute of Technology for her helpful review of the manuscript.
This work was supported by the National Institutes of Health under grants CA149740 and CA158598, and a grant from Breast Cancer Research Foundation.
Biographies
Heechul Yoon received his B.S. and M.S. degrees in electrical engineering from the Sogang University, Seoul, South Korea in 2008 and 2010, respectively.
From 2010 to 2014, he worked in Samsung Electronics, Suwon, South Korea as a researcher on ultrasound signal and image processing. In 2014, he began his Ph.D. studies at the University of Texas at Austin where he conducted studies in the Ultrasound Imaging and Therapeutics Laboratory. In 2015, the laboratory moved to the Georgia Institute of Technology where he is pursuing Ph.D. studies in Electrical and Computer Engineering. He conducts his research at Georgia Tech and Emory University School of Medicine.
His research interests include development and clinical translation of medical imaging technologies including shear wave elasticity imaging and ultrasound-guided photoacoustic imaging.
Salavat Aglyamov received his B.S. and M.S. degrees in Applied Mathematics in 1991 and 1993, respectively, from Moscow State University, Moscow, Russia. He received the Ph.D. degree in Biophysics from the Institute of Theoretical and Experimental Biophysics in 1999, Pushchino, Moscow region, Russia, and following postdoctoral research at the University of Michigan, Ann Arbor. Salavat Aglyamov is currently a research scientist in the Center for Emerging Imaging Technologies, Department of Biomedical Engineering at the University of Texas at Austin. His research interests are in the areas of elastography, tissue biomechanics, biomedical imaging, ultrasound, OCT, photoacoustics and applied mathematics. A major focus of Dr. Aglyamov’s research is to develop noninvasive methods for the diagnosis of soft tissue pathologies based on measuring tissue mechanical properties.

Dr. Stanislav Emelianov is a Joseph M. Pettit Endowed Chair, Georgia Research Alliance Eminent Scholar, and Professor of Electrical & Computer Engineering and Biomedical Engineering at the Georgia Institute of Technology. He is also appointed at Emory University School of Medicine where he is affiliated with Winship Cancer Institute, Department of Radiology, and other clinical units. Furthermore, Dr. Emelianov is Director of the Ultrasound Imaging and Therapeutics Research Laboratory at the Georgia Institute of Technology focused on the translation of diagnostic imaging & therapeutic instrumentation, and nanobiotechnology for clinical applications.
Contributor Information
Heechul Yoon, School of Electrical and Computer Engineering, Georgia Institute of Technology, Atlanta, GA 30332 USA.
Salavat R. Aglyamov, Department of Biomedical Engineering, The University of Texas at Austin, Austin, TX 78712 USA.
Stanislav Y. Emelianov, School of Electrical and Computer Engineering and Wallace H. Coulter Department of Biomedical Engineering, Georgia Institute of Technology and Emory University School of Medicine, Atlanta, GA 30332 USA.
References
- 1.Sarvazyan AP, Rudenko OV, Swanson SD, Fowlkes JB, Emelianov SY. Shear wave elasticity imaging: A new ultrasonic technology of medical diagnostics. Ultrasound Med Biol. 1998 Dec;24:1419–1435. doi: 10.1016/s0301-5629(98)00110-0. [DOI] [PubMed] [Google Scholar]
- 2.Bamber J, Cosgrove D, Dietrich CF, Fromageau J, Bojunga J, Calliada F, et al. EFSUMB guidelines and recommendations on the clinical use of ultrasound elastography. Part 1: Basic principles and technology. Ultraschall Med. 2013;34:169–184. doi: 10.1055/s-0033-1335205. [DOI] [PubMed] [Google Scholar]
- 3.Cosgrove D, Piscaglia F, Bamber J, Bojunga J, Correas JM, Gilja OH, et al. EFSUMB Guidelines and Recommendations on the Clinical Use of Ultrasound Elastography. Part 2: Clinical Applications. Ultraschall in Med. 2013;34:238–253. doi: 10.1055/s-0033-1335375. [DOI] [PubMed] [Google Scholar]
- 4.Aglyamov S, Bouchard R, Graf I, Emelianov S. Breast Elasticity Imaging. In: Markey MK, editor. “Breast Elasticity Imaging,” in Physics of mammographic imaging. Boca Raton, FL: Taylor & Francis Group/CRC press; 2012. pp. 221–238. [Google Scholar]
- 5.Nightingale K, McAleavey S, Trahey G. Shear-wave generation using acoustic radiation force: in vivo and ex vivo results. Ultrasound Med Biol. 2003 Dec;29:1715–1723. doi: 10.1016/j.ultrasmedbio.2003.08.008. [DOI] [PubMed] [Google Scholar]
- 6.Bercoff J, Tanter M, Chaffai S, Fink M. Ultrafast imaging of beamformed shear waves induced by the acoustic radiation force. Application to transient elastography. 2002 IEEE Int Ultrasonics Symp (IUS) 2002:1899–1902. [Google Scholar]
- 7.Palmeri ML, Yufeng D, Rouze NC, Nightingale KR. Dependence of shear wave spectral content on acoustic radiation force excitation duration and spatial beamwidth. 2014 IEEE International Ultrasonics Symposium. 2014:1105–1108. [Google Scholar]
- 8.Nightingale K. Acoustic radiation force impulse (ARFI) imaging: A review. Curr Med Imaging Rev. 2011 Nov;7:328–339. doi: 10.2174/157340511798038657. [DOI] [PMC free article] [PubMed] [Google Scholar]
- 9.Bercoff J, Tanter M, Fink M. Supersonic shear imaging: A new technique for soft tissue elasticity mapping. IEEE Trans Ultrason Ferroelectr Freq Control. 2004;51:396–409. doi: 10.1109/tuffc.2004.1295425. [DOI] [PubMed] [Google Scholar]
- 10.Sarvazyan A, Hall TJ, Urban MW, Fatemi M, Aglyamov SR, Garra BS. An overview of elastography-an emerging branch of medical imaging. Curr Med Imaging Rev. 2011 Nov;7:255–282. doi: 10.2174/157340511798038684. [DOI] [PMC free article] [PubMed] [Google Scholar]
- 11.McAleavey SA, Menon M, Orszulak J. Shear-Modulus Estimation by Application of Spatially-Modulated Impulsive Acoustic Radiation Force. Ultrasonic Imaging. 2007 Apr 1;29:87–104. doi: 10.1177/016173460702900202. 2007. [DOI] [PubMed] [Google Scholar]
- 12.Chen S, Urban MW, Pislaru C, Kinnick R, Zheng Y, Yao A, et al. Shearwave dispersion ultrasound vibrometry (SDUV) for measuring tissue elasticity and viscosity. IEEE Trans Ultrason Ferroelectr Freq Control. 2009;56:55–62. doi: 10.1109/TUFFC.2009.1005. [DOI] [PMC free article] [PubMed] [Google Scholar]
- 13.Deffieux T, Montaldo G, Tanter M, Fink M. Shear wave spectroscopy for in vivo quantification of human soft tissues visco-elasticity. IEEE Trans Med Imaging. 2009;28:313–322. doi: 10.1109/TMI.2008.925077. [DOI] [PubMed] [Google Scholar]
- 14.Song P, Zhao H, Manduca A, Urban MW, Greenleaf JF, Chen S. Comb-push ultrasound shear elastography (CUSE): A novel method for two-dimensional shear elasticity imaging of soft tissues. IEEE Trans Med Imaging. 2012 Jun;31:1821–1832. doi: 10.1109/TMI.2012.2205586. [DOI] [PMC free article] [PubMed] [Google Scholar]
- 15.Song P, Urban MW, Manduca A, Zhao H, Greenleaf JF, Chen S. Comb-push ultrasound shear elastography (CUSE) with various ultrasound push beams. IEEE Trans Med Imaging. 2013;32:1435–1447. doi: 10.1109/TMI.2013.2257831. [DOI] [PMC free article] [PubMed] [Google Scholar]
- 16.Nabavizadeh A, Pengfei S, Shigao C, Greenleaf JF, Urban MW. Multi-source and multi-directional shear wave generation with intersecting steered ultrasound push beams. IEEE Trans Ultrason Ferroelectr Freq Control. 2015;62:647–662. doi: 10.1109/TUFFC.2014.006805. [DOI] [PMC free article] [PubMed] [Google Scholar]
- 17.Tanter M, Bercoff J, Athanasiou A, Deffieux T, Gennisson J-L, Montaldo G, et al. Quantitative assessment of breast lesion viscoelasticity: Initial clinical results using supersonic shear imaging. Ultrasound Med Biol. 2008;34:1373–1386. doi: 10.1016/j.ultrasmedbio.2008.02.002. [DOI] [PubMed] [Google Scholar]
- 18.Denis M, Mehrmohammadi M, Song P, Meixner DD, Fazzio RT, Pruthi S, et al. Comb-push ultrasound shear elastography of breast masses: initial results show promise. PLoS ONE. 2015;10:e0119398. doi: 10.1371/journal.pone.0119398. [DOI] [PMC free article] [PubMed] [Google Scholar]
- 19.Palmeri ML, Nightingale KR. Acoustic radiation force-based elasticity imaging methods. Interface Focus. 2011;1:553–564. doi: 10.1098/rsfs.2011.0023. [DOI] [PMC free article] [PubMed] [Google Scholar]
- 20.Dahl JJ, Pinton GF, Mark L, Agrawal V, Nightingale KR, Trahey GE. A parallel tracking method for acoustic radiation force impulse imaging. IEEE Trans Ultrason Ferroelectr Freq Control. 2007;54:301–312. doi: 10.1109/tuffc.2007.244. [DOI] [PMC free article] [PubMed] [Google Scholar]
- 21.Manduca A, Lake DS, Kruse SA, Ehman RL. Spatio-temporal directional filtering for improved inversion of MR elastography images. Med Image Anal. 2003;7:465–473. doi: 10.1016/s1361-8415(03)00038-0. [DOI] [PubMed] [Google Scholar]
- 22.Song P, Manduca A, Zhao H, Urban MW, Greenleaf JF, Chen S. Fast shear compounding using robust 2-D shear wave speed calculation and multi-directional filtering. Ultrasound Med Biol. 2014;40:1343–1355. doi: 10.1016/j.ultrasmedbio.2013.12.026. [DOI] [PMC free article] [PubMed] [Google Scholar]
- 23.Lipman SL, Rouze NC, Palmeri ML, Nightingale KR. Evaluating the Improvement in Shear Wave Speed Image Quality Using Multidimensional Directional Filters in the Presence of Reflection Artifacts. IEEE Trans Ultrason Ferroelectr Freq Control. 2016;63:1049–1063. doi: 10.1109/TUFFC.2016.2558662. [DOI] [PMC free article] [PubMed] [Google Scholar]
- 24.Deffieux T, Gennisson JL, Bercoff J, Tanter M. On the effects of reflected waves in transient shear wave elastography. IEEE Trans Ultrason Ferroelectr Freq Control. 2011;58:2032–2035. doi: 10.1109/TUFFC.2011.2052. [DOI] [PubMed] [Google Scholar]
- 25.Barthez PY, Léveillé R, Scrivani PV. Side lobes and grating lobes artifacts in ultrasound imaging. Vet Radiol Ultrasound. 1997;38:387–393. doi: 10.1111/j.1740-8261.1997.tb02104.x. [DOI] [PubMed] [Google Scholar]
- 26.Austeng A, Holm S. Sparse 2-D arrays for 3-D phased array imaging - design methods. IEEE Trans Ultrason Ferroelectr Freq Control. 2002;49:1073–1086. doi: 10.1109/tuffc.2002.1026019. [DOI] [PubMed] [Google Scholar]
- 27.Yoon C, Kang BJ, Lee C, Kim HH, Shung KK. Multi-particle trapping and manipulation by a high-frequency array transducer. Appl Phys Lett. 2014;105:214103. doi: 10.1063/1.4902923. [DOI] [PMC free article] [PubMed] [Google Scholar]
- 28.Jensen JA. Field: A program for simulating ultrasound systems. Med Biol Eng Comput. 1996;34:351–353. [Google Scholar]
- 29.Jensen JA, Svendsen NB. Calculation of pressure fields from arbitrarily shaped, apodized, and excited ultrasound transducers. IEEE Trans Ultrason Ferroelectr Freq Control. 1992 Mar;39:262–267. doi: 10.1109/58.139123. [DOI] [PubMed] [Google Scholar]
- 30.Montaldo G, Tanter M, Bercoff J, Benech N, Fink M. Coherent plane-wave compounding for very high frame rate ultrasonography and transient elastography. IEEE Trans Ultrason Ferroelectr Freq Control. 2009;56:489–506. doi: 10.1109/TUFFC.2009.1067. [DOI] [PubMed] [Google Scholar]
- 31.Pinton GF, Dahl JJ, Trahey GE. Rapid tracking of small displacements with ultrasound. IEEE Trans Ultrason Ferroelectr Freq Control. 2006;53:1103–1117. doi: 10.1109/tuffc.2006.1642509. [DOI] [PubMed] [Google Scholar]
- 32.Loupas T, Peterson RB, Gill RW. Experimental evaluation of velocity and power estimation for ultrasound blood flow imaging, by means of a two-dimensional autocorrelation approach. IEEE Trans Ultrason Ferroelectr Freq Control. 1995;42:689–699. [Google Scholar]
- 33.Bae S, Song T-K, Chang JH. New shear wave velocity estimation using arrival time differences in orthogonal directions. 2014 IEEE Int Ultrasonics Symp (IUS) 2014:1113–1116. [Google Scholar]
- 34.Rao M, Chen Q, Shi H, Varghese T. Spatial-angular compounding for elastography using beam steering on linear array transducers. Med Phys. 2006;33:618–626. doi: 10.1118/1.2168429. [DOI] [PMC free article] [PubMed] [Google Scholar]
- 35.Nordenfur T. M.S. thesis. KTH Technol. and Health; Stockholm: 2013. Comparison of pushing sequences for shear wave elastography. [Google Scholar]
- 36.FDA. Guidance for Industry and FDA Staff Information for Manufacturers Seeking Marketing Clearance of Diagnostic Ultrasound Systems and Transducers. 2008 [Online] Available: http://www.fda.gov/RegulatoryInformation/Guidances/ucm070856.htm.
- 37.Rouze NC, Wang MH, Palmeri ML, Nightingale KR. Parameters affecting the resolution and accuracy of 2-D quantitative shear wave images. IEEE Trans Ultrason Ferroelectr Freq Control. 2012;59:1729–1740. doi: 10.1109/TUFFC.2012.2377. [DOI] [PMC free article] [PubMed] [Google Scholar]


