

Abstract
Scope
Evidence suggests that dietary pattern may affect polyphenol absorption and/or metabolism. Further, obesity is associated with lower circulating nutrients, though the reason is unclear. We investigated the pharmacokinetic (PK) response of polyphenols in obese/overweight vs. lean individuals before and after repeated dosing with of grape polyphenols.
Methods and results
A pilot study was conducted in which PK challenges were administered before and after 11 days of repeated dosing with polyphenols. Volunteers (6 lean, 6 overweight/obese) consumed resveratrol, grape seed extract, and grape juice (2,125 mg total polyphenols) daily. On days 1 and 11, blood samples were collected for 6 hours after the polyphenol dose and analyzed for deconjugated catechin, epicatechin, resveratrol, and quercetin. Area under the plasma polyphenol mass by time curves (AUCs) were greater for catechin, epicatechin, and quercetin on day 11 vs. day 1 for low BMI individuals (p=0.039) but not high BMI individuals. Further, AUCs were greater for epicatechin and resveratrol for low vs. high BMI individuals (p=0.041), with a similar trend for catechin (p=0.065), on day 11 but not day 1.
Conclusion
These results suggest that that obesity and repeated exposure may modify polyphenol absorption and/or metabolism in humans.
Keywords: Bioavailability, BMI, Catechin, Epicatechin, Polyphenol, Quercetin, Resveratrol
1 INTRODUCTION
Dietary flavonoids are associated with a number of health benefits, particularly reduction of risk for cardiovascular disease (CVD) and improved glucoregulation [1–5]. Overweight and obese individuals are at increased risk for both CVD and diabetes, and thus may particularly benefit from flavonoid consumption. However, evidence suggests that overweight & obese individuals may have altered absorption or metabolism of some nutrients and dietary components, including flavonoids [6–9].
Previous studies of flavonoid pharmacokinetics have demonstrated that prior exposure to flavonoids may influence subsequent pharmacokinetic (PK) response. To assess the safety of green tea polyphenols for intervention studies, Chow et al. [10] provided epigallocatechin gallate (EGCG) or Polyphenon E (a green tea polyphenol extract) daily for 4 weeks to healthy volunteers, administering a pharmacokinetic challenge at the beginning and the end of the intervention. They observed a significantly greater plasma (EGCG) response after 4 weeks of green tea treatment. Similarly, rats fed Ginkgo biloba extract for 8 days had a significantly greater plasma response for quercetin, kaempferol, and isorhamnetin/tamarixetin compared to rats receiving only a single dose [11]. Finally, Ferruzzi et al. [12] observed a significant increase in plasma response for gallic acid, catechin, and epicatechin from grape seed extract following 10 days of pretreatment compared to that for a single dose. These results suggest that repeated exposure to polyphenols may have important effects on bioavailability. To better understand this effect, we conducted a pilot study in which we challenged lean and overweight/obese individuals (n=12) with grape polyphenols and assessed PK responses of key phenolics before and after 11 days of exposure. A mixture of grape polyphenol sources, including grape seed extract, resveratrol, and grape juice, was chosen due to the potential role of these three preparations in preventing cognitive dysfunction [13]. Specifically, grape seed polyphenol extract and grape juice reduce Aβ oligomerization, a contributor to Alzheimer’s Disease, in rodent models [14, 15], and resveratrol reduces neuroinflammation in rodents to protect cognitive function [16].
2 MATERIALS AND METHODS
2.1 Subjects & screening
Participants were recruited from the Washington, DC area through email advertisement to volunteers in the Beltsville Human Nutrition Research Center (BHNRC) Volunteer Database (~3000 individuals) and to employees of Federal agencies located near BHNRC (~4000 individuals). Exclusion criteria were as follows: fasting glucose > 7 mmol/L; blood pressure >160/100 mm Hg; fasting triglycerides > 3.4 mmol/L; presence of kidney disease, liver disease, diabetes, gout, hyperthyroidism, untreated hypothyroidism, cancer, gastrointestinal diseases or disorders, bariatric surgery, pancreatic disease, other metabolic diseases, pregnancy, lactation, recent use of polyphenol supplements, or recent use of antibiotics. After providing written informed consent, volunteers completed a study application and health history questionnaire, then provided a blood and urine sample for medical evaluation. Procedures were conducted according to the Declaration of Helsinki and were approved by the MedStar Research Institute IRB.
2.2 Study design & intervention
This study was a pilot study to determine the translatability of the observation in rodents that repeated intake alters pharmacokinetic response of grape polyphenols [12]. The study was conducted as a parallel arm with half the subjects being lean (n=6 with BMI<25; 3 men/3 women) and half being overweight/obese (n=6 with BMI>25; 4 men, 2 women). After a 2-day low polyphenol wash-in diet, volunteers received a grape polyphenol-rich PK challenge of resveratrol (Res), grape seed extract (GSE), and grape juice, followed by serial blood collection for 6 hours. After the dose, no other foods were provided for 4 hours, at which time a light meal devoid of polyphenols (100 g bagel with 30 g cream cheese) was provided for the subjects’ comfort. For an additional 9 days, volunteers consumed the mixed polyphenols daily (250 mg Res + 450 mg GSE + 10 oz. grape juice at breakfast and 450 mg GSE + 10 oz. grape juice at dinner, for a daily total of 250 mg Res, 900 mg GSE, and 20 oz. grape juice) while continuing a very low polyphenol background diet, then received another PK challenge identical to the first challenge, followed again by serial blood collection for 6 hours.
2.3 Polyphenol Treatment
The PK challenge was a bolus dose of mixed grape polyphenols: 250 mg resveratrol (MegaResveratrol, Brookfield, CT), 900 mg grape seed polyphenol extract (MetaNatural-BP, Madera, CA), and 20 ounces of grape juice (Welch’s, Concord, MA). Total polyphenol dose was estimated to be 2,125 mg by LC-MS. The dose was selected to be on the high end of well tolerated doses fed previously to humans, to maximize physiologic effects [17–20], and to be deliverable in increments of pre-packed amounts from a reputable source.
2.4 Sample collection & analysis
On the morning of each PK challenge, after a 12 hour fast, an indwelling catheter was placed in an antecubital vein and two baseline blood samples, separated by 15 minutes, were collected prior to consumption of the polyphenol dose. Blood was collected for 6 hours following each PK challenge dose, at times 0.5 hours, 1 hour, 1.5 hour, 2 hour, 2.5 hour, 3 hour, 4 hour, 5 hour, and 6 hour. Blood samples were collected in EDTA vacutainers and promptly centrifuged. Plasma was stored with ascorbic acid in cryovials at −80°C until analysis.
Immediately prior to analysis, samples were thawed and hydrolyzed to remove conjugated groups, and analyses were performed on aglycones. Polyphenol aglycones were extracted from plasma using solid phase extraction as previously described [21]. Extracts were then analyzed by LC-MS/MS on an Agilent 1200 LC system coupled to an Agilent 6460 QQQ mass spectrometer (Santa Clara, CA) against external standard curves, as previously described [21].
2.5 Mathematical and Statistical Calculations
Plasma mass of each polyphenol was used for analysis instead of concentration to adjust for differences in volume of distribution (plasma volume) between lean and overweight/obese individuals. Plasma volume for each participant was calculated by subtracting blood cell volume (determined by hematocrit) from blood volume (calculated according to Lemmens et al. [22]); this method was chosen due to its applicability to a wide range of BMI values. Area under the plasma polyphenol mass by time curve (AUC) was calculated by the middle Reimann Sum method, which is very similar to the trapezoidal method, but uses the average height of the trapezoid in the calculation. Percent elevation of AUC was determined by calculating the difference between the plasma response values, then dividing by the value for lean individuals (for lean-obese comparison) or by the day 1 PK values (for day 1 vs. day 11 comparisons), and multiplying by 100. After confirming normality by the Shapiro-Wilk test, peak plasma mass and AUC were compared by t-test (Sigmaplot 12.0) between lean and obese individuals and between d1 and d11. Differences were considered statistically significant at p<0.05 and a trend for significance was considered at p<0.1.
3 RESULTS
3.1 Participant Characteristics
Study participants (7 male, 5 female) had the following characteristics (mean±SEM, Table 1): Lean group, consisting of 3 men and 3 women – age 62.5±0.8 y, BMI of 23.5±0.7 kg/m2, fasting glucose of 4.8±0.2 mmol/L, fasting triglyceride of 1.0±0.2 mmol/L; Overweight/obese group, consisting of 4 men and 2 women – age 65.2±1.4 y, BMI of 30.6±0.6 kg/m2, fasting glucose of 5.9±0.3 mmol/L, fasting triglyceride of 1.4±0.2 mmol/L. The overweight/obese group had significantly greater BMI and fasting glucose than the lean group (p<0.05).
Table 1.
Characteristics of Lean and Overweight/Obese Volunteers
| Lean Group (n=6) | Overweight/Obese Group (n=6) | |
|---|---|---|
| BMI (kg/m2) | 23.5 ± 0.7a | 30.6 ± 0.6b |
| Age (y) | 62.5 ± 0.8 | 65.2 ± 1.4 |
| Fasting glucose (mmol/L) | 4.8 ± 0.2a | 5.9 ± 0.3b |
| Fasting triglycerides (mmol/L) | 1.0 ± 0.2 | 1.4 ± 0.2 |
Mean+SEM. Superscripts indicate difference between participant groups, p<0.05.
3.2 Plasma polyphenol kinetic response
Mean plasma kinetic profiles are shown in Figure 1. Because this was a pilot study, the sample size was small and power was uncertain prior to the study. For some measures, the variability resulted in insufficient power to properly assess statistical difference. Variability was lowest for catechin and epicatechin measures for the Low BMI group, with power for some comparisons as high as 100%. Variability for resveratrol measures resulted in power that generally fell below 15%. Again, because this was a pilot study, we did not have sufficient data on which to power the comparisons prior to the intervention. Still, many measures were sufficiently powered, providing intriguing results with respect to the influence of obesity/adiposity and repeated intake on polyphenol bioavailability and/or metabolism.
Figure 1.
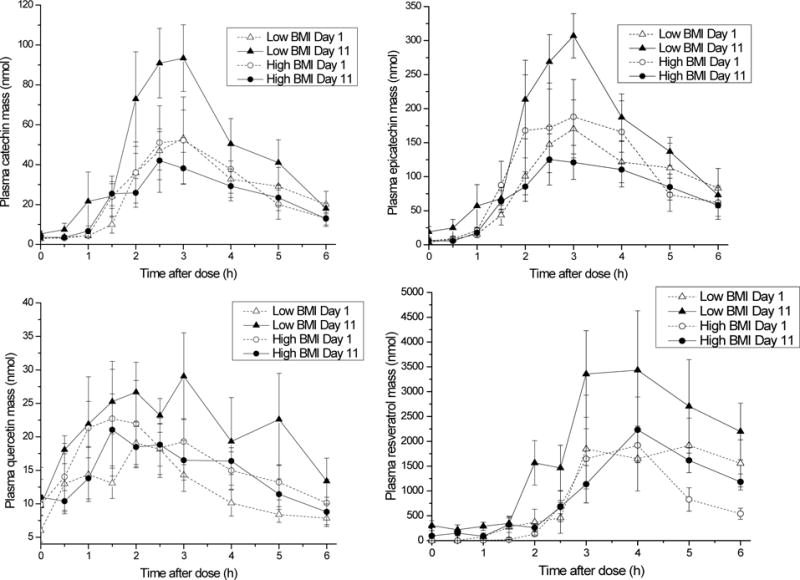
Mean analyte mass in plasma as a function of time after a bolus dose of mixed grape polyphenols, before and after repeated intake of grape polyphenols for 11 days. Error bars represent SEM (n=6).
No differences were detected in peak plasma mass or AUC for catechin, epicatechin, quercetin, or resveratrol for lean vs. overweight/obese after the first PK challenge (Table 2). After 10 additional days of dosing with grape polyphenols, lean individuals demonstrated a significant increase in AUC for catechin, epicatechin, and quercetin and for peak plasma mass for catechin and epicatechin, with a trend for quercetin not quite meeting statistical significance. The relative AUC elevation for lean individuals after repeated exposure compared to the first exposure was 104% for catechin, 89% for epicatechin, and 69% for quercetin. AUC for lean individuals for resveratrol after repeated exposure was 99% higher than the AUC after the first polyphenol exposure; however, the variation was greater for resveratrol AUC and the difference did not reach statistical significance, as this test was underpowered; the variability in response to resveratrol resulted in power for resveratrol comparisons all falling below 15%. Unlike lean individuals, overweight/obese individuals did not exhibit an increase in plasma PK response after repeated exposure.
Table 2.
Plasma Analyte Response by Lean and Overweight/Obese Individuals to a Bolus Dose of Grape Polyphenols as Resveratrol, Grape Seed Extract, and Grape Juice
| Low BMI | High BMI | Low BMI vs. High BMI | ||||||
|---|---|---|---|---|---|---|---|---|
| Day 1 | Day 11 | P-value | Day 1 | Day 11 | P-value | D1 P-value | D11 P-value | |
| Plasma Mass AUC (nmol × hr) | ||||||||
| Catechin | 137.2±34.9 | 280.0±54.9 | 0.019 | 163.5±52.8 | 140.4±22.4 | 0.60 | 0.59 | 0.065 |
| Epicatechin | 482.3±125.6 | 910.1±117.3 | 0.001 | 641.3±195.7 | 465.2±67.2 | 0.28 | 0.49 | 0.008 |
| Resveratrol | 5908.7±2634.7 | 11,772.1±3,337.7 | 0.27 | 4677.5±989.1 | 6063.0±781.0 | 0.20 | 0.67 | 0.041 |
| Quercetin | 77.5±11.5 | 130.3±21.5 | 0.039 | 219.6±119.5 | 88.6±14.3 | 0.29 | 0.39 | 0.14 |
| Peak Plasma Mass (nmol) | ||||||||
| Catechin | 54.3±14.3 | 108.4±19.9 | 0.015 | 69.6±22.7 | 61.5±10.7 | 0.68 | 0.49 | 0.065 |
| Epicatechin | 176.5±45.5 | 332.3±33.4 | 0.001 | 245.8±78.2 | 178.0±20.7 | 0.33 | 0.70 | 0.003 |
| Resveratrol | 2,779.1±1,213.1 | 3,956.3±1,102.6 | 0.55 | 2184.3±439.9 | 2387.8±1595.2 | 0.70 | 0.66 | 0.093 |
| Quercetin | 24.4±4.2 | 38.8±5.4 | 0.061 | 91.1±47.5 | 24.7±4.5 | 0.22 | 0.31 | 0.073 |
Mean+SEM. Note, this was a pilot study; some analyses were underpowered (see results section).
After adaptation to repeated grape polyphenol intake, lean individuals demonstrated a significantly greater plasma response than obese individuals. AUC for lean individuals compared to obese were higher by 96% for epicatechin and 94% for resveratrol; catechin AUC was 100% higher, but this difference did not quite reach statistical significance (p=0.065). For plasma peak mass, overweight/obese individuals had significantly lower levels or a trend toward lower levels for catechin (p=0.065), epicatechin (p=0.003), resveratrol (p=0.093), and quercetin (p=0.073) compared to lean individuals.
DISCUSSION
The condition of being overweight or obese carries with it increased risk for chronic diseases, including CVD, stroke, and diabetes. Therefore, overweight and obese individuals would benefit from dietary and lifestyle factors that can lower those risks. Polyphenols have been associated with reduced risk for CVD, stroke, and diabetes, and they are carried in a variety of palatable foods, including berries, tea, coffee, nuts, and cocoa. Thus, high polyphenol foods may be a feasible lifestyle modification for improving health of overweight and obese individuals, as well as lean individuals.
Bioactive compounds must be absorbed across the gastrointestinal tract to convey many of their systemic health benefits. However, the bioavailability and metabolism of several nutrients have appeared in previous studies to be influenced by obesity [6–8], and the bioavailability of polyphenols has been demonstrated previously to be influenced by repeated intake [10–12]. The present findings are in accord with those previous results.
The changes observed may be related to a number of processes involved in absorption and excretion of polyphenols. Transport of phenolic compounds across the brush border is thought to involve transporters including sodium-dependent glucose transporter 1 (SGLT1) [23], glucose transporter 2 (GLUT2) [23], and monocarboxylate transporter 1 (MCT1) [24]. After absorption, polyphenols can be effluxed back into the intestinal lumen via multidrug resistance-associated protein (MRP1/2) [24] or can be conjugated through methylation [25], glucuronidation [26] or sulfation [27], then excreted in the urine. Alterations in colonic microbiota are not likely the direct source of the specific results observed in this study based on the particular analytes measured, which represented the whole compounds, either intact or conjugated, and prior to interaction with gut microbiota. Future studies will evaluate changes in phenolic acids potentially generated from gut microbiota. At this point, the specific mechanism for the change in polyphenol plasma response after repeated exposure remains unclear, as does the difference in response between lean and overweight/obese individuals.
A recent study reported that anthocyanin metabolism may be compromised in overweight/obese individuals. Specifically, plasma and urinary concentrations of methylated metabolites of cyanidin were reported to be slightly less in overweight/obese individuals compared to lean individuals, though the difference did not meet statistical significance [9]. A possible explanation is related to the observation that rats fed a high fat diet had reduced expression of catechol-O-methyltransferase (COMT) [28]. However, this observation does not explain the results of the present study.
Overweight/obese individuals have larger blood and plasma volumes than lean individuals, providing a larger volume in which to distribute the polyphenols, potentially resulting in lower plasma concentrations for obese compared to lean individuals. However, these data were normalized to plasma volume, and total mass in plasma was analyzed rather than concentration, thus eliminating distribution volume as a concern or possible explanation for the results.
The difference in circulating plasma concentrations of nutrients and phytochemicals between lean and overweight/obese individuals may in some cases be related to deposition in adipose tissue. Polyphenol metabolites have been observed in adipose, for example cocoa flavanol metabolites in porcine adipose tissue [29] and grape seed flavanols & metabolites in rat adipose tissue [30]. The effect of adiposity on differential deposition of polyphenols and their metabolites in adipose tissue has yet to be explored.
We have associated the differences in polyphenol kinetic response to differing BMI; however, there may be other phenotypic characteristics that co-present with high BMI and may be more closely linked to the mechanisms involved. Mechanisms to be explored include regulation of gastrointestinal and cell transport, alterations in phase II metabolism, and gut inflammation. It will be important to be mindful of a broad range of phenotypic differences when trying to identify the mechanism by which lean and overweight/obese have different responses to polyphenols.
These data demonstrate the complicated nature of polyphenol absorption and elimination. Understanding dietary exposure will likely need to take into account recent diet history and phenotype. Consuming large doses of a nutrient at longer intervals may not convey the same health benefits as consuming smaller doses at shorter intervals, and lean vs. overweight/obese individuals may require different guidance regarding quantities and patterns of consumption for polyphenol rich foods.
Acknowledgments
This study was supported by the U.S. Department of Agriculture and was also supported in part by USDA NIFA Award Number 2014-67017-21837 and by Grant Number P50 AT008661-01 from the NCCIH and the ODS. Dr. Pasinetti holds a VA Career Scientist Award. We acknowledge that the contents of this study do not represent the views of the NCCIH, the ODS, the NIH, or the U.S. Department of Veterans Affairs.
This work was supported by the U.S. Department of Agriculture’s Agriculture Research Service, by USDA NIFA Award Number 2014-67017-21837, and by Grant Number P50 AT008661-01 from the NCCIH and the ODS.
Abbreviations
- AUC
area under the curve
- COMT
catechol-O-methyl transferase
- CVD
cardiovascular disease
- EGCG
epigallocatechin gallate
- GLUT2
glucose transporter 2
- GSE
grape seed extract
- MCT1
monocarboxylate transporter 1
- MRP1/2
multidrug resistance-associated protein
- PK
pharmacokinetic
- Res
resveratrol
- SGLT1
sodium-dependent glucose transporter 1
Footnotes
Author contributions
JAN, MGF, GMP, LH designed the study; JAN, SKG, DJB conducted the clinical intervention; TYC, AIT, MGF analyzed the samples; JAN, MGF interpreted the data; JAN drafted the manuscript.
Mention of trade names or commercial products in this publication is solely for the purpose of providing specific information and does not imply recommendation or endorsement by the US Department of Agriculture (USDA).
USDA is an equal opportunity provider and employer.
Clinical Trial Registry: NCT01751750
References
- 1.Larsson SC. Coffee, tea, and cocoa and risk of stroke. Stroke. 2014;45:309–14. doi: 10.1161/STROKEAHA.113.003131. [DOI] [PubMed] [Google Scholar]
- 2.Rodriguez-Mateos A, et al. Berry (poly)phenols and cardiovascular health. J Agric Food Chem. 2014;62:3842–51. doi: 10.1021/jf403757g. [DOI] [PubMed] [Google Scholar]
- 3.Munir KM, et al. Mechanisms for food polyphenols to ameliorate insulin resistance and endothelial dysfunction: therapeutic implications for diabetes and its cardiovascular complications. Am J Physiol Endocrinol Metab. 2013;305:E679–86. doi: 10.1152/ajpendo.00377.2013. [DOI] [PMC free article] [PubMed] [Google Scholar]
- 4.Babu PV, Liu D, Gilbert ER. Recent advances in understanding the anti-diabetic actions of dietary flavonoids. J Nutr Biochem. 2013;24:1777–89. doi: 10.1016/j.jnutbio.2013.06.003. [DOI] [PMC free article] [PubMed] [Google Scholar]
- 5.Kim Y, Keogh JB, Clifton PM. Polyphenols and Glycemic Control. Nutrients. 2016;8 doi: 10.3390/nu8010017. [DOI] [PMC free article] [PubMed] [Google Scholar]
- 6.Wise JA, et al. beta-Carotene and alpha-tocopherol in healthy overweight adults; depletion kinetics are correlated with adiposity. Int J Food Sci Nutr. 2009;60(Suppl 3):65–75. doi: 10.1080/09637480902852553. [DOI] [PubMed] [Google Scholar]
- 7.Mahabir S, et al. Measures of adiposity and body fat distribution in relation to serum folate levels in postmenopausal women in a feeding study. Eur J Clin Nutr. 2008;62:644–50. doi: 10.1038/sj.ejcn.1602771. [DOI] [PMC free article] [PubMed] [Google Scholar]
- 8.Shea MK, et al. Adulthood obesity is positively associated with adipose tissue concentrations of vitamin K and inversely associated with circulating indicators of vitamin K status in men and women. J Nutr. 2010;140:1029–34. doi: 10.3945/jn.109.118380. [DOI] [PMC free article] [PubMed] [Google Scholar]
- 9.Marques C, et al. Pharmacokinetics of blackberry anthocyanins consumed with or without ethanol: A randomized and crossover trial. Mol Nutr Food Res. 2016;60:2319–2330. doi: 10.1002/mnfr.201600143. [DOI] [PubMed] [Google Scholar]
- 10.Chow HH, et al. Pharmacokinetics and safety of green tea polyphenols after multiple-dose administration of epigallocatechin gallate and polyphenon E in healthy individuals. Clin Cancer Res. 2003;9:3312–9. [PubMed] [Google Scholar]
- 11.Rangel-Ordonez L, et al. Plasma levels and distribution of flavonoids in rat brain after single and repeated doses of standardized Ginkgo biloba extract EGb 761(R) Planta Med. 2010;76:1683–90. doi: 10.1055/s-0030-1249962. [DOI] [PubMed] [Google Scholar]
- 12.Ferruzzi MG, et al. Bioavailability of gallic acid and catechins from grape seed polyphenol extract is improved by repeated dosing in rats: implications for treatment in Alzheimer’s disease. J Alzheimers Dis. 2009;18:113–24. doi: 10.3233/JAD-2009-1135. [DOI] [PMC free article] [PubMed] [Google Scholar]
- 13.Pasinetti GM, et al. Roles of resveratrol and other grape-derived polyphenols in Alzheimer’s disease prevention and treatment. Biochim Biophys Acta. 2015;1852:1202–8. doi: 10.1016/j.bbadis.2014.10.006. [DOI] [PMC free article] [PubMed] [Google Scholar]
- 14.Wang J, et al. Grape-derived polyphenolics prevent Abeta oligomerization and attenuate cognitive deterioration in a mouse model of Alzheimer’s disease. J Neurosci. 2008;28:6388–92. doi: 10.1523/JNEUROSCI.0364-08.2008. [DOI] [PMC free article] [PubMed] [Google Scholar]
- 15.Ho L, et al. Identification of brain-targeted bioactive dietary quercetin-3-O-glucuronide as a novel intervention for Alzheimer’s disease. FASEB J. 2013;27:769–81. doi: 10.1096/fj.12-212118. [DOI] [PMC free article] [PubMed] [Google Scholar]
- 16.Abraham J, Johnson RW. Consuming a diet supplemented with resveratrol reduced infection-related neuroinflammation and deficits in working memory in aged mice. Rejuvenation Res. 2009;12:445–53. doi: 10.1089/rej.2009.0888. [DOI] [PMC free article] [PubMed] [Google Scholar]
- 17.Wang LX, et al. Resveratrol glucuronides as the metabolites of resveratrol in humans: characterization, synthesis, and anti-HIV activity. J Pharm Sci. 2004;93:2448–57. doi: 10.1002/jps.20156. [DOI] [PubMed] [Google Scholar]
- 18.Kennedy DO, et al. Effects of resveratrol on cerebral blood flow variables and cognitive performance in humans: a double-blind, placebo-controlled, crossover investigation. Am J Clin Nutr. 2010;91:1590–7. doi: 10.3945/ajcn.2009.28641. [DOI] [PubMed] [Google Scholar]
- 19.Patel KR, et al. Clinical trials of resveratrol. Ann N Y Acad Sci. 2011;1215:161–9. doi: 10.1111/j.1749-6632.2010.05853.x. [DOI] [PubMed] [Google Scholar]
- 20.Ward NC, et al. Supplementation with grape seed polyphenols results in increased urinary excretion of 3-hydroxyphenylpropionic Acid, an important metabolite of proanthocyanidins in humans. J Agric Food Chem. 2004;52:5545–9. doi: 10.1021/jf049404r. [DOI] [PubMed] [Google Scholar]
- 21.Wang J, et al. Brain-targeted proanthocyanidin metabolites for Alzheimer’s disease treatment. J Neurosci. 2012;32:5144–50. doi: 10.1523/JNEUROSCI.6437-11.2012. [DOI] [PMC free article] [PubMed] [Google Scholar]
- 22.Lemmens HJ, Bernstein DP, Brodsky JB. Estimating blood volume in obese and morbidly obese patients. Obes Surg. 2006;16:773–6. doi: 10.1381/096089206777346673. [DOI] [PubMed] [Google Scholar]
- 23.Farrell TL, et al. Attenuation of glucose transport across Caco-2 cell monolayers by a polyphenol-rich herbal extract: interactions with SGLT1 and GLUT2 transporters. Biofactors. 2013;39:448–56. doi: 10.1002/biof.1090. [DOI] [PubMed] [Google Scholar]
- 24.Vaidyanathan JB, Walle T. Cellular uptake and efflux of the tea flavonoid (−)epicatechin-3-gallate in the human intestinal cell line Caco-2. J Pharmacol Exp Ther. 2003;307:745–52. doi: 10.1124/jpet.103.054296. [DOI] [PubMed] [Google Scholar]
- 25.Kay CD, et al. Anthocyanin metabolites in human urine and serum. Br J Nutr. 2004;91:933–42. doi: 10.1079/bjn20041126. [DOI] [PubMed] [Google Scholar]
- 26.Carkeet C, Clevidence BA, Novotny JA. Anthocyanin excretion by humans increases linearly with increasing strawberry dose. J Nutr. 2008;138:897–902. doi: 10.1093/jn/138.5.897. [DOI] [PubMed] [Google Scholar]
- 27.Mullen W, et al. Bioavailability of pelargonidin-3-O-glucoside and its metabolites in humans following the ingestion of strawberries with and without cream. J Agric Food Chem. 2008;56:713–9. doi: 10.1021/jf072000p. [DOI] [PubMed] [Google Scholar]
- 28.Lu C, et al. Green tea polyphenols reduce body weight in rats by modulating obesity-related genes. PLoS One. 2012;7:e38332. doi: 10.1371/journal.pone.0038332. [DOI] [PMC free article] [PubMed] [Google Scholar]
- 29.Jang S, et al. Flavanol-Enriched Cocoa Powder Alters the Intestinal Microbiota, Tissue and Fluid Metabolite Profiles, and Intestinal Gene Expression in Pigs. J Nutr. 2016;146:673–80. doi: 10.3945/jn.115.222968. [DOI] [PMC free article] [PubMed] [Google Scholar]
- 30.Margalef M, et al. Gender-related similarities and differences in the body distribution of grape seed flavanols in rats. Mol Nutr Food Res. 2016;60:760–72. doi: 10.1002/mnfr.201500717. [DOI] [PubMed] [Google Scholar]