

Abstract
Obesity is becoming a leading cause of health problems world-wide. Obesity and overweight are associated with the structural and chemical changes in tissues; however, few methods exist that allow for concurrent measurement of these changes. Using Brillouin and Raman microspectroscopy, both the mechanical and chemical differences can be assessed simultaneously. We hypothesized that Brillouin spectroscopy can measure the adipose tissues’ stiffness, which increases in obesity. Samples of brown and white adipose tissues obtained from control and diet-induced obese adult rats were analyzed. The results show that both adipose tissues of the obese group exhibit a greater high-frequency longitudinal elastic modulus than the control samples, and that the brown fat is generally stiffer than white adipose. The Raman spectra indicates that the lipids’ accumulation in adipose tissue outpaces the fibrosis, and that the high-fat diet has a greater effect on the brown adipose than the white fat. Overall, the powerful combination of Brillouin and Raman microspectroscopies successfully assessed both the mechanical properties and chemical composition of adipose tissue simultaneously for the first time. The results indicate that the adipose tissue experiences an obesity-induced increase in stiffness and lipid content, with the brown adipose tissue undergoing a more pronounced change compared to white adipose.
Keywords: Brillouin spectroscopy, Raman spectroscopy, obesity, adipose tissue, stiffness
Graphical Abstract
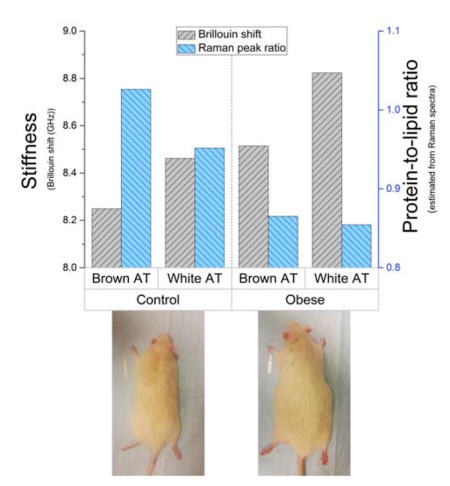
Obesity is associated with tissues’ structural and chemical changes; however, few methods are capable of their concurrent measurement. Using a powerful combination of Brillouin and Raman microspectroscopy, adipose tissue’s mechanical and chemical differences between control and obese rats are assessed simultaneously for the first time. The results indicate the adipose tissue experiences an obesity-induced increase in stiffness and lipid content, with brown adipose undergoing a greater change than white adipose.
1. Introduction
The prevalence of obesity has been on the rise over the past several decades; an estimated 1.9 billion adults worldwide were overweight or obese in 2014. [1] It is becoming a global epidemic, and the incidence of obesity and overweight is only expected to increase further. The causes of obesity range from poor dietary choices and lack of exercise to hereditary predisposition and adverse effects of medications. Obesity and overweight are associated with an increased risk of chronic health conditions, such as coronary heart disease, hypertension, diabetes, sleep-breathing disorders and some types of cancer. [2,3]
Obesity and overweight are characterized by increased adiposity – the ratio of the lipids stored in adipose tissue to the total body mass. The increase in lipid storage is accomplished with both an enlargement of the existing adipocytes (hypertrophy), and an increase in the number of new adipocytes (hyperplasia). During the progression of obesity, the adipose tissue undergoes remodeling, which includes the changes in the cell type and distribution, size and function, as well as changes to the composition and structure of the extracellular matrix (ECM). [4,5]
The changes occurring during weight gain have an effect on the mechanical properties of both adipocytes and the adipose tissue (AT). On microscopic level, the mechanical properties of adipocytes are largely determined by the number, size, and content of their lipid droplets. [6] On the macroscopic level the stiffness of the AT is determined by the ECM and cellular composition of the tissue (including type, size and distribution of cells). [4,7] Adipocytes are mechanosensitive and mechanoresponsive cells whose differentiation and function are affected by the applied stress and mechanical properties of their environment, [8,9] which is, in turn, affected by the surrounding adipocytes.
The mechanical properties of AT are important to its proper function. Changes in these properties may interfere with the role of the tissue in protection against mechanical stress, while the changes in the adipocytes’ environment have a potential to affect lipid storage. However, there is limited information on mechanical properties of AT. [10] The studies that did investigate the elastic properties of AT used destructive tension and compression testing and investigated only bulk properties of the sampled tissue. These techniques cannot be applied to investigation of elastic properties of individual adipocytes, which requires greater spatial resolution. On the other hand, atomic force microscopy, [6] while suitable for measurements of individual cells, cannot investigate tissue mechanical properties. There is, therefore, a need for a method of mechanical characterization of AT that is suitable for noninvasive analysis of both bulk tissue and individual cells.
Unlike other techniques, elastography based on Brillouin scattering provides non-destructive measurements of elasticity (specifically, the high-frequency longitudinal elastic modulus) with high spatial resolution. Brillouin scattering is an inelastic scattering phenomenon that occurs due to the interaction of the incident photons with the sample’s spontaneous phonons. The inelastic interaction results in a small, 1–10 GHz, frequency shift of the scattered photon compared to that of the incident light. This frequency shift, which is often called Brillouin shift, follows , where n is the material’s index of refraction, Vs is the speed of sound in the material, λ0 is the wavelength of the incident light, and θ is the angle between the incident and scattered light (the collection angle).
The measured Brillouin shift can be used to assess material’s mechanical properties, such as speed of sound and, correspondingly, the high-frequency longitudinal elastic modulus. The speed of sound for collection angle θ = π can be calculated from the measured Brillouin frequency shift: . The speed of sound is related to the real part of the longitudinal modulus, M′, as , where ρ is the material’s mass density. The high-frequency longitudinal elastic modulus can, therefore, be calculated directly from the Brillouin shift for backscattered signal collection as . Brillouin elastography (also known as Brillouin spectroscopy), an emerging spectroscopic technique, [11,12] is capable of assessing the elasticity for biomedical applications on the level of tissue [13–15] and individual cells. [16,17]
The obesity-related changes in the AT mechanical properties are related to the composition and organization of ECM; [7] however the accumulation of the collagen is not the only contribution to the increase in stiffness. [18] Evaluating the changes in the composition of AT would prove a useful tool to understand the changes in the elasticity. There are many different approaches to chemical assessment of the AT, such as fluorescence imaging, second-harmonic generation microscopy, [7] and Raman spectroscopy. [19,20] Raman spectroscopy can be combined with Brillouin elastography for simultaneous measurements. [17,21–23] Raman spectroscopy is based on inelastic scattering that occurs due to specific molecular vibrations in the molecule of interest. The scattered photon exhibits a frequency shift compared to the frequency of the incident photon. The full Raman spectrum will, thus, represent the ensemble of vibrations of the molecule under study and can be used to chemically characterize the sample. The Brillouin and Raman spectral measurements can be recorded simultaneously from the same position on the sample to provide complimentary assessment of the sample’s mechanical properties and chemical composition. [17,23]
The AT is characterized into two distinct forms: white adipose tissue (WAT) and brown adipose tissue (BAT). The two types of AT possess different structural characteristics, biological functions, and localization. [24] The mechanical properties and structure of the AT are generally determined by the mechanical load acted upon it, and vary by the anatomical location. [10] White and brown adipose are associated differently with obesity, and may exhibit varying degree of changes. The current study obtains measurements of elasticity and composition from both white and brown adipose in lean and obese rodents.
Mechanical properties of AT are crucial for its proper function, and they can be affected by obesity and overweight on both microscopic and macroscopic levels. However, there are few studies that focused on evaluating the obesity-induced changes in AT’s elastic properties, most of which used destructive techniques that assessed the properties in either tissue or cell culture, but are not suitable for both. Additionally, these studies either did not obtain chemical information, or obtained chemical information separately from the mechanical measurements. In the present study, we have utilized non-destructive Brillouin and Raman spectroscopy to obtain simultaneous mechanical and chemical information, allowing for a more thorough characterization of the sampled location. We have successfully assessed the changes in mechanical properties and chemical composition of BAT and WAT in lean (control group) and diet-induced obese (high-fat diet, HFD, group) rats. The results support our hypothesis that the stiffness and lipid content of adipose tissues increases in obesity, with an additional indication that the BAT is affected greater than the WAT.
2. Materials and Methods
2.1. Animals
The tissue samples for the current study were obtained from adult male Sprague-Dawley rats of the same age, 7-months old. All animal procedures were reviewed and approved by our Institutional Animal Care and Use Committee and were in accordance with federal and local regulations. The rats were divided into two groups, 3 per group, and given unlimited access to food and water. The diet-induced obese group received high-fat diet (HFD) with 60% energy from fat (#58Y1, TestDiet, St. Louis, MO, USA), while the control group received matched regular diet with 10% energy from fat (#58Y2, TestDiet, St. Louis, MO, USA). The animals were sacrificed after 16 weeks. On the experimental day, all rats were anesthetized with a solution containing a combination of Fentanyl/Droperidol (0.3 mL/kg IM) and Diazepam (2.5 mg/kg IM). Prior to sample collection, the rat was shaved in the areas of interest to prevent hair getting on the samples. Subsequently, the chest was opened (which is a terminal procedure) and the samples of white and brown adipose tissues were collected immediately post mortem through surgical extraction.
2.2. Sample preparation and analysis
WAT was collected from inguinal adipose deposit. The euthanized rat was placed on its back, the skin on lower abdomen was lifted using tweezers, and incised, revealing a large white fat deposit located between the abdomen and the hind limb. The sample of the WAT was dissected and placed in a sealed container on ice.
Next, BAT was obtained from the interscapular brown adipose tissue (IBAT) deposit. The animal was placed on the abdomen, and the skin approximately one inch below the shoulder blades was grasped with tweezers, lifted, and incised. The skin was widely cut laterally and forward to open the shoulder region. The revealed lightly-colored fat pad contained IBAT covered with a thin layer of white adipose. The WAT was carefully lifted and excised, revealing a butterfly-shaped darker-colored BAT. The brown fat pad was carefully dissected to ensure no white adipose or muscle remained attached to the sample, and placed in a sealed container on ice.
Both the Raman and Brillouin spectral data were simultaneously collected from the same location on the same day of tissue extraction. The AT samples were brought to room temperature prior to data acquisition.
2.3. Experimental setup
The schematic for the Raman/Brillouin spectrometer is shown in Figure 1(a). The detailed description of the spectrometer is discussed in Reference [25] Raman and Brillouin spectra were collected simultaneously using a 532 nm single-frequency laser as the source of incident radiation (Lasermate Group Inc.; model: GMSL-532-100FHA; nominal linewidth ~640 kHz, power output ~120 mW), delivering ~30 mW of power onto the sample. A half-wave-plate was placed before a polarizing beamsplitter to adjust the power of light incident onto the sample. The polarizing beamsplitter redirected the incident light towards the infinity-corrected 20x microscope objective lens (Nikon Inc., CFI Plan Fluor 20x, N.A. = 0.5), providing a beam spot diameter of ~1.3 μm on the sample.
Figure 1.

(a) Schematic diagram of instrumental setup for simultaneous Raman and Brillouin spectroscopy, (b) detailed diagram of the Brillouin spectrometer.
The microscope objective lens was used to focus the incident light onto the sample and to collect the backscattered signal. The finite NA objective lenses contribute to a spectral broadening of the Brillouin peaks, which is more pronounced when using high NA objectives (NA>0.5). A lower NA objective limits this spectral broadening at a sacrifice of the spatial resolution. The NA=0.5 objective lens used in the present study causes insignificant broadening due to the 180° signal collection angle. The backscattering geometry results in a less pronounced spectral broadening, compared to a 90° collection angle. [26] Additionally, due to backscattered collection geometry, measurements of Brillouin scattering contain mainly contribution from longitudinal wave, and not the shear (transverse) waves. [27]
A quarter-wave-plate was placed before the objective to rotate the polarization of the backscattered beam by 90° in order to direct it towards the Brillouin and Raman spectrometers. The backscattered beam was split by a long-pass filter; the longer wavelengths were passed through towards the home-built Raman spectrometer (fiber-coupled Shamrock 303i spectrometer with the attached iDUS 401 CCD, Andor, Inc.; spectral resolution of approximately 3.5 cm−1, or 0.1 nm), while the rest of the collected light was redirected towards the Brillouin spectrometer (Figure 1(b)).
The Brillouin spectrometer (Figure 1(b)) utilized a temperature-tunable iodine absorption cell (Opthos Instruments, Inc.) set to 112°C as an ultra-narrow notch filter that absorbed the undesired elastic scattered light. The shape of Brillouin spectra is often affected by the absorption of the iodine cell; [28] however, the absorption spectrum of molecular iodine is well characterized (see, for example, Reference [29]), and the spectral amendments can be taken into account for a very precise (±1 MHz, or ~3.3E-5 cm−1) Brillouin spectral shift identification. [30] A 532-nm line filter was placed after the cell to block the undesired fluorescence from the iodine. The filter was followed by the virtual image phase array (VIPA; model: OP-5642, Light Machinery Inc.) spectrometer design as described by Scarcelli and Yun. [31]
2.4. Data processing and analysis
Spectral data were analyzed using OriginPro 2016, Sr1 (OriginLab, Northampton, MA); the results were expressed as mean ± SEM (average n=15 in each subgroup).
To process the Raman measurements 5 replicate spectra (1 second acquisition time) from each spatial location were averaged after dark background subtraction. The spectra were smoothed using a moving average method (5 points window), baseline corrected, and vector normalized to facilitate comparison.
To process the Brillouin spectra, 5 replicate spectra (1 second acquisition time) from each spatial location were averaged, and the Lorentzian function fit was used to determine the central frequency of Brillouin peaks and residual elastic peaks. The spectral position on the CCD was converted to GHz using third order polynomial interpolation and the fact that the spacing between the elastic peaks is equal to the free spectral range (FSR) of the VIPA, 33.334 GHz. The value of the Brillouin shift was determined as difference between frequencies of the elastic and Anti-Stokes Brillouin peaks.
The measurements from control and HFD groups were compared using one-way analysis of variance (ANOVA) to determine if there are statistically significant differences between the groups. The data that showed great distribution, the control BAT and WAT, were also grouped into clusters based on their similarity using K-means clustering analysis (KCA). The KCA is a simple unsupervised learning algorithm that groups a dataset into a user-predefined number of clusters based on their spectral similarity. The KCA was repeated several times for an increasing number of user-specified clusters, until the spectra of two or more clusters could not be easily distinguished from each other.
3. Results and Discussion
The averaged Raman spectra brown and white adipose tissues in each group are shown in Figure 2(a); the plots are offset for clarity. The Raman spectra of AT of both groups are dominated by high-intensity bands in the 2500–3000 cm−1 region, associated with CH, CH2, and CH3 symmetric and asymmetric stretching in lipids and proteins. [32] Lipids are the main contributor to the lower energy level peak, while the higher energy peak represents the vibrations present in adipose’s protein. [20]
Figure 2.

(a) Mean Raman spectra and (b) protein-to-lipid ratio (ratio of peaks’ intensities at 2895 and 2830 cm−1) of control and high-fat-diet (HFD) groups’ brown (BAT) and white (WAT) adipose tissues.
While there are some minor changes in the spectra between control and HFD groups, the most pronounced of them occur in the abovementioned region. The two peaks in the region, located at 2895 and 2830 cm−1 (highlighted in gray), were used to estimate the protein-to-lipid ratio in the sampled area by calculating the ratio of the peaks’ intensities. The results are displayed in Figure 2(b) as mean ± SEM.
The BAT of the control group displayed, on average, a greater relative amount of protein than any other subgroup. The high protein content of BAT in the control group is expected due to its composition and function. [24] Overall, the Raman spectra of control BAT and WAT have displayed greater diversity of composition than the AT of the HFD group. Using KCA, the measurements of control BAT can be broadly divided into 3 groups (Figure 3(a)) based on their Raman spectra: 1) lipid-rich and 2) protein-rich areas, and 3) blood vessel (high water content, region highlighted in gray). The WAT of the control group can be divided into only 2 groups (Figure 3(b)): 1) lipid-rich, and 2) protein-rich with high water content (blood vessel).
Figure 3.

Mean Raman spectra calculated for different clusters obtained after KCA (K-means clustering analysis) on the control (a) brown (BAT) and (b) white (WAT) adipose tissue.
The results indicate that the consumption of a high-fat diet has a greater effect on the BAT than on the WAT. The changes in the protein-to-lipid ratio of both the BAT and WAT are statistically significant (p≤0.01) between the control and HFD groups.
Figure 4(a) displays Lorentzian function-fitted averaged Anti-Stokes Brillouin peaks of BAT and WAT in control and HFD groups. For clarity, the spectra are vertically offset and the individual data points are not displayed. The central frequencies of the Brillouin peaks were determined from the fit, and are summarized in Figure 4(b); the data are shown as mean ± SEM.
Figure 4.

(a) Mean fitted Brillouin peaks and (b) Brillouin shifts of control and high-fat-diet (HFD) groups’ brown (BAT) and white (WAT) adipose tissue.
A greater Brillouin shift value corresponds to stiffer tissue. Overall, the control BAT is the softest tissue out of the measured samples, while the WAT of the HFD group has the greatest Brillouin shift. The stiffness of AT increases between the control group and the HFD group; Brillouin shifts of control group’s BAT and WAT are statistically significantly different (p≤0.01) from those of the HFD group.
As discussed in the Introduction section, longitudinal high-frequency elastic modulus M′ can be calculated from the value of the Brillouin shift as (for backscattered collection geometry). Additionally, the speed of sound in the material can be determined as . In both abovementioned equations, ΔvB is the Brillouin shift, n is the material’s index of refraction, λ0 is the wavelength of the incident light, and ρ is the material’s mass density. While a literature search failed to yield values of density and refractive index of WAT and BAT specifically, we were able to estimate the elastic modulus and speed of sound using general values of adipose refractive index, n = 1.455, [33] and density, ρ = 0.916. [34] The values of Brillouin shift, longitudinal high-frequency elastic modulus, and speed of sound are summarized in Table 1. Traditionally, the Brillouin shift is expressed in GHz, but converted values in cm−1 units are added to the table for comparison purposes.
Table 1.
Measured values of Brillouin shift, and calculated elastic moduli and speed of sound of brown (BAT) and white (WAT) adipose tissue in control and diet-induced obese (HFD: high-fat diet) groups. All values are presented as mean ± SEM.
| Tissue | Brillouin shift [GHz] | Brillouin shift [cm−1] | Elastic modulus [GPa] | Speed of sound [m/s] |
|---|---|---|---|---|
| Control BAT | 8.249 ± 0.067 | 0.275 ± 0.002 | 2.083 ± 1.39E-4 | 1508 ± 12 |
| Control WAT | 8.463 ± 0.096 | 0.282 ± 0.003 | 2.193 ± 2.84E-04 | 1547 ± 18 |
| HFD BAT | 8.514 ± 0.047 | 0.284 ± 0.001 | 2.219 ± 6.91E-05 | 1556 ± 9 |
| HFD WAT | 8.822 ± 0.027 | 0.294 ± 0.001 | 2.383 ± 2.16E-05 | 1613 ± 5 |
The control group’s BAT and WAT have a greater variation of stiffness than the adipose of the HFD group. The simultaneously obtained Raman spectra also showed greater distribution in these two groups; however, separating the Brillouin shifts into the clusters based on their Raman spectra did not yield smaller distribution of Brillouin shifts. Instead, KCA of the control group’s Brillouin measurements resulted in three clusters that matched the animal the tissue was harvested from. Additionally, for each animal, the WAT displayed a greater Brillouin shift than the BAT (p≤0.05), indicating the white adipose is generally stiffer.
Studies show that obesity is accompanied with AT fibrosis, characterized by collagen fiber accumulation, which is correlated with increased AT stiffness in obese individuals (see, for example, Reference [18]). If the amount of collagen increased at the same rate as the accumulation of lipids due to adipocyte hypertrophy or hyperplasia, the Raman spectra would show little change in the protein-lipid ratio.
However, in our measurements we see a significant drop in the protein content relative to the amount of lipids, suggesting that the accumulation of lipids outpaces the increase in collagen. The observed increase in the stiffness of both BAT and WAT between control and HFD groups is then most likely the result of adipocyte enlargement and greater crosslinking of collagen fibers, both of which are present in obesity and correlated to an increase in stiffness. [6,8]
4. Conclusion
In the present study we, for the first time, have evaluated the effect of high-fat diet (HFD) on elasticity and chemical composition of brown (BAT) and white (WAT) adipose tissues using concurrent spectroscopic techniques. The novel simultaneous chemical and mechanical assessment of the adipose tissue (AT) was achieved using Raman and Brillouin spectroscopies. Overall, the stiffness of both BAT and WAT is significantly greater in HFD group compared to the control, as indicated by an increase in their Brillouin shift, and, therefore, their elastic moduli. Additionally, while the stiffness of AT of the control group varied slightly from animal to animal, the BAT generally possessed a lower Brillouin shift than the WAT. Elasticity measurements in studies of obesity’s effect on adipose [10,18] and lipid accumulation’s effect on adipocytes [6] indirectly support our findings. The Raman spectra were used to estimate the protein to lipid ratio in the sampled location, and the results indicate that the amount of lipids increases greatly in the HFD group, as the ratio decreases. The Raman spectra also indicate that control BAT possesses a greater structural and chemical diversity, while both AT of the HFD group are more homogeneous. The HFD-induced changes are more profound in the brown adipose.
We have shown, using Brillouin elastography, that elasticity of interscapular BAT and inguinal WAT is affected by a HFD, with the stiffness of the tissues increasing. However, expanding the study to include other fat depots would provide a better understanding on the obesity’s effect on different AT locations. Several studies have shown that different AT depots possess different elastic modulus, [7,10] and ECM composition and structure. [35,36] The degree of obesity-associated inflammation, [37] and the macrophage accumulation [38] are also location-dependent. Additionally, progression of obesity differs between male and female rodents, [39] so the HFD-induced elasticity changes are likely different between the two groups. We believe that our experimental approach validated in this study opens wide possibilities to obtain wide spectrum of this necessary scientific knowledge.
We note that while, at present, it takes about 1 second to collect the data from a single point, coherent optical spectroscopies based on coherent anti-Stokes Raman scattering and stimulated Raman scattering, [40,41] and coherent and impulsive Brillouin scattering [42,43] have a capability of tremendously speeding up the current data acquisition process, while providing microscopic spatial resolution in a depth of a tissue. [44] By maintaining the peak power of laser beams below the safety limits, [45,46] such as in the present study, in vivo measurements become feasible, providing an opportunity to implement our experimental approach in future clinical studies.
Acknowledgments
This research was partially supported by the National Science Foundation awards DBI-1455671 and DBI-1532188, the National Institutes of Health grant DK099161, the US Department of Defense award FA9550-15-1-0517 and the Cancer Prevention Research Institute of Texas grant RP160834.
Footnotes
Author Biographies Please see Supporting Information online
References
- 1.World Health Organization. Fact Sheet 311: Obesity and Overweight. 2015. [Google Scholar]
- 2.Kopelman PG. Obesity as a medical problem. Nature. 2000;404(6778):635–643. doi: 10.1038/35007508. [DOI] [PubMed] [Google Scholar]
- 3.Must A. The Disease Burden Associated With Overweight and Obesity. JAMA. 1999;282(16):1523. doi: 10.1001/jama.282.16.1523. [DOI] [PubMed] [Google Scholar]
- 4.Martinez-Santibañez G, Lumeng CN. Macrophages and the Regulation of Adipose Tissue Remodeling. Annu Rev Nutr. 2014:3457–76. doi: 10.1146/annurev-nutr-071812-161113. [DOI] [PubMed] [Google Scholar]
- 5.Mariman ECM, Wang P. Adipocyte extracellular matrix composition, dynamics and role in obesity. Cell Mol Life Sci. 2010:671277–1292. doi: 10.1007/s00018-010-0263-4. [DOI] [PMC free article] [PubMed] [Google Scholar]
- 6.Shoham N, Girshovitz P, Katzengold R, Shaked NT, Benayahu D, Gefen A. Adipocyte stiffness increases with accumulation of lipid droplets. Biophys J. 2014;106(6):1421–1431. doi: 10.1016/j.bpj.2014.01.045. [DOI] [PMC free article] [PubMed] [Google Scholar]
- 7.Alkhouli N, Mansfield J, Green E, Bell J, Knight B, Liversedge N, Tham JC, Welbourn R, Shore AC, Kos K, Winlove CP. The mechanical properties of human adipose tissues and their relationships to the structure and composition of the extracellular matrix. Am J Physiol - Endocrinol Metab. 2013:3051427–1435. doi: 10.1152/ajpendo.00111.2013. [DOI] [PubMed] [Google Scholar]
- 8.Pellegrinelli V, Heuvingh J, du Roure O, Rouault C, Devulder A, Klein C, Lacasa M, Clément E, Lacasa D, Clément K. Human adipocyte function is impacted by mechanical cues. J Pathol. 2014:233183–195. doi: 10.1002/path.4347. [DOI] [PubMed] [Google Scholar]
- 9.Shoham N, Gefen A. Mechanotransduction in adipocytes. J Biomech. 2012;45(1):1–8. doi: 10.1016/j.jbiomech.2011.10.023. [DOI] [PubMed] [Google Scholar]
- 10.Shoham N, Gefen A. The biomechanics of fat: From tissue to a cell scale. Structure-Based Mechanics of Tissues and Organs. 2016 [Google Scholar]
- 11.Boyd R. Nonlinear Optics. 2003 [Google Scholar]
- 12.Meng Z, Traverso AJ, Ballmann CW, Troyanova-Wood M, Yakovlev VV. Seeing cells in a new light: a renaissance of Brillouin spectroscopy. Adv Opt Photonics. 2016;8(2):300–327. [Google Scholar]
- 13.Scarcelli G, Pineda R, Yun S. Brillouin optical microscopy for corneal biomechanics. Invest Ophthalmol Vis Sci. 2012;53(1):185–190. doi: 10.1167/iovs.11-8281. [DOI] [PMC free article] [PubMed] [Google Scholar]
- 14.Reiß S, Burau G, Stachs O. Spatially resolved Brillouin spectroscopy to determine the rheological properties of the eye lens. Biomed Opt Express. 2011;2(8):2144–2159. doi: 10.1364/BOE.2.002144. [DOI] [PMC free article] [PubMed] [Google Scholar]
- 15.Troyanova-Wood M, Meng Z, Yakovlev VV. Elasticity-based identification of tumor margins using Brillouin spectroscopy. Prog Biomed Opt Imaging - Proc SPIE. 2016;9719 [Google Scholar]
- 16.Scarcelli G, Polacheck WJ, Nia HT, Patel K, Grodzinsky AJ, Kamm RD, Yun SH. Noncontact three-dimensional mapping of intracellular hydromechanical properties by Brillouin microscopy. Nat Methods. 2015 Oct;:1–5. doi: 10.1038/nmeth.3616. [DOI] [PMC free article] [PubMed] [Google Scholar]
- 17.Meng Z, Bustamante Lopez SC, Meissner KE, Yakovlev VV. Subcellular measurements of mechanical and chemical properties using dual Raman-Brillouin microspectroscopy. J Biophotonics. 2015;9(3):201–207. doi: 10.1002/jbio.201500163. [DOI] [PubMed] [Google Scholar]
- 18.Abdennour M, Reggio S, Le Naour G, Liu Y, Poitou C, Aron-wisnewsky J, Charlotte F, Bouillot J, Torcivia A, Sasso M, Miette V, Zucker J, Bedossa P, Tordjman J, Clement K. Association of Adipose Tissue and Liver Fibrosis With Tissue Stiffness in Morbid Obesity: Links With Diabetes and BMI Loss After Gastric Bypass. J Clin Endocrinol Metab. 2014:99898–907. doi: 10.1210/jc.2013-3253. [DOI] [PubMed] [Google Scholar]
- 19.Giarola M, Rossi B, Mosconi E, Fontanella M, Marzola P, Scambi I, Sbarbati A, Mariotto G. Fast and minimally invasive determination of the unsaturation index of white fat depots by micro-Raman spectroscopy. Lipids. 2011;46(7):659–67. doi: 10.1007/s11745-011-3567-8. [DOI] [PubMed] [Google Scholar]
- 20.Giarola M, Guella G, Mariotto G, Monti F, Rossi B, Sanson a, Sbarbati a. Vibrational and structural investigations on adipose tissues. Philos Mag. 2008;88:33–35. 3953–3959. [Google Scholar]
- 21.Alahbabi MN, Cho YT, Newson TP. Simultaneous temperature and strain measurement with combined spontaneous Raman and Brillouin scattering. Opt Lett. 2005;30:11. doi: 10.1364/ol.30.001276. [DOI] [PubMed] [Google Scholar]
- 22.Bolognini G, Soto MA, Pasquale FD. Simultaneous distributed strain and temperature sensing based on combined Raman-Brillouin scattering using Fabry-Perot lasers. Meas Sci Technol. 2010;21:9. [Google Scholar]
- 23.Traverso AJ, Thompson JV, Steelman ZA, Meng Z, Scully MO, Yakovlev VV. Dual Raman-Brillouin Microscope for Chemical and Mechanical Characterization and Imaging. Anal Chem. 2015;87(15):7519–7523. doi: 10.1021/acs.analchem.5b02104. [DOI] [PubMed] [Google Scholar]
- 24.Saely CH, Geiger K, Drexel H. Brown versus white adipose tissue: A mini-review. Gerontology. 2011;58(1):15–23. doi: 10.1159/000321319. [DOI] [PubMed] [Google Scholar]
- 25.Meng Z, Yakovlev VV. Optimizing signal collection efficiency of the VIPA-based Brillouin spectrometer. J Innov Opt Health Sci. 2015;8(4):1550021. [Google Scholar]
- 26.Antonacci G, Foreman MR, Paterson C, Török P. Spectral broadening in Brillouin imaging. Appl Phys Lett. 2013;103(22):221105. [Google Scholar]
- 27.Vacher R, Boyer L. Brillouin scattering: a tool for the measurement of elastic and photoelastic constants. Phys Rev B. 1972;6(2):639–673. [Google Scholar]
- 28.Meng Z, Traverso AJ, Yakovlev VV. Background clean-up in Brillouin microspectroscopy of scattering medium. Opt Express. 2014;22(5):144–148. doi: 10.1364/OE.22.005410. [DOI] [PMC free article] [PubMed] [Google Scholar]
- 29.Simmons JD, Hougen JT. Atlas of the I2 Spectrum from 19 000 to 18 000 cm−1. J Res Natl Bur Stand Sect A Phys Chem. 1977;81A(1):25–80. [Google Scholar]
- 30.Meng Z, Yakovlev VV. Precise Determination of Brillouin Scattering Spectrum Using a Virtually Imaged Phase Array (VIPA) Spectrometer and Charge-Coupled Device (CCD) Camera. Appl Spectrosc. 2016;70(8):1356–1363. doi: 10.1177/0003702816654050. [DOI] [PubMed] [Google Scholar]
- 31.Scarcelli G, Yun S. Confocal Brillouin microscopy for three-dimensional mechanical imaging. Nat Photonics. 2008;2(1):39–43. doi: 10.1038/nphoton.2007.250. [DOI] [PMC free article] [PubMed] [Google Scholar]
- 32.Talari ACS, Movasaghi Z, Rehman S, Rehman IU. Raman Spectroscopy of Biological Tissues. Appl Spectrosc Rev. 2015;50(1):46–111. [Google Scholar]
- 33.Bolin FP, Preuss LE, Taylor RC, Ference RJ. Refractive index of some mammalian tissues using a fiber cladding method. 1989;12(2297–2303) doi: 10.1364/AO.28.002297. [DOI] [PubMed] [Google Scholar]
- 34.Duck F. Physical Properties of Tissue: A Comprehensive Reference Book. San Diego: Academic Press; 1990. [Google Scholar]
- 35.Divoux A, Tordjman J, Lacasa D, Veyrie N, Hugol D, Aissat A, Basdevant A, Guerre-Millo M, Poitou C, Zucker J-D, Bedossa P, Clément K. Fibrosis in Human Adipose Tissue: Composition, Distribution, and Link With Lipid Metabolism and Fat. Diabetes. 2010:592817–2825. doi: 10.2337/db10-0585. [DOI] [PMC free article] [PubMed] [Google Scholar]
- 36.Khan T, Muise ES, Iyengar P, Wang ZV, Chandalia M, Abate N, Zhang BB, Bonaldo P, Chua S, Scherer PE. Metabolic Dysregulation and Adipose Tissue Fibrosis: Role of Collagen VI. Mol Cell Biol. 2009;29(6):1575–1591. doi: 10.1128/MCB.01300-08. [DOI] [PMC free article] [PubMed] [Google Scholar]
- 37.Strissel KJ, Stancheva Z, Miyoshi H, Perfield JW, DeFuria J, Jick Z, Greenberg AS, Obin MS. Adipocyte Death, Adipose Tissue Remodeling, and Obesity Complications. Diabetes. 2007:562910–2918. doi: 10.2337/db07-0767. [DOI] [PubMed] [Google Scholar]
- 38.Weisberg SP, McCann D, Desai M, Rosenbaum M, Leibel RL, Ferrante J, AW Obesity is associated with macrophage accumulation in adipose tissue. J Clin Invest. 2003;112(12):1796–1808. doi: 10.1172/JCI19246. [DOI] [PMC free article] [PubMed] [Google Scholar]
- 39.Medrikova D, Jilkova ZM, Bardova K, Janovska P, Rossmeisl M, Kopecky J. Sex differences during the course of diet-induced obesity in mice: adipose tissue expandability and glycemic control. Int J Obes. 2012;36(2):262–272. doi: 10.1038/ijo.2011.87. [DOI] [PubMed] [Google Scholar]
- 40.Petrov GI, Meng Z, Yakovlev VV. Electronically tunable coherent Raman spectroscopy using acousto-optics tunable filter. Opt Express. 2015;23(19):24669. doi: 10.1364/OE.23.024669. [DOI] [PubMed] [Google Scholar]
- 41.Meng Z, Petrov GI, Yakovlev VV. Pure electrical, highly-efficient and sidelobe free coherent Raman spectroscopy using acousto-optics tunable filter (AOTF) Sci Rep. 2016:620017. doi: 10.1038/srep20017. [DOI] [PMC free article] [PubMed] [Google Scholar]
- 42.Ballmann CW, Thompson JV, Traverso AJ, Meng Z, Scully MO, Yakovlev VV. Stimulated Brillouin Scattering Microscopic Imaging. Sci Rep. 2015;5 doi: 10.1038/srep18139. [DOI] [PMC free article] [PubMed] [Google Scholar]
- 43.Meng Z, Petrov GI, Yakovlev VV. Flow cytometry using Brillouin imaging and sensing via time-resolved optical (BISTRO) measurements. Analyst. 2015;140(21):7160–7164. doi: 10.1039/c5an01700a. [DOI] [PMC free article] [PubMed] [Google Scholar]
- 44.Arora R, Petrov GI, Yakovlev VV, Scully MO. Chemical analysis of molecular species through turbid medium. Anal Chem. 2013 doi: 10.1021/ac4023633. [DOI] [PubMed] [Google Scholar]
- 45.Yakovlev VV. Advanced instrumentation for non-linear Raman microscopy. J Raman Spectrosc. 2003;34(12):957–964. [Google Scholar]
- 46.Bixler JN, Hokr BH, Denton ML, Noojin GD, Aurora D, Beier HT, Thomas RJ, Rockwell BA, Yakovlev VV. Assessment of tissue heating under tunable near IR radiation. J Biomed Opt. 2015;19(7) doi: 10.1117/1.JBO.19.7.070501. [DOI] [PubMed] [Google Scholar]