Philosophers have puzzled for millennia about how humans build abstract conceptual objects (house/face/tool) from the simple features of the world they see around them (line/patch/lighting). Understanding the biological foundation of this process requires detailed knowledge of the spatial-temporal characteristics of cerebral cortex. By examining the physiology of the human temporal lobe from implanted electrodes while showing subjects noise-degraded images, we find that face percept formation happens in specific subregions within known face-processing areas.
Keywords: face processing, perception, prosopagnosia, temporal lobe, electrocorticography, human brain
Abstract
Loci in ventral temporal cortex are selectively active during viewing of faces and other objects, but it remains unclear whether these areas represent accumulation of simple visual information or processing of intact percept. We measured broadband electrocorticographic changes from implanted electrodes on the ventral temporal brain surface while showing patients noise-degraded images of faces and houses. In a subset of posterior fusiform gyrus face-selective regions, cortical activity decreased parametrically with noise increase, until the perceptual threshold was surpassed. At noise levels higher than the perceptual threshold, and for house stimuli, activity remained at baseline. We propose that this convergence of proportional and thresholded response may identify active areas where face percepts are extracted from simple visual features. These loci exist within a topological structure of face percept formation in the human ventral visual stream, preceded by category-nonselective activity in pericalcarine early visual areas and in concert with all-or-nothing activity in postperceptual subregions of the ventral temporal lobe. This topological organization suggests a physiological basis for the anatomy of face perception, explaining different perceptual deficits following temporal lobe injury.
NEW & NOTEWORTHY Philosophers have puzzled for millennia about how humans build abstract conceptual objects (house/face/tool) from the simple features of the world they see around them (line/patch/lighting). Understanding the biological foundation of this process requires detailed knowledge of the spatial-temporal characteristics of cerebral cortex. By examining the physiology of the human temporal lobe via implanted electrodes while showing subjects noise-degraded images, we find that face percept formation happens in specific subregions within known face-processing areas.
visual percept formation is the process whereby humans assign abstract concepts to the world around them from finite visual information (Wandell 1995). Philosophers have explored this process for millennia (Plato 1999), and modern tools can define the biological substrates of percept formation. Ventral temporal cortex has been specifically related to the visual perception of faces and places since Wilder Penfield elicited hallucinations of faces, room interiors, and topographical scenes by stimulating the fusiform and parahippocampal gyri (Penfield and Perot 1963). Selective cortical activity in the fusiform gyrus during viewing of faces and in the parahippocampal/lingual gyri during viewing of places is robust; these associations have been confirmed by lesion studies, functional MRI, positron emission tomography, single-neuron physiology, and electrocorticography (ECoG; Fig. 1, A and B) (Allison et al. 1999; Heekeren et al. 2004; Ishai et al. 2000; Joseph 2001; Kanwisher et al. 1997; Meadows 1974; Miller et al. 2015; Tsao et al. 2006). How the fusiform gyrus relates to contextual experience has been studied extensively, correlating variation in brain activity to faces, differentiable by familiarity, race, gender, emotion, expression, species, or relation to personal expertise (Contreras et al. 2013; Halgren et al. 2000; Kawasaki et al. 2012; McGugin et al. 2012), as well as the basic features necessary to trigger facial recognition and associated brain activity (Liu et al. 2010). These studies have employed a wide variety of subtle stimulus variations and form the basis of many general hypotheses about how the human brain represents the external world (Rajimehr et al. 2014; Sabatinelli et al. 2014).
Fig. 1.
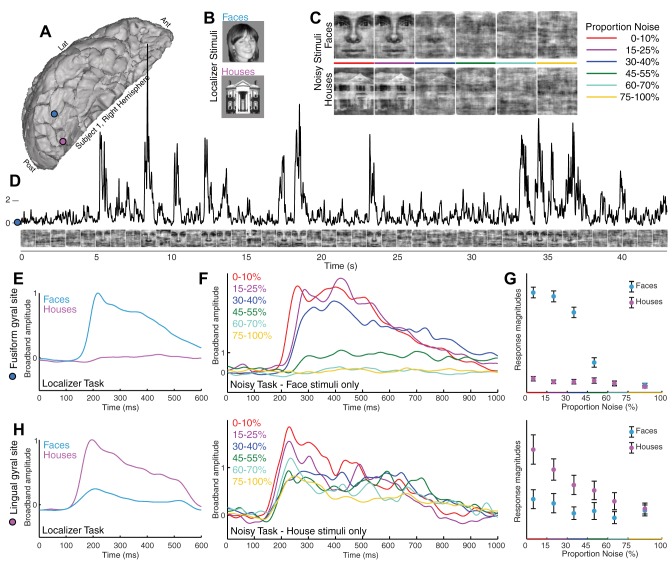
Category-selective ventral temporal physiology is graded with stimulus noise. A: ventral temporal ECoG was recorded from fusiform (blue) and lingual (pink) gyral electrodes (subject 1). Ant, anterior; Lat, lateral; Post, posterior. B: localizer task. Simple pictures of whole-field faces and houses were displayed in random order for 400 ms each, with 400-ms blank screen in between. C: noisy task. Phase-scrambled close-up pictures of faces and houses were shown for 1 s each. Stimuli ranged from 0 to 100% noise in 5% increments; subjects pressed a key when they believed a face was shown. D: broadband spectral change in the electrical potential, a reflection of averaged neuronal population activity, is shown above the corresponding stimuli from the noisy task (fusiform site in A). E: averaged broadband response templates to face and house stimuli (from A) are generated from the localizer task. F: averaged broadband responses to face stimuli from the noisy task illustrate diminished and delayed response as image noise increases. G: the face template, generated from the localizer task, is projected to single trials from the noisy task, revealing a robust neurometric function (mean ± SE). At low levels of noise, above the perceptual threshold, there is a parametric decrease in response to faces with increasing noise, with decreasing neuronal activity as image noise is increased. At high noise, above the perceptual threshold, the response drops from a high level to zero response (where all house responses are). H: same as E–G but for the lingual gyral (pink) site in A, with the use of a house template to quantify single-trial responses (far right).
These contextual aspects of face perception are an important aspect of fusiform cortex function. However, clinical observation has established that there are different forms of face perceptual deficit (prosopagnosia) following injury to the ventral temporal lobe, suggesting subspecialization within face-selective regions (Davies-Thompson et al. 2014). In some cases, individuals are unable to internally generate a formed facial structure from visual data (apperceptive prosopagnosia); other individuals can easily form the representation of a face, but they cannot distinguish between faces or cannot contextualize the faces they see with those they have seen in the past (associative prosopagnosia). This suggests that multiple adjacent face-processing anatomic loci may exist alongside one another but play different computational roles in perception. One might question whether the percept of a face is formed from the accumulation of visual evidence within a cortically distributed contextual framework (Heekeren et al. 2008), or, as the existence of apperceptive prosopagnosia might suggest, there is a distinct locus of face percept formation among multiple face regions.
Two physiological observations are required to localize where in the brain percept formation happens (Dretske 1981; Kinchla and Wolfe 1979; Mechelli et al. 2004). First, to represent sensory evidence, neural activity should proportionally reflect the basic physical qualities of each visual stimulus, showing that bottom-up visual evidence is being processed. Second, to represent categorical assignment, neural activity should be category selective for each visual stimulus, with a drop-off at the perceptual threshold, revealing top-down categorical assignment. We measured electrical potentials from throughout the human ventral temporal brain surface to examine physiological evidence for brain loci where simple visual information and perceptual assignment converge.
MATERIALS AND METHODS
Ethics statement.
All patients participated in a purely voluntary manner, after providing informed written consent, under experimental protocols approved by the Institutional Review Board (IRB) of the University of Washington (no. 12193). All patient data were anonymized according to IRB protocol, in accordance with HIPAA mandate. All data, cortical renderings, and analysis code are publicly available, for use without restriction (see endnote).
Subjects.
All seven human subjects (4 men, 3 women) in the study were epileptic patients at Harborview Hospital in Seattle, WA. Subdural grids and strips of platinum electrodes were clinically placed over frontal, parietal, temporal, and occipital cortex for extended clinical monitoring and localization of seizure foci. To be included in the study, a patient must have had at least one inferior temporal face-selective site identified on the localizer task and must have fully completed the task. Tasks were performed at the hospital bedside, with 10-cm-wide pictures displayed on a bedside monitor at ~1 m from the patients, who indicated task choice using a separate keyboard.
Localizer task.
Subjects performed a basic face and house observation task. Subjects were presented with simple, grayscale pictures of whole-field faces and houses that were displayed in random order for 400 ms each, with a 400-ms interstimulus interval (ISI; blank screen) between them (Fig. 1B). There were 3 experimental runs with each patient, with 50 house pictures and 50 face pictures in each run. To maintain fixation on the stimuli, patients were asked to report a simple target (an upside-down house), which appeared once during each run. There were no errors in reporting the target house in each run. A portion of these “localizer task” data appears in previous publications (Miller et al. 2015, 2016).
Noisy task.
Subjects also performed a face-detection task using phase-scrambled close-up pictures of faces and houses. These stimuli were generously shared by the Ungerleider laboratory at the National Institutes of Health and were originally used for their study described previously (Heekeren et al. 2004). From the face database from Max Planck Institute for Biological Cybernetics (Tübingen, Germany), a set of 38 images of faces and houses were chosen. Fast-Fourier transforms (FFT) of these images were computed, producing 38 magnitude and 38 phase matrices. For each stimulus and each noise level, a new phase matrix was constructed by combining the original phase matrix with a random noise matrix (ranging from 0 to 100% noise, in 5% increments). These new phase matrices were combined with the average of the original magnitude matrix, and an inverse FFT was performed to produce stimuli that had identical frequency power spectra, but with graded amounts of noise. Stimuli were randomly interleaved, and each picture was shown for 1 s, with no ISI. Five blocks of 105 stimuli each were shown (each balanced for total number of faces and houses, and the total balanced for amount of noise). Because the clinical environment is prone to frequent interruption, any interrupted block was stopped and restarted from the beginning. Subjects were instructed that half of the stimuli were faces and half were houses, and they were instructed to press button “F” if they believed the picture to be that of a face. [Note: The task was initially designed as 2-alternative forced-choice (2AFC). However, the first two patients who performed the task were unable to properly perform the task (becoming intermittently confused about which key to press, and when). Because of this, we switched to this simple face-detection task format to save time and make it easier for the patients in the clinical setting.] A total of 630 stimuli were shown to each patient, 15 of each type at each 5% noise increment. There was neither incentive nor encouragement to respond faster (primarily due to the constraints of the clinical environment). Many subjects would make a choice as the stimuli switched, so keypresses within the first 200 ms of any given stimulus were assigned to the previous stimulus. Because of a technical issue and the initial difficulty with 2AFC, keypress data were not recorded in three cases (subjects 1, 2, and 7), although they were verified to be performing the task carefully, in each case, by the examiner.
Recordings.
Experiments were performed at the bedside, using Synamps2 amplifiers (Neuroscan, El Paso, TX) in parallel with clinical recording. Stimuli were presented with a monitor at the bedside using the general purpose BCI2000 stimulus and acquisition program (interacting with proprietary Neuroscan software), which also recorded the behavioral parameters and cortical data. Subdural platinum electrode arrays (Ad-Tech, Racine, WI) were arranged as combinations of 8 × [4,6,8] rectangular frontotemporoparietal arrays and 1 × [4,6,8] linear temporal and occipital strips. The electrodes had a 4-mm diameter (2.3 mm exposed), 1-cm interelectrode distance, and were embedded in Silastic. The potentials were sampled at 1,000 Hz, with respect to a scalp reference and ground, and had an instrument-imposed bandpass filter from 0.15 to 200 Hz.
Electrode localization.
Electrode location relative to gyral surface anatomy was determined by projection of the postimplant computed tomography (CT) to the preoperative axial T1 MRI. The CT was then interpolated and resliced into the axial T1 MRI. Electrodes were then identified in this mutual space on each axial slice so that their positions were known with respect to gyral anatomy from MRI. The ventral temporal sites were those where the electrode was localized to one of the following gyri: temporal pole, parahippocampal portion of the medial occipitotemporal gyrus, inferior temporal gyrus, middle temporal gyrus, fusiform gyrus (lateral occipitotemporal gyrus), lingual portion of the medial occipitotemporal gyrus, and inferior occipital gyrus. In some cases, cortical surface mesh reconstructions were made for display using preoperative structural MRI. Electrode positions were calculated with respect to the structural MRI from postoperative CT using the CTMR package and FreeSurfer-rendered cortical reconstructions (Dale et al. 1999; Hermes et al. 2010).
Signal processing.
Lateral frontoparietal electrode grids were discarded from analysis, and only inferotemporal strip electrodes were further considered. Electrodes with significant artifact or epileptiform activity were rejected. The electrical potential was then re-referenced with respect to the common average. Notch filtering between 58 and 62, 118–120, and 178–182 Hz using 3rd-order Butterworth filters rejected ambient line noise. In a recent article concerning the localizer task from this study, we showed that broadband ECoG activity and the event-average voltage response (ERP) capture different and complementary aspects of cortical physiology (Miller et al. 2016). However, ERPs may have wide structural variation, with “peaks” and “troughs” that are very different in shape, latency, and duration, even when they are specific for the same stimulus type and are measured from brain sites separated by only 1 cm. It remains unclear what the ERP shape actually corresponds to physiologically. Broadband spectral changes, in contrast, have been shown to be a reflection of local neuronal firing rate and a generic correlate of local cortical function across a variety of brain areas and behavioral tasks (Manning et al. 2009; Miller et al. 2009a, 2009b, 2014). Therefore, we have chosen to focus on broadband spectral changes in this study so that our results may be directly interpreted as a reflection of average firing rate beneath each electrode. For readers who wish to study ERP measurements from these data, parallel analyses were performed (producing homologous figures) and are available, along with all of the data and other analyses (see endnote).
Decoupling the cortical spectrum to isolate broadband spectral change.
The decoupling process to extract the time course of broadband spectral change has been described in full detail and illustrated previously (Miller et al. 2009b, 2014). From each electrode, discrete samples of power spectral density (PSD) were calculated from 1-s epochs centered at each stimulus or ISI period. Individual PSDs were normalized with element-wise division by the average power at each frequency, and then the log was taken. An inner product matrix of these normalized PSDs was diagonalized with a singular value decomposition and was then applied to identify motifs of vision-related change in the PSD. The eigenvectors (“PSCs”) from this decomposition reveal motifs in change in the PSD during cortical processing. Continuous time-frequency power approximations (dynamic spectra) were calculated using complex Morlet wavelets. These dynamic spectra were then normalized in the same way as the discrete spectra and projected onto the first PSC. This raw time series was smoothed with an 80-ms Gaussian envelope (SD 80 ms), z-scored, and exponentiated, and then 1 was subtracted (setting the mean at 0) to obtain the “broadband time course,” which has been shown to reflect a power law in the cortical PSD (Miller et al. 2009a). This was performed independently for the localizer and noisy tasks, with the z score mean and variance only obtained from the rest period in the localizer. Note that units for broadband amplitudes are omitted from many plots to minimize clutter in the figures, because the baseline of the normalized units is apparent on the traces before time 0, and the scaling of the axes is not informative beyond what can be seen visually in the variation of the data traces.
Template projection technique.
The projection templates used were from stimulus-triggered averaged broadband template (localizer task only; Fig. 2). In each electrode, n, stimulus-triggered average templates of the cortical response to stimuli were obtained from the broadband time series (event-related broadband, or ERBB: 〈Bn(t′)S〉). These were calculated for face (S→F, face) and house (S→H, house) stimuli independently ( denotes the kth of NS total instances of stimulus type S→F):
This is only calculated on the peristimulus interval 0 < t′ ≤ 600 ms (where t′ denotes time with respect to stimulus start). Each 〈Bn(t′)S〉 was divided by the maximum of 〈Bn(t′)F∪H〉.
Fig. 2.
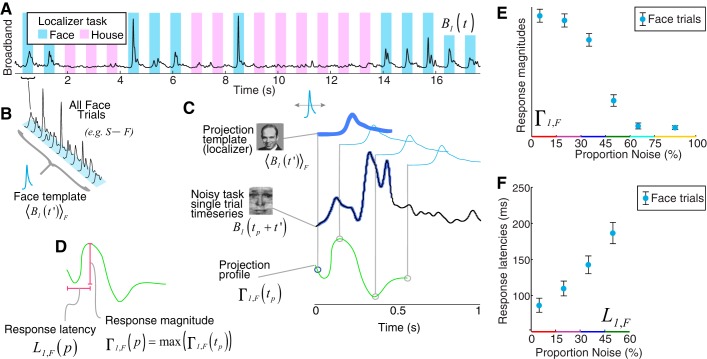
Template projection to generate single-trial response magnitudes and latencies. A: broadband from a fusiform electrode in the localizer task. B: template face response generated by averaging across all face trials in the localizer task. C: templates were projected into the noisy task single trial, by using a sliding dot product/covariance function over a 300-ms interval of each noisy task single trial to obtain a projection profile (green trace). D: the “response magnitude” is the maximum of this projection profile, and the latency associated with this maximum is the “response latency.” E and F: single-trial response magnitudes and latencies plotted as a function of noise. Latencies are only plotted up to the 45%–60% noise level, because the template projection is not stable for response traces of ~0 magnitude. (Note the variables indicated are defined and described in methods, Template projection technique.)
We perform the same averaging for the broadband signal to obtain 〈Bn(t′)S〉. Note that templates were obtained only from the localizer task.
Back-projection of templates into localizer task.
〈Bn(t′)S〉 was back-projected into the localizer task data to obtain a set of localizer feature points, Γn,S(q) for stimulus presentations at time τq:
where represents an “instantaneous” baseline:
The event types were face picture stimulus onset or house picture stimulus onset.
Projection of templates into noisy task.
To quantify the single-trial response in the noisy task, the projection templates (generated from the localizer task) were applied to each stimulus presentation (Figs. 1E, 2–5), scanning through a 0- to 300-ms delay with respect to each stimulus onset:
where tp ranges over the 0- to 300-ms interval and is the instantaneous baseline obtained for each time point. For each such trial, the “projection magnitude” is Γn,S(p) = max[Γn,S(tp)], and the time of this maximum value, the “projection latency,” is denoted Ln,S(p). These magnitudes, Γn,S(p), for n→ most face- and house-selective electrodes for S→F and S→H are illustrated in each neurometric function and associated with latency profiles, Ln,S(p). Note that units for projection magnitudes are omitted from plots, because they are arbitrary, and the error bars contained within best define the data scale.
Fig. 5.
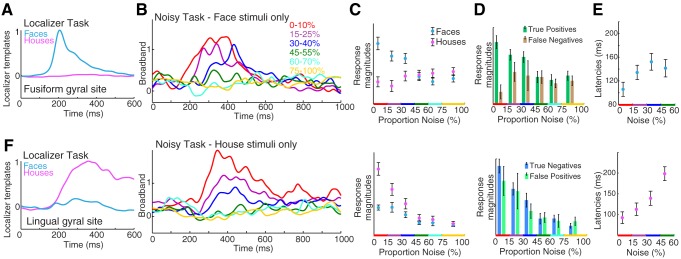
Cortical responses from ventral temporal cortex. Data in A–E are from a face-selective left fusiform gyral site, and data in F are from a house-selective right lingual gyral site in subject 4. A: averaged broadband response templates to face and house stimuli generated from the localizer task. B: averaged broadband responses to face stimuli from the noisy task. C: the face template, generated from the localizer task, projected to single trials from the noisy task (mean ± SE), to obtain response magnitudes. D: response magnitudes for face stimulus trials, sorted by keypress (true positives) or lack thereof (false negatives). E: response latencies to faces in the fusiform site. F: same as A–E, for a house-selective lingual gyral site.
Classification of noisy task trials.
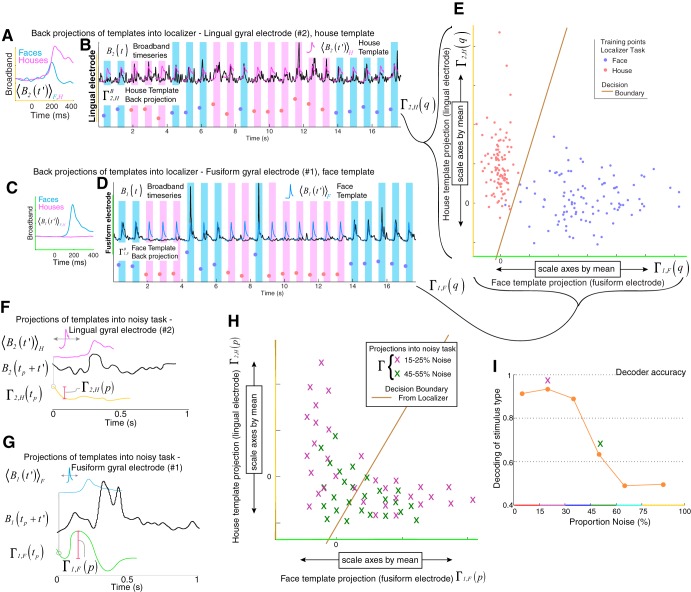
A simple classifier was generated and trained on the localizer task only and then applied to the noisy task to predict whether a given stimulus was a face or a house picture (Fig. 6).
Fig. 6.
Decoder is built on localizer task and applied to noisy task. A: house-image selective template (pink) from a lingual gyral electrode is generated as illustrated in Fig. 2. B: the template from A is back-projected into the broadband time series from that electrode at the time of each image presentation (note: there is no projection profile, because the projection is aligned to the time of stimulus onset, as described in text), where trials can be of type face or house. C and D: same as A and B, but for a face template in a fusiform site. E: example of a 2-dimensional feature space built from backprojections into the localizer task. After each feature is scaled by its mean, a decoder (Fisher linear discriminant-based classifier) is built within this feature space to distinguish face image presentations from house image presentations. F and G: as illustrated in Fig. 2, localizer templates are projected into single trials of the noisy task to obtain response magnitudes. H: after each response magnitude feature is scaled by its mean, the decoder built on backprojections of the localizer task (E) was applied to predict whether a face or house image had been seen. I: the output of the decoder can be compared with stimulus type and subject choice at different levels of image noise. (Note the variables indicated are defined and described in methods, Classification of noisy task trials.)
Generation of a feature space.
The full feature space for classification, consisting of the projections of the stimulus-triggered broadband across all electrodes (n), for face and house templates independently, is the combination of Γn,F and Γn,H. For brevity, we can combine the notation to denote each feature as Γm, where m represents a unique combination of one electrode, n, and F or H. Each feature was scaled with division by its mean, , for the localizer and noisy tasks independently. Many of these features will not be particularly informative about when and how the brain is processing these visual stimuli. Therefore, features were downselected by independently assessing the squared cross-correlation between face and house from the localizer task, and rejecting those which fell beneath the predefined threshold .
The squared cross-correlation to compare face and house stimuli is
where σm is the standard deviation of the joint distribution for face and house stimuli Γm(q = F & H), NF is the number of face presentation events, NH is the number of house events, and NFH = NF + NH.
Classification.
For the sake of simplicity, Fisher linear discriminant analysis (LDA) was used for classification (Fig. 7). From the localizer task, this characterizes the full distribution and the subdistributions Γm(q→F) and Γm(q→H) by their means and covariances only (i.e., as if they are normally distributed). LDA assumes that the covariances of the subdistributions are the same. Given the feature space of the training distribution (localizer task), single trials (p) from the noisy task can be assigned a posterior probability of belonging to the face or house distribution: Pr{Γm(p)|q→F} or Pr{Γm(p)|q→H}. The higher posterior probability is the one that is chosen. We sorted the accuracy of these class assignments by proportion of noise in the stimulus to obtain a gross comparison with physiological thresholding (Figs. 8 and 9).
Fig. 7.
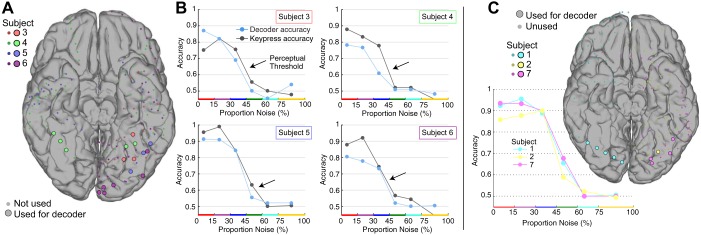
Decoder performance mirrors subject choice, revealing that the physiological threshold explains the perceptual threshold. A simple decoder was built from localizer task responses and then used to decode single trials from the noisy task. A: the electrodes used by the decoder are plotted on a standardized brain. Inclusion criteria: r2 > 0.1, face or house localizer pictures vs. blank screen. B: decoder and subject keypress accuracy in 4 subjects, as a function of noise. Despite being based on a sparse sampling of the cortex and trained on a different task (localizer), the decoder performs nearly at the behavioral level of each subject. The physiological threshold clearly mirrors the perceptual threshold (indicated by arrow), and the perceptual and neurometric curves are strongly correlated with one another (P < 0.05 in all cases). C: behavioral data were not available for 3 subjects (subjects 1, 2, and 7), but decoding was robust and mirrored the other 4 subjects shown in A and B.
Fig. 8.
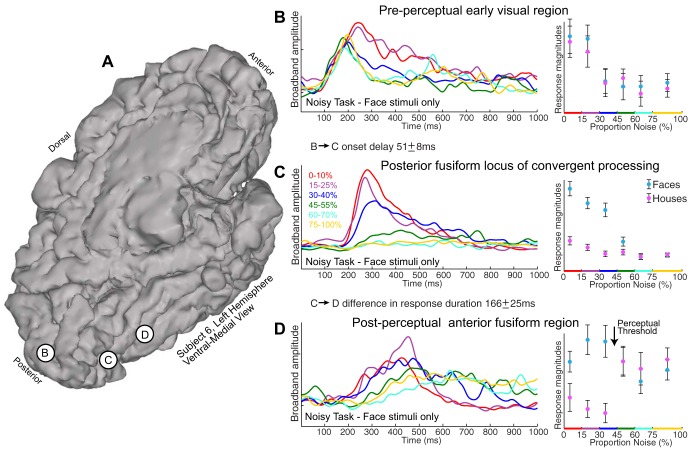
Dynamics of face percept formation in the human ventral stream. A: 3 recording sites in subject 6: primary visual (site B), posterior fusiform (site C), and mid-fusiform (site D). B: averaged broadband responses to all face stimuli (noisy task) are shown from site B in A (left); single-trial projection magnitudes of the face template into all noisy task data reveal no difference between face and house responses (right). C: same as B, but for site C in A, illustrating convergent processing: there is face-selective neural activity that parametrically decreases with increasing noise and then abruptly drops to chance at the perceptual threshold. D: same as B, but for site D in A. There is no parametric relationship to noise, but there is clear face-selective activity up to the perceptual threshold. Note that there is an onset delay between sites B and C of 51 ± 8 ms (significant vs. 0, P < 10−4) and that the duration of response was longer in site D than in site C by 166 ± 25 ms (significant vs. 0, P < 10−4).
Fig. 9.
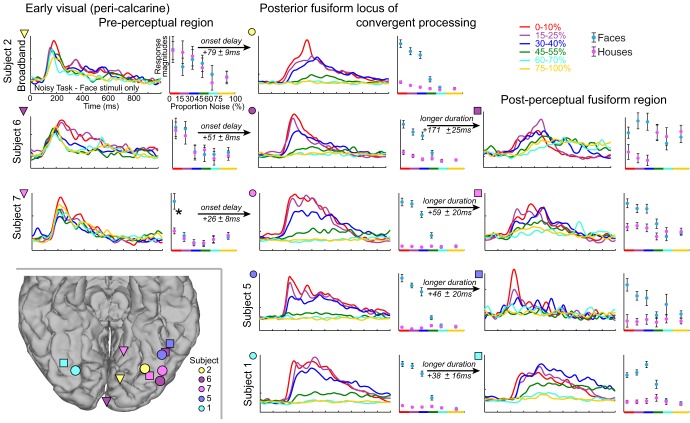
Percept formation (conventions are the same as in Fig. 8). Columns show responses from early visual preperceptual locations (left column; inverted triangles in inset), posterior fusiform gyrus loci of confluent processing (middle column; circles in inset), and postperceptual fusiform regions (right column; squares in inset). Each row corresponds to a different subject. Corresponding locations are shown in the inset (bottom left). Note that the large face responses for low noise in the pink triangle site marked with an asterisk are due to several outlier responses for faces (although close examination determined that these were not artifactual). There is an onset delay between all of the early visual areas (left column) and the loci of confluent processing (middle column; significant vs. 0, P < 10−3 for all 3 independently), and that the duration of response was longer in the postperceptual sides (right column) than the loci of confluent processing (middle column; significant vs. 0, P ≤ 0.01 for all 4 independently).
Perceptual threshold.
The task format was to press the button when a face was seen, with accuracy quantified as the percentage of face-choice stimuli where a face was actually present in the stimulus. Note that this definition of accuracy is somewhat nebulous at the highest levels of noise, where a face should never actually be physically detectable from the noise but which we designate as 50% “faces” nonetheless. We determined the perceptual threshold by calculating the d′ sensitivity index as a function of noise. The perceptual threshold is the value for which d′ of subject choice vs. stimulus type falls to <1 (Levitt 1971) (indicated by arrows in Fig. 7B).
Physiological subtype identification criteria.
We initially identified visually responsive electrodes in the localizer task by comparing the mean broadband magnitude from blank screen presentation epochs to either face or house picture presentation epochs (Fig. 8–10) with a significance threshold of P < 0.05 after Bonferroni correction for multiple comparisons, and cross-correlation between picture and blank screen of r2 > 0.1. These electrodes were examined further in the noisy task by comparing face and house low noise projections (0–40% noise; face localizer template projected into noisy face trials vs. house localizer template projected into noisy house trials); electrodes with face-vs.-house cross-correlation (r2) values >0.05 and P values <0.05 (uncorrected for multiple comparisons) were deemed face or house selective (whichever has higher projection magnitude is the preferred selectivity type). For category-selective sites, they were deemed convergent regions of visual evidence and categorical assignment (loci of percept formation) if 1) at low noise levels (0–40%) there was a Pearson’s correlation of r < −0.1 between noise and projection magnitude, 2) there was a significant difference between low and high noise with a P value <0.05 for comparison of selectivity type projection magnitudes for 0–40% noise vs. 70–100% noise (uncorrected for multiple comparisons), and 3) there was a smaller categorical difference (smaller r2 for face vs. house projection magnitude) for high noise (70–100%) compared with low noise (0–40%). P values were obtained by first randomly reshuffling the face and house labels and then recomputing the difference in mean projection magnitudes. A total of 104 reshuffling iterations were performed, and the P value is the percentage of the reshuffled difference in means that was greater than the actual difference in means. All results were unchanged if unpaired t-tests were used instead of label reshuffling to determine significance.
Fig. 10.
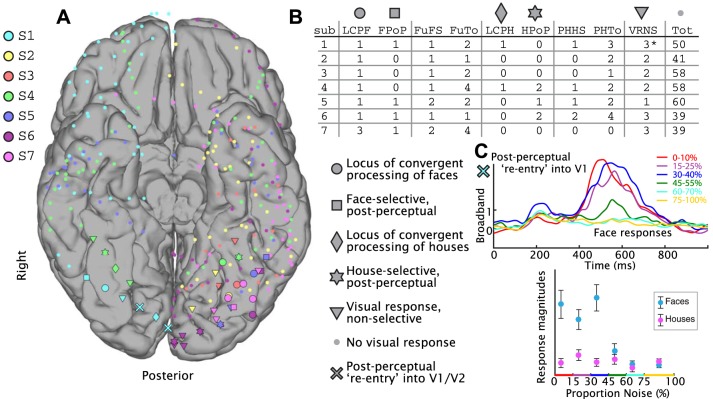
Aggregate summary of face- and house-selective responses. A: all subtemporal, mesial occipital, and subfrontal sites included in the study are shown on a template brain. Subject number is indicated by color key at top left. Symbol type indicates the electrophysiological response, according to the key at bottom right. B: table lists number of electrodes of each electrophysiological type for each subject. LCPF, locus of convergent processing of faces (locus of face percept formation); FPoP, face-selective, postperceptual; FuFS, face-selective fusiform sites; FuTo, total number of fusiform sites; LCPH, locus of convergent processing of houses (locus of house percept formation); HPoP, house-selective, postperceptual; PHHS, house-selective lingual/parahippocampal sites; PHTo, total number of lingual/parahippocampal sites; VRNS, number of visually responsive but nonselective sites; Tot, total number of electrodes. Asterisk indicates that 2 of the electrodes in early visual cortex in subject 1 had an initial nonselective response, followed by a delayed postperceptual reentry into V1 (noted by × symbol in A, with physiology illustrated in C). C: 2 of the early visual electrodes in V1/V2 for subject 1 showed delayed face percept-specific broadband activity, contingent on noise level (the more posterior × site from A is shown). Top plot shows averaged broadband responses for different ranges of stimulus noise, demonstrating an initial nonselective visual response at ~200 ms poststimulus, followed by late “reentrant” activity at 400–700 ms that is selective for low-noise face stimuli. Bottom plot shows that this effect is selective for faces, above the perceptual threshold.
Onset and duration calculation.
We defined a “set level” of broadband activity for each trial as 75% of the mean broadband from the 100- to 400-ms poststimulus interval. For each stimulus presentation, the single-trial onset was defined as the time at which the broadband signal first exceeded the set level for at least 20 ms continuously. The duration of the response was defined as the total time that the broadband activity exceeded the set level, minus the onset time. Differences between electrodes in onset and duration were calculated for each stimulus presentation and measured for significance vs. zero by reshuffling sign and resampling. Only low-noise-level trials (0–40%) were considered for analysis, because response magnitudes are too low at higher noise to reliably estimate timing. We performed comparisons between 1) onsets of visually responsive but nonselective pericalcarine sites vs. sites of convergent processing of faces and 2) durations of sites of convergent processing of faces and postperceptual face-selective sites (Figs. 8 and 9).
RESULTS
To address whether and how face percepts are generated in the human ventral temporal lobe, we used a standard face/place localizer task (Rossion et al. 2003) followed by a noise-limited perceptual task (Heekeren et al. 2004; Pelli 1985) while measuring brain surface electrophysiology.
Basic localizer images task.
In our study, patients implanted with ECoG electrodes (for diagnostic evaluation of intractable seizures) first performed a “localizer task” where they were shown static pictures of faces and houses, reporting a rare upside-down image, with no additional choice element (Fig. 1). The time course of broadband spectral change was measured, which has been shown to be a robust correlate of neural activity at the population scale in ECoG studies (Miller et al. 2009a, 2009b, 2014). Ventral temporal loci with visually responsive broadband activation were identified for house and face stimuli (Fig. 10). Of note, this result only identified active regions for face and house images, and did not test a wide semantic space to rule out responsiveness to other types of stimuli. Average face and house response profiles from these loci were generated for subsequent use as canonical “template-response profiles” (see Fig. 1E). These had a characteristic “fast-rise, slow-decay” shape, as seen in prior work (Miller et al. 2015, 2016). Once this basic responsiveness was established from the localizer task, we could then probe the selective physiology with the addition of visual noise.
Noisy images task.
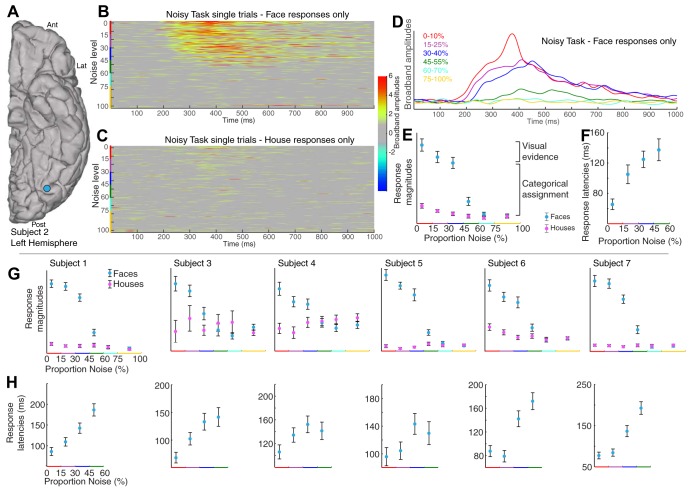
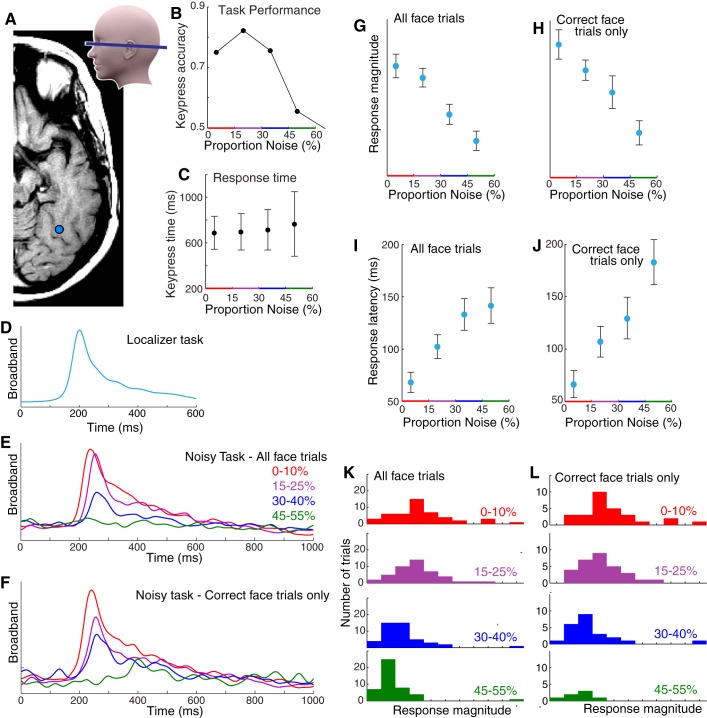
The patients then participated in a separate task to examine the perceptual process in finer detail, focusing specifically on the category-selective loci identified with the localizer task. Randomly interleaved phase-scrambled close-up pictures of faces and houses (Heekeren et al. 2004) were presented for 1 s each (“noisy task;” Fig. 1). Stimuli ranged from 0 to 100% phase-scrambled noise in 5% increments, and subjects pressed a key when they believed a face was shown. This protocol allowed us to simultaneously estimate perceptual decisions and neural activity (Britten et al. 1996; Pestilli et al. 2011). Template-response profiles estimated from the localizer ask (Fig. 1, E and H) were projected to single-trial neuronal response profiles from the noisy task, with the use of a sliding dot product, to estimate response magnitudes and latencies (time from stimulus onset to maximum; Fig. 2G). Robust neurometric functions (Beauchamp et al. 2012; Britten et al. 1992) revealed graded decreases in neural activity with image noise increase for many face-selective fusiform gyral sites and house-selective lingual gyral sites (Figs. 1, 3–5, 8–10). For certain posterior fusiform face-selective sites, this parametric decrement with increasing noise is evident on individual trials, up to a threshold noise level, and drops to baseline thereafter. Additionally, neural response latency is parametrically delayed with increasing image noise (Figs. 3–5). This parametric relationship between image noise and the magnitude and latency of neural activity reveals that basic physical qualities of each visual stimulus are being processed at these posterior fusiform loci (when the stimulus noise is less than the physiological threshold). Incrementally graded responses are robust even when only correct trials are considered (Fig. 4), which demonstrates that the graded effect is not due to averaging of an all-or-nothing response (as might also be inferred by stable error bar size). Collectively, this confluence of graded response, category selectivity, and physiological thresholding in certain posterior fusiform regions identifies convergence of bottom-up and top-down processing. We propose that regions with this physiology are distinct loci of face percept formation. Although many house-selective sites were identified, only two such sites of bottom-up and top-down convergence were observed for house perception (Figs. 5F and 10). This may be because many of the “place-selective” loci identified by fMRI lie within the collateral sulcus, rather than the gyral convexity on the surface covered by our ECoG electrodes (Epstein and Kanwisher 1998).
Fig. 3.
The face-selective neuronal response is parametrically decremented and delayed up to a threshold noise level and then disappears, revealing convergent processing of visual evidence and categorical assignment. A: data are from subject 2’s most face-selective electrode (blue). B: single-trial broadband raster, sorted by noise level, for faces only. C: same as B, for houses only. D: averaged broadband responses to all face stimuli (noisy task). E: single-trial projection magnitudes of the face template into all noisy-task data (sorted by noise). F: response latencies for face trials as a function of image noise. G: neurometric functions (as in E) for the remaining 6 subjects in the most face-selective site (all were from the posterior fusiform gyrus). H: corresponding response latencies for subjects represented in G.
Fig. 4.
The graded nature of the neuronal population response with noise is unimodal and independent of perception. A: subject 3’s most face-selective electrode (blue). B: subject accuracy, sorted by noise level. C: keypress times, sorted by noise level (note: there was no incentive to respond faster). D: localizer task face template. E: averaged broadband responses to all face stimuli (noisy task). F: same as E, but for correct keypress trials only. G: neurometric function; projection magnitudes of the face template into all noisy task data. Note the graded decrease with increasing noise (rather than all-or-nothing response). H: same as G, but for correct trials only. I: response latencies as a function of image noise. J: same as I, but for correct trials only. This shows that the increasing delay observed with increasing noise cannot be explained by an averaging of correctly and incorrectly perceived face stimuli. K: histogram of response magnitudes, sorted by noise level. L: same as K, but for correct trials only. Note that each distribution is unimodal, indicating that the decremented average traces (E) and response magnitudes (I) with noise are not due to the averaging of an all-or-nothing response but are instead graded with stimulus noise.
In addition to the posterior fusiform loci of convergent processing (loci of face percept formation), there were other fusiform sites that appear to be postperceptual and purely categorical (Figs. 8–10): they showed face selectivity and physiological thresholding, but showed no significant graded response magnitude when image noise was below the physiological threshold (i.e., the face response was approximately “all or nothing”). In three of four cases (Figs. 9 and 10), these sites were anterior to loci of convergent processing. The dynamics of these temporal lobe regions are tightly linked (and likely interdependent), as revealed by the trial-by-trial projection magnitudes and latencies, which were strongly and significantly correlated between the postperceptual face-selective sites and the loci of face percept formation (examined for low noise, <40%; projection magnitudes: subject 1: r = 0.49, subject 5: r = 0.43, subject 6: r = 0.22, subject 7: r = 0.33, all significant to P ≤ 0.01; projection latencies: subject 1: r = 0.40, subject 5: r = 0.26, subject 6: r = 0.23, subject 7: r = 0.46, all significant to P < 0.01; if magnitudes and latencies are shuffled while noise level and face/house label are maintained, there are no significant correlations). In all cases, the duration of neural activity following each stimulus is longer in these postperceptual areas than in the loci of convergent face processing (illustrated in Fig. 9 and significant to P ≤ 0.01 in all 4 cases where both types of sites were found in the same subject). Interestingly, activity onset in these postperceptual regions significantly preceded activity in loci of convergent face processing in three of four cases (examined for <40% noise; subject 5: 71 ± 8 ms;, subject 6: 33 ± 10 ms, subject 7: 33 ± 8 ms, all P < 0.001; subject 1, not significant).
Conversely, we also observed preperceptual regions in pericalcarine visual areas (Figs. 8–10). These were characterized by category-nonselective physiological response with onset times that temporally preceded the onset in activity at posterior fusiform loci of convergent face processing (illustrated in Fig. 9 and significant to P < 10−4 in all 3 cases). The duration of response is longer in preperceptual pericalcarine visual areas than in areas of convergent face processing in two of three cases (subject 2: 88 ± 26 ms, subject 6: 178 ± 26 ms, all P < 0.001; subject 7, not significant). In two of three patients, projection magnitudes were significantly correlated between these two regions (subject 2: r = 0.28, subject 7: r = 0.28, P = 0.001; subject 6, not significant; subjects 2 and 7, correlations not significant if magnitudes are shuffled while noise level and face/house label are maintained), but projection latencies were not correlated.
Interestingly, in one subject, there was evidence of semantically specific backprojection into primary visual cortex, characterized by an early nonselective, noise-ungraded response followed by a face-selective response that was graded by stimulus noise (Fig. 10C). After establishing ECoG responses at different loci within the temporal lobe, we wanted to know whether the physiological thresholding we observed correlated with perceptual performance. To make this assessment, we used machine-learning methods for consolidation of single-trial ECoG measurements from different loci into a summary binary assignment.
Decoding.
To assess how well these ventral temporal areas represent behaviorally reflected perception, we applied a Fisher linear discriminant decoder, trained on response magnitudes from the choice-free localizer task, to classify response magnitudes from the noisy task (Fig. 6). Decoder performance paralleled the patients’ performance and robustly predicted the stimulus type up to the perceptual threshold, before falling to chance (Fig. 7). Further comparison reveals that the perceptual threshold determined by keypress accuracy is mirrored by physiological thresholding seen at face perceptual loci (and reflected by the classifier), establishing a firm connection between the two. After accuracy is sorted by noise level, the correlation between keypress and decoder is r(P) = 0.99(0.0003), 0.81(0.05), 0.85(0.03), 0.97(0.001), for subjects 3–6, respectively (as in Fig. 7B). When sensitivity (d′) is sorted by noise level to compare keypress and decoder, the correlation is similarly high r(P) = 0.68(0.14), 0.89(0.02), 0.97(0.001), 0.95(0.003), for subjects 3–6, respectively.
Of additional note, subjects 3–5 very rarely (~5–10% of stimuli) indicated that they saw a face at high noise level. This likely reflects hesitance to choose “face” due to uncertainty, rather than the belief that a house had been seen. For decoding, the physiology underlying the face feature tended to be more robust than the physiology underlying the house feature, an example of which can be seen in the relative spread of data on the x-axis compared with the y-axis in Fig. 6E. Therefore, the decoder, built on these features, rarely picked “face” at high noise level. Comparisons between decoder choice and subject choice were thus confounded at high noise levels, where subject and decoder choice were both heavily biased against a “face” choice.
DISCUSSION
A brain region where percepts are formed will be physiologically localized by measurement of simple visual information converging with perceptual object category assignment. In the posterior fusiform gyrus, we consistently measured from electrodes with face-selective physiology that met both criteria. As shown in Fig. 3, there is a decremented, proportional-to-noise, response magnitude from ~0–50% noise for face stimuli, reflecting representation of bottom-up visual evidence. Top-down face-category assignment is simultaneously revealed in the physiological response of these same electrodes: face stimuli with greater than ~50% noise and all house stimuli do not evoke any perturbation from baseline neural activity. Comparison with keypress accuracy reveals that this physiological thresholding at ~50% noise corresponds to the perceptual threshold (Fig. 7). This result was found for face percept formation in all seven subjects, but we only identified two house-selective sites that suggested similar physiology (Figs. 5F and 10). Because recent studies with ECoG and fMRI in the same patients have shown a tight correlation for these ventral temporal category-selective responses (Jacques et al. 2016), we might turn to fMRI studies to help understand our findings. Using careful analysis of fMRI activity recorded while subjects viewed movies for an extended period, Huth et al. (2012) were able to survey a very wide range of representations for many of the objects and concepts encountered in everyday life, to develop a semantic space that could be mapped back to the brain surface. They found that face representation has a robustly distinct topological representation but that nearly everything else, including houses, is represented with a smooth gradient that is highly overlapping with other perceptual object categories. In light of this, one should not infer that our finding of loci of distinct face percept formation would generalize to the wider conceptual space that is processed in the ventral temporal lobe, and future experiments will need to test this explicitly.
Rather than all-or-nothing activation, it has been observed that there is a smooth topological continuum of graded metabolic (fMRI) responses to certain visual stimuli on the ventral temporal brain surface corresponding to a morphological continuum in “face-like feature” sensitivity (Tootell et al. 2008). The predominant view, based on fMRI activity, has maintained that there are face/house/tool- or other selective loci, where all stimuli are processed, but the preferred stimulus dominates (Haxby et al. 2001; Heekeren et al. 2004; Ishai et al. 1999, 2000; Kanwisher et al. 1997; Tootell et al. 2008). Combined with reports of graded response to low-level aspects of face stimuli (Yue et al. 2011), this might suggest fusiform face processing is organized as a perceptual analog of retinotopic fields, parametrically filtering visual input for the degree that it represents a canonical type. An example of physiological measurement consistent with this organization is shown for the house-selective site in Fig. 1H. The anatomic location of this electrode is approximately V3v (Wandell and Winawer 2011), which is one area where Tjan et al. (2006) found that magnitude of the blood oxygen level-dependent (BOLD) response was proportional to the signal-to-noise ratio for noise-degraded images of scenes. However, this smooth parametric filtering for type was not seen in any face-selective sites. Instead, ECoG measurements show that most face-selective loci have little or no activity beyond baseline during viewing of house stimuli (Figs. 1, 3–5, 8, 9; see also Ghuman et al. 2014; Miller et al. 2015; Vidal et al. 2010), which is similar to many single-unit measurements from fMRI face patches of nonhuman primates (Tsao et al. 2006). In the posterior fusiform loci from which we measured, graded activity was measured, but it showed a sharp cutoff at the perceptual threshold, rather than the continuum that might be expected from fMRI studies (Yue et al. 2011). Rather than a smooth progression of physical and then semantic filters during perception, our findings suggest that, for faces, the ventral stream converts visual information to fully formed perceptual abstractions in a discrete step, in the posterior aspect of the fusiform gyrus.
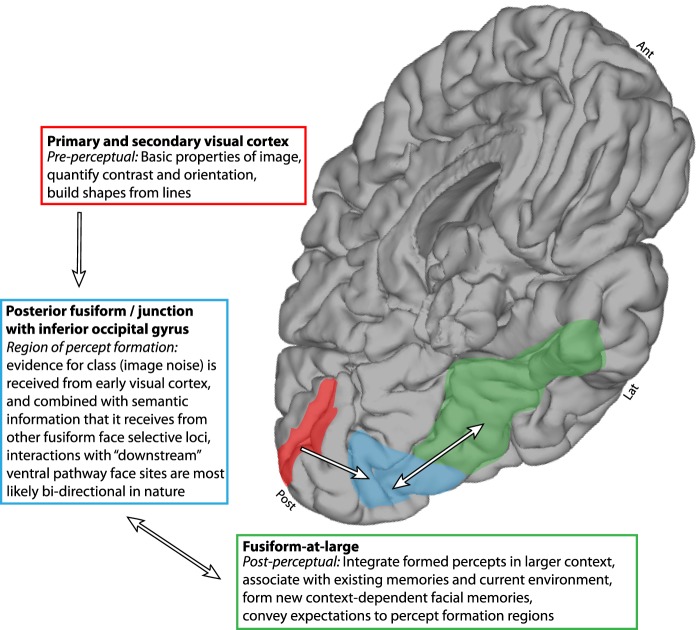
When these posterior fusiform measurements are placed in the context of simultaneous measurement from other cortical regions, our findings suggest a general framework for sequential processing during face percept formation. As shown in Figs. 8 and 9, preperceptual electrodes in early visual calcarine cortex revealed representation of simple visual features, with different magnitudes of neural activity for different levels of stimulus noise but without category selectivity. The neural activity in these preperceptual pericalcarine regions temporally precedes activity in the posterior fusiform loci of percept formation by ~100–150 ms. Conversely, activity in postperceptual face fusiform regions temporally follows loci of perception. Postperceptual face regions show a bimodal distribution of activity above the perceptual threshold, with an all-or-nothing response on each trial (Figs. 8 and 9). Regions of active percept formation were physiologically at an intersection: we measured a graded response for low-noise face stimuli and robust category selectivity for stimuli above the perceptual threshold, followed by a distinct drop-off below the perceptual threshold, revealing a confluence of bottom-up stimulus evidence and top-down semantic category assignment. Although electrode coverage for any given patient is sparse, and our full understanding is therefore somewhat limited, a coarse structure for ventral pathway face percept formation is revealed from our measurements (Figs. 8–11): basic shapes are built from simple image features in pericalcarine cortex (preperceptual regions); this information is passed to a posterior fusiform region that bidirectionally interacts with the fusiform at large, associating higher order cognitive properties (memories and contextual scene information) to register a face percept (at the region of convergence of processing of low-level visual properties and categorical assignment: the locus of face perception); when a face has been perceived, the other fusiform face regions show persistent activity (prolonged duration) while integrating this face into a general perceptual context (Burton et al. 1999; Miller et al. 2015), assisting in decision making (Heekeren et al. 2004), and forming memory of it (Gilbert and Li 2013) (in postperception associative regions). Consistent with this framework, magnetoencephalographic studies that have documented staged face perception, characterized by initial face categorization followed by individual identity assignment (Liu et al. 2002), likely reflect sequential processing in different subregions of fusiform face cortex.
Fig. 11.
Simplified schematic of a proposed topological structure of face percept formation.
This finding of different subregions of fusiform face cortex, independently specialized as postperceptual or active loci of perception, can suggest why distinct subtypes of prosopagnosia occur following injury to the ventral temporal lobe (Davies-Thompson et al. 2014). The apperceptive form of prosopagnosia is characterized by an inability to form face percepts and is associated with selective lesions of the posterior border of the fusiform gyrus, precisely where we have found physiological correlates of face percept formation. Associative prosopagnosia, where formed faces cannot be compared with one another or with memories, would correspond to lesions of the postperceptual face areas we observe. Our results may also help us understand why previous studies have observed both apperceptive and associative effects such as interruption of face recognition, distortion of facial feature relationships, and inability to name or identify familiar faces (Jonas et al. 2012; Penfield and Perot 1963; Puce et al. 1999).
Visual perception is the process of combining simple visual features to extract an independent concept to which memories, expectations, and context designate a larger meaning (Gibson 1950). Anatomic regions where this process might take place will be revealed if basic physical properties of stimuli are independently represented alongside recognition of abstract conceptual objects (Rees et al. 2002). In ventral temporal cortex, there are known to be anatomically distinct regions that differentially or preferentially process specific object categories (Grill-Spector et al. 2004; Ishai et al. 1999; Spiridon and Kanwisher 2002), but it has remained unknown whether these regions represent accumulation of visual evidence or fully formed object percept (Halgren et al. 2000; Heekeren et al. 2004; Yue et al. 2011). In the present study we have shown that simple visual properties and abstract recognition converge for active face percept formation at specific loci within human ventral temporal cortex. We measured broadband electrical potential changes from implanted electrodes in humans (Miller et al. 2015) during a face and house picture decision task, where images were parametrically degraded. Up to a threshold noise level, category-selective single-trial responses showed progressively diminished and delayed activity as stimulus noise increased. A decoder reveals that this physiological threshold mirrors perception: beyond the perceptual threshold, or for a nonpreferred stimulus category, there was little to no response. These findings firmly establish category-selective ventral temporal nodes where visual evidence and categorical assignment coalesce to form discrete percepts. Different forms of face-processing dysfunction (prosopagnosia) after brain injury (Davies-Thompson et al. 2014) can now be understood as selective injury to specific functional subregions within the ventral temporal face area.
GRANTS
This work was financially supported by the National Aeronautics and Space Administration (NASA) Graduate Student Research Program as well as National Institutes of Health (NIH) Grants R01 NS065186 (K. J. Miller, J. G. Ojemann), T32 EY20485 (D. Hermes), and NIMH ULTTR001108 (F. Pestilli) and National Science Foundation (NSF) Awards EEC-1028725 (Center for Sensorimotor Neural Engineering), IIS-1636893 (F. Pestilli), and BCS-1734853 (F. Pestilli).
DISCLAIMERS
The views expressed in this work are those of the authors and do not represent the official views of NASA, the NSF, or the NIH.
DISCLOSURES
No conflicts of interest, financial or otherwise, are declared by the authors.
ENDNOTE
At the request of the author(s), readers are herein alerted to the fact that additional materials related to this manuscript may be found at the institutional website of the authors, which at the time of publication they indicate is: https://purl.stanford.edu/bn040vv9324. These materials are not a part of this manuscript and have not undergone peer review by the American Physiological Society (APS). APS and the journal editors take no responsibility for these materials, for the website address, or for any links to or from it.
AUTHOR CONTRIBUTIONS
K.J.M., G.S.W., and J.G.O. conceived and designed research; K.J.M., G.S.W., and J.G.O. performed experiments; K.J.M. and D.H. analyzed data; K.J.M. interpreted results of experiments; K.J.M. prepared figures; K.J.M. drafted manuscript; K.J.M., D.H., F.P., and J.G.O. edited and revised manuscript; K.J.M., D.H., F.P., G.S.W., and J.G.O. approved final version of manuscript.
ACKNOWLEDGMENTS
We are grateful to John Winawer, Brian Wandell, Bill Newsome, Tim Blakely, Nick Ramsey, Rajesh Rao, and Nathan Witthoft for helpful discussion and to the Ungerleider Laboratory at the National Institute of Health in Bethesda, MD for sharing their stimuli.
REFERENCES
- Allison T, Puce A, Spencer DD, McCarthy G. Electrophysiological studies of human face perception. I: Potentials generated in occipitotemporal cortex by face and non-face stimuli. Cereb Cortex 9: 415–430, 1999. doi: 10.1093/cercor/9.5.415. [DOI] [PubMed] [Google Scholar]
- Beauchamp MS, Sun P, Baum SH, Tolias AS, Yoshor D. Electrocorticography links human temporoparietal junction to visual perception. Nat Neurosci 15: 957–959, 2012. doi: 10.1038/nn.3131. [DOI] [PMC free article] [PubMed] [Google Scholar]
- Britten KH, Newsome WT, Shadlen MN, Celebrini S, Movshon JA. A relationship between behavioral choice and the visual responses of neurons in macaque MT. Vis Neurosci 13: 87–100, 1996. doi: 10.1017/S095252380000715X. [DOI] [PubMed] [Google Scholar]
- Britten KH, Shadlen MN, Newsome WT, Movshon JA. The analysis of visual motion: a comparison of neuronal and psychophysical performance. J Neurosci 12: 4745–4765, 1992. [DOI] [PMC free article] [PubMed] [Google Scholar]
- Burton A, Bruce V, Hancock P. From pixels to people: a model of familiar face recognition. Cogn Sci 23: 1–31, 1999. doi: 10.1207/s15516709cog2301_1. [DOI] [Google Scholar]
- Contreras JM, Banaji MR, Mitchell JP. Multivoxel patterns in fusiform face area differentiate faces by sex and race. PLoS One 8: e69684, 2013. doi: 10.1371/journal.pone.0069684. [DOI] [PMC free article] [PubMed] [Google Scholar]
- Dale AM, Fischl B, Sereno MI. Cortical surface-based analysis. I. Segmentation and surface reconstruction. Neuroimage 9: 179–194, 1999. doi: 10.1006/nimg.1998.0395. [DOI] [PubMed] [Google Scholar]
- Davies-Thompson J, Pancaroglu R, Barton J. Acquired prosopagnosia: structural basis and processing impairments. Front Biosci (Elite Ed) 6: 159–174, 2014. [DOI] [PubMed] [Google Scholar]
- Dretske F. Knowledge and the Flow of Information. Cambridge, MA: The MIT Press, 1981. [Google Scholar]
- Epstein R, Kanwisher N. A cortical representation of the local visual environment. Nature 392: 598–601, 1998. doi: 10.1038/33402. [DOI] [PubMed] [Google Scholar]
- Ghuman AS, Brunet NM, Li Y, Konecky RO, Pyles JA, Walls SA, Destefino V, Wang W, Richardson RM. Dynamic encoding of face information in the human fusiform gyrus. Nat Commun 5: 5672, 2014. doi: 10.1038/ncomms6672. [DOI] [PMC free article] [PubMed] [Google Scholar]
- Gibson JJ. The Perception of the Visual World. Boston, MA: Houghton Mifflin, 1950. [Google Scholar]
- Gilbert CD, Li W. Top-down influences on visual processing. Nat Rev Neurosci 14: 350–363, 2013. doi: 10.1038/nrn3476. [DOI] [PMC free article] [PubMed] [Google Scholar]
- Grill-Spector K, Knouf N, Kanwisher N. The fusiform face area subserves face perception, not generic within-category identification. Nat Neurosci 7: 555–562, 2004. doi: 10.1038/nn1224. [DOI] [PubMed] [Google Scholar]
- Halgren E, Raij T, Marinkovic K, Jousmäki V, Hari R. Cognitive response profile of the human fusiform face area as determined by MEG. Cereb Cortex 10: 69–81, 2000. doi: 10.1093/cercor/10.1.69. [DOI] [PubMed] [Google Scholar]
- Haxby JV, Gobbini MI, Furey ML, Ishai A, Schouten JL, Pietrini P. Distributed and overlapping representations of faces and objects in ventral temporal cortex. Science 293: 2425–2430, 2001. doi: 10.1126/science.1063736. [DOI] [PubMed] [Google Scholar]
- Heekeren HR, Marrett S, Bandettini PA, Ungerleider LG. A general mechanism for perceptual decision-making in the human brain. Nature 431: 859–862, 2004. doi: 10.1038/nature02966. [DOI] [PubMed] [Google Scholar]
- Heekeren HR, Marrett S, Ungerleider LG. The neural systems that mediate human perceptual decision making. Nat Rev Neurosci 9: 467–479, 2008. doi: 10.1038/nrn2374. [DOI] [PubMed] [Google Scholar]
- Hermes D, Miller KJ, Noordmans HJ, Vansteensel MJ, Ramsey NF. Automated electrocorticographic electrode localization on individually rendered brain surfaces. J Neurosci Methods 185: 293–298, 2010. doi: 10.1016/j.jneumeth.2009.10.005. [DOI] [PubMed] [Google Scholar]
- Huth AG, Nishimoto S, Vu AT, Gallant JL. A continuous semantic space describes the representation of thousands of object and action categories across the human brain. Neuron 76: 1210–1224, 2012. doi: 10.1016/j.neuron.2012.10.014. [DOI] [PMC free article] [PubMed] [Google Scholar]
- Ishai A, Ungerleider LG, Martin A, Haxby JV. The representation of objects in the human occipital and temporal cortex. J Cogn Neurosci 12, Suppl 2: 35–51, 2000. doi: 10.1162/089892900564055. [DOI] [PubMed] [Google Scholar]
- Ishai A, Ungerleider LG, Martin A, Schouten JL, Haxby JV. Distributed representation of objects in the human ventral visual pathway. Proc Natl Acad Sci USA 96: 9379–9384, 1999. doi: 10.1073/pnas.96.16.9379. [DOI] [PMC free article] [PubMed] [Google Scholar]
- Jacques C, Witthoft N, Weiner KS, Foster BL, Rangarajan V, Hermes D, Miller KJ, Parvizi J, Grill-Spector K. Corresponding ECoG and fMRI category-selective signals in human ventral temporal cortex. Neuropsychologia 83: 14–28, 2016. doi: 10.1016/j.neuropsychologia.2015.07.024. [DOI] [PMC free article] [PubMed] [Google Scholar]
- Jonas J, Descoins M, Koessler L, Colnat-Coulbois S, Sauvée M, Guye M, Vignal JP, Vespignani H, Rossion B, Maillard L. Focal electrical intracerebral stimulation of a face-sensitive area causes transient prosopagnosia. Neuroscience 222: 281–288, 2012. doi: 10.1016/j.neuroscience.2012.07.021. [DOI] [PubMed] [Google Scholar]
- Joseph JE. Functional neuroimaging studies of category specificity in object recognition: a critical review and meta-analysis. Cogn Affect Behav Neurosci 1: 119–136, 2001. doi: 10.3758/CABN.1.2.119. [DOI] [PubMed] [Google Scholar]
- Kanwisher N, McDermott J, Chun MM. The fusiform face area: a module in human extrastriate cortex specialized for face perception. J Neurosci 17: 4302–4311, 1997. [DOI] [PMC free article] [PubMed] [Google Scholar]
- Kawasaki H, Tsuchiya N, Kovach CK, Nourski KV, Oya H, Howard MA, Adolphs R. Processing of facial emotion in the human fusiform gyrus. J Cogn Neurosci 24: 1358–1370, 2012. doi: 10.1162/jocn_a_00175. [DOI] [PMC free article] [PubMed] [Google Scholar]
- Kinchla RA, Wolfe JM. The order of visual processing: “Top-down,” “bottom-up,” or “middle-out.” Percept Psychophys 25: 225–231, 1979. doi: 10.3758/BF03202991. [DOI] [PubMed] [Google Scholar]
- Levitt H. Transformed up-down methods in psychoacoustics. J Acoust Soc Am 49: 467–477, 1971. doi: 10.1121/1.1912375. [DOI] [PubMed] [Google Scholar]
- Liu J, Harris A, Kanwisher N. Stages of processing in face perception: an MEG study. Nat Neurosci 5: 910–916, 2002. doi: 10.1038/nn909. [DOI] [PubMed] [Google Scholar]
- Liu J, Harris A, Kanwisher N. Perception of face parts and face configurations: an FMRI study. J Cogn Neurosci 22: 203–211, 2010. doi: 10.1162/jocn.2009.21203. [DOI] [PMC free article] [PubMed] [Google Scholar]
- Manning JR, Jacobs J, Fried I, Kahana MJ. Broadband shifts in local field potential power spectra are correlated with single-neuron spiking in humans. J Neurosci 29: 13613–13620, 2009. doi: 10.1523/JNEUROSCI.2041-09.2009. [DOI] [PMC free article] [PubMed] [Google Scholar]
- McGugin RW, Gatenby JC, Gore JC, Gauthier I. High-resolution imaging of expertise reveals reliable object selectivity in the fusiform face area related to perceptual performance. Proc Natl Acad Sci USA 109: 17063–17068, 2012. doi: 10.1073/pnas.1116333109. [DOI] [PMC free article] [PubMed] [Google Scholar]
- Meadows JC. The anatomical basis of prosopagnosia. J Neurol Neurosurg Psychiatry 37: 489–501, 1974. doi: 10.1136/jnnp.37.5.489. [DOI] [PMC free article] [PubMed] [Google Scholar]
- Mechelli A, Price CJ, Friston KJ, Ishai A. Where bottom-up meets top-down: neuronal interactions during perception and imagery. Cereb Cortex 14: 1256–1265, 2004. doi: 10.1093/cercor/bhh087. [DOI] [PubMed] [Google Scholar]
- Miller KJ, Hermes D, Witthoft N, Rao RP, Ojemann JG. The physiology of perception in human temporal lobe is specialized for contextual novelty. J Neurophysiol 114: 256–263, 2015. doi: 10.1152/jn.00131.2015. [DOI] [PMC free article] [PubMed] [Google Scholar]
- Miller KJ, Honey CJ, Hermes D, Rao RP, denNijs M, Ojemann JG. Broadband changes in the cortical surface potential track activation of functionally diverse neuronal populations. Neuroimage 85: 711–720, 2014. doi: 10.1016/j.neuroimage.2013.08.070. [DOI] [PMC free article] [PubMed] [Google Scholar]
- Miller KJ, Schalk G, Hermes D, Ojemann JG, Rao RP. Spontaneous decoding of the timing and content of human object perception from cortical surface recordings reveals complementary information in the event-related potential and broadband spectral change. PLoS Comput Biol 12: e1004660, 2016. doi: 10.1371/journal.pcbi.1004660. [DOI] [PMC free article] [PubMed] [Google Scholar]
- Miller KJ, Sorensen LB, Ojemann JG, den Nijs M. Power-law scaling in the brain surface electric potential. PLoS Comput Biol 5: e1000609, 2009a. doi: 10.1371/journal.pcbi.1000609. [DOI] [PMC free article] [PubMed] [Google Scholar]
- Miller KJ, Zanos S, Fetz EE, den Nijs M, Ojemann JG. Decoupling the cortical power spectrum reveals real-time representation of individual finger movements in humans. J Neurosci 29: 3132–3137, 2009b. doi: 10.1523/JNEUROSCI.5506-08.2009. [DOI] [PMC free article] [PubMed] [Google Scholar]
- Pelli DG. Uncertainty explains many aspects of visual contrast detection and discrimination. J Opt Soc Am A 2: 1508–1532, 1985. doi: 10.1364/JOSAA.2.001508. [DOI] [PubMed] [Google Scholar]
- Penfield W, Perot P. The brain’s record of auditory and visual experience. a final summary and discussion. Brain 86: 595–696, 1963. doi: 10.1093/brain/86.4.595. [DOI] [PubMed] [Google Scholar]
- Pestilli F, Carrasco M, Heeger DJ, Gardner JL. Attentional enhancement via selection and pooling of early sensory responses in human visual cortex. Neuron 72: 832–846, 2011. doi: 10.1016/j.neuron.2011.09.025. [DOI] [PMC free article] [PubMed] [Google Scholar]
- Plato Phaedo, translated by Gallop D. Oxford: Oxford University Press, 1999. [Google Scholar]
- Puce A, Allison T, McCarthy G. Electrophysiological studies of human face perception. III: effects of top-down processing on face-specific potentials. Cereb Cortex 9: 445–458, 1999. doi: 10.1093/cercor/9.5.445. [DOI] [PubMed] [Google Scholar]
- Rajimehr R, Nasr S, Tootell R. Deconstructing scene selectivity in visual cortex. In: Scene Vision: Making Sense of What We See, edited by Kveraga K and Bar M. Cambridge, MA: The MIT Press, 2014, p. 73–84. [Google Scholar]
- Rees G, Kreiman G, Koch C. Neural correlates of consciousness in humans. Nat Rev Neurosci 3: 261–270, 2002. doi: 10.1038/nrn783. [DOI] [PubMed] [Google Scholar]
- Rossion B, Schiltz C, Crommelinck M. The functionally defined right occipital and fusiform “face areas” discriminate novel from visually familiar faces. Neuroimage 19: 877–883, 2003. doi: 10.1016/S1053-8119(03)00105-8. [DOI] [PubMed] [Google Scholar]
- Sabatinelli D, Frank DW, Wanger TJ, Dhamala M, Adhikari BM, Li X. The timing and directional connectivity of human frontoparietal and ventral visual attention networks in emotional scene perception. Neuroscience 277: 229–238, 2014. doi: 10.1016/j.neuroscience.2014.07.005. [DOI] [PubMed] [Google Scholar]
- Spiridon M, Kanwisher N. How distributed is visual category information in human occipito-temporal cortex? An fMRI study. Neuron 35: 1157–1165, 2002. doi: 10.1016/S0896-6273(02)00877-2. [DOI] [PubMed] [Google Scholar]
- Tjan BS, Lestou V, Kourtzi Z. Uncertainty and invariance in the human visual cortex. J Neurophysiol 96: 1556–1568, 2006. doi: 10.1152/jn.01367.2005. [DOI] [PMC free article] [PubMed] [Google Scholar]
- Tootell RB, Devaney KJ, Young JC, Postelnicu G, Rajimehr R, Ungerleider LG. fMRI mapping of a morphed continuum of 3D shapes within inferior temporal cortex. Proc Natl Acad Sci USA 105: 3605–3609, 2008. doi: 10.1073/pnas.0712274105. [DOI] [PMC free article] [PubMed] [Google Scholar]
- Tsao DY, Freiwald WA, Tootell RB, Livingstone MS. A cortical region consisting entirely of face-selective cells. Science 311: 670–674, 2006. doi: 10.1126/science.1119983. [DOI] [PMC free article] [PubMed] [Google Scholar]
- Vidal JR, Ossandón T, Jerbi K, Dalal SS, Minotti L, Ryvlin P, Kahane P, Lachaux JP. Category-specific visual responses: an intracranial study comparing gamma, beta, alpha, and ERP response selectivity. Front Hum Neurosci 4: 195, 2010. doi: 10.3389/fnhum.2010.00195. [DOI] [PMC free article] [PubMed] [Google Scholar]
- Wandell BA. Foundations of Vision. Sunderland, MA: Sinauer Associates, 1995, p. xvi. [Google Scholar]
- Wandell BA, Winawer J. Imaging retinotopic maps in the human brain. Vision Res 51: 718–737, 2011. doi: 10.1016/j.visres.2010.08.004. [DOI] [PMC free article] [PubMed] [Google Scholar]
- Yue X, Cassidy BS, Devaney KJ, Holt DJ, Tootell RB. Lower-level stimulus features strongly influence responses in the fusiform face area. Cereb Cortex 21: 35–47, 2011. doi: 10.1093/cercor/bhq050. [DOI] [PMC free article] [PubMed] [Google Scholar]


