

Abstract
Background
Cigarette smoking is one of the greatest preventable risk factors for developing cancer, and most cases of lung squamous cell carcinoma (lung SCC) are associated with smoking. The pathogenesis mechanism of tumor progress is unclear. This study aimed to identify biomarkers in smoking‐related lung cancer, including protein‐coding gene, long noncoding RNA, and transcription factors.
Methods
We selected and obtained messenger RNA microarray datasets and clinical data from the Gene Expression Omnibus database to identify gene expression altered by cigarette smoking. Integrated bioinformatic analysis was used to clarify biological functions of the identified genes, including Gene Ontology (GO), Kyoto Encyclopedia of Genes and Genomes (KEGG) pathway, the construction of a protein–protein interaction network, transcription factor, and statistical analyses. Subsequent quantitative real‐time PCR was utilized to verify these bioinformatic analyses.
Results
Five hundred and ninety‐eight differentially expressed genes and 21 long noncoding RNA were identified in smoking‐related lung SCC. GO and KEGG pathway analysis showed that identified genes were enriched in the cancer‐related functions and pathways. The protein–protein interaction network revealed seven hub genes identified in lung SCC. Several transcription factors and their binding sites were predicted. The results of real‐time quantitative PCR revealed that AURKA and BIRC5 were significantly upregulated and LINC00094 was downregulated in the tumor tissues of smoking patients. Further statistical analysis indicated that dysregulation of AURKA, BIRC5, and LINC00094 indicated poor prognosis in lung SCC.
Conclusion
Protein‐coding genes AURKA, BIRC5, and LINC00094 could be biomarkers or therapeutic targets for smoking‐related lung SCC.
Keywords: Biomarkers, gene expression profiling, lncRNA, smoking‐related lung SCC
Introduction
Lung cancer is the leading cause of cancer‐related death worldwide.1 Prognosis of lung cancer patients remains unsatisfactory, with a five‐year overall survival rate of less than 15%.2 Lung squamous cell carcinoma (SCC) is a common histological type of non‐small cell lung cancer (NSCLC) and occurrence is highest in countries where smoking began earlier, such as in Europe and North America.3 Smoking‐associated excess relative risk is significantly greater for lung SCC than for adenocarcinoma.4
Previous studies have explored the relationship between differentially expressed genes (DEGs) and cigarette smoking. For instance, EPHA4, FGFR2, and EGFR are differentially expressed in lung cancer tissues in cigarette smokers.5 Additionally, the polymorphism of P73 is suggested to be highly associated with susceptibility to smoking‐related lung cancer.6 Moreover, transcription factors (TFs) have been identified in lung SCC.7 In spite of these findings, lung cancer prognosis in clinical practice has not improved. Currently, there are no identified molecular targets for therapy of smoking‐related lung cancer. Consequently, afatinib is still the first choice for treatment of lung SCC.8
Nowadays, the use of a gene expression microarray provides a more feasible and effective method for diagnosis and treatment of any disease. When differentially expressed genes are identified during any disease condition, they can further be target genes for treatment of disease. In a recent study, preliminary results revealed the potential roles of long noncoding RNAs (lncRNAs) in tumor progression.9 lncRNA can also be used as a good biomarker for cancers because of its specified expression profile.10 In this study, we performed data mining of GSE43346 and GSE 50081 datasets11, 12 and two lung SCC associated datasets, which included gene expression data of smokers and non‐smokers, to screen the differentially expressed protein‐coding genes and lncRNAs between them. Function and pathway enrichment analyses were conducted and we constructed a protein–protein interaction (PPI) network of the DEGs. Static analysis and functional annotation revealed that AURKA, BIRC5, and LINC00094 could be biomarkers for lung cancer. Additionally, candidate biomarkers were tested through quantitative real‐time PCR (qRT‐PCR).
Methods
The study was conducted with the approval of the Ethics Committee of the Affiliated Hospital of Qingdao University. Patients were informed of the use of their tissue specimens.
Identification of feature genes
The expression profile datasets were downloaded from the Gene Expression Omnibus (GEO; http://www.ncbi.nlm.nih.gov/geo/).13 We selected two gene expression profile datasets, GSE43346 and GSE50081. We used the GPL570 platform to analyze microarray data, and 1125 lncRNA completely matched with probe sets were identified. The Affymetrix Human Genome U133 Plus 2.0 Array (Thermo Fisher Scientific, Waltham, MA, USA), which is extensively used in many research areas, was utilized in the GSE 43346 and GSE50081 data sets.14 GSE43346 contained 70 samples, including 43 normal and 23 tumor tissues (only 40 samples were used); GSE50081 contained 181 lung cancer samples, including lung adenocarcinoma and lung SCC, 71 smokers, 24 non‐smokers, and 21 others (only 20 samples were used).
R version 3.3.3 (R Foundation for Statistical Computing, Vienna, Austria) is a free software environment for both statistical computing and graphics. All data processing was accomplished using the R package limma. After background subtraction and normalization using Robust Multichip Averaging, GEO data was divided into two groups: a control (40 normal tissues) and a disease group (20 malignant tissues). The Limma algorithm was then used to classify DEGs in disease.15 |logFC| > 2 and P < 0.05 were considered significant. A heat map of DEGs was drawn with the R package pheatmap (R Foundation for Statistical Computing).
Co‐expression network construction
We constructed the PPI network using the STRING database and Cytoscape software (www.cytoscape.org). Hub genes were identified from PPIs between DEGs and we obtained the edge length between nodes from these hub genes.
Bioinformatic analysis
Using the Database for Annotation, Visualization and Integrated Discovery (DAVID) (https://david.ncifcrf.gov/), we performed GO and Kyoto Encyclopedia of Genes and Genomes (KEGG) pathway enrichment analysis for DEGs.16 Disease association analysis among hub genes was also conducted.
Transcription factor (TF) analysis
EpiTect ChIP qPCR Primers (http://sabiosciences.com/chipqpcrsearch.php), a free online tool, is specifically designed for the analysis of ChIP‐enriched genomic DNA.17 It is a DNA‐binding domain that you can use to determine which TFs may bind to cis‐acting elements in DNA. Such binding can either enhance or inhibit gene expression. Using EpiTect ChIP qPCR Primers, we extracted several TFs of hub genes from public resources.
Statistical analysis
In order to identify the prognostic value of differentially expressed coding genes or lncRNAs, Kaplan–Meier survival and Cox regression analyses were conducted. Samples were sorted into two groups as “high expression” and “low expression,” and survival analysis was performed between the groups. All statistical analyses were conducted using the ONCOMINE database (https://www.oncomine.org) and Kaplan–Meier Plotter database.18, 19 Statistical significance was examined using a Student's t‐test and P < 0.05 or P < 0.01 was statistically significant.
Quantitative real‐time PCR (qRT‐PCR)
Twelve pairs of lung cancer tissues and matched adjacent normal tissues were collected from smoking patients. Specimens were all snap‐frozen in liquid nitrogen immediately after resection and stored at −80°C until used. Total RNA was then reverse transcribed to cDNA using the Reverse Transcription Kit (Roche, Basel, Switzerland). qRT‐PCR reactions were performed using an ABI StepOnePlus Thermocycler using a SYBR Green PCR Kit (Thermo Fisher Scientific). Primer sequences are shown in Table S1. Each sample was run in triplicate for analysis. Data were calculated using the comparative 2 − ΔΔCT method.
Results
Identification and analysis of differentially expressed genes
There were a total of 598 DEGs, including 179 downregulated and 419 upregulated DEGs. The top differentially expressed genes are shown in a heat map (Fig 1). Five lncRNAs were upregulated and 16 were downregulated in smoking‐related lung SCC (with the threshold P < 0.01) (Table 1). KEGG analysis indicated that the altered genes were significantly enriched in cancer pathways, such as PI3K‐Akt, focal adhesion, and other cancer‐related pathways (Fig 2a). Functional analysis of GO annotation showed that the DEGs were associated with cell adhesion,, regulation of transcription, apoptotic process, and other cancer‐related biological processes (Fig 2b).
Figure 1.
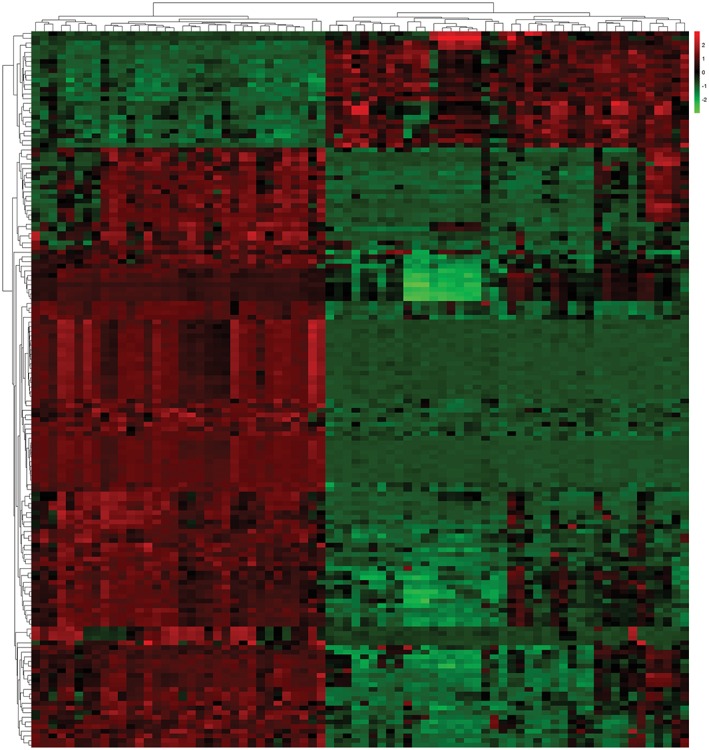
A heat map of differentially expressed gene analysis between smoking‐related lung squamous cell carcinoma and normal tissues in GSE43346 and GSE50081: 419 upregulated and 179 downregulated genes. Red, upregulation; green, downregulation.
Table 1.
Differentially expressed lncRNAs
| Gene symbol | Fold change | P | Length | Chr |
|---|---|---|---|---|
| Downregulated lncRNA | ||||
| LINC00842 | −7.2065916 | 3.09E−11 | 489 | chr10 |
| LINC00094 | −6.2065916 | 2.20E−07 | 1099 | chr9 |
| LINC01590 | −5.2065916 | 1.75E−12 | 624 | chr5 |
| LINC00342 | −4.2065916 | 2.50E−08 | 3233 | chr1 |
| LINC00339 | −3.2065916 | 6.51E−15 | 2131 | chr9 |
| LINC00626 | −2.2065916 | 1.03E−07 | 2342 | chr4 |
| LINC01420 | −1.2065916 | 8.62E−15 | 773 | chr4 |
| LINC00152 | −0.2065916 | 2.86E−12 | 524 | chr20 |
| LINC00511 | −0.7934084 | 4.22E−17 | 1879 | chr2 |
| LINC01355 | −1.7934084 | 5.66E−10 | 3425 | chr10 |
| LINC01503 | −2.7934084 | 9.99E−14 | 423 | chr21 |
| LINC01614 | −3.7934084 | 1.40E−09 | 1509 | chr15 |
| LINC00844 | −4.7934084 | 2.47E−05 | 908 | chr4 |
| LINC01296 | −5.7934084 | 1.58E−09 | 2098 | chr1 |
| LINC00537 | −6.7934084 | 8.84E−04 | 2231 | chr9 |
| Upregulated lncRNA | ||||
| LINC01560 | 2.379167 | 1.88E−18 | 1992 | chr10 |
| LINC01133 | 2.270887 | 7.46E−04 | 598 | chr2 |
| LINC01296 | 8.611893 | 3.48E−14 | 1123 | chr14 |
| LINC00847 | 2.00837 | 2.15E−11 | 3412 | chr16 |
| LINC01206 | 2.152284 | 1.07E−12 | 3222 | chr5 |
Figure 2.
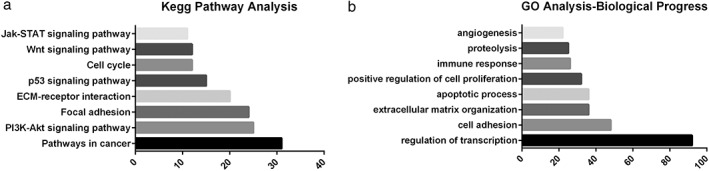
The top eight terms of biological processes of (a) Kyoto Encyclopedia of Genes and Genomes (KEGG) pathway and (b) Gene Ontology (GO) enrichment analysis in differentially expressed genes.
Hub gene analysis
A PPI network was created for all 609 DEGs using the STRING database to identify the key hub gene with an adjacent P value of < 0.05. Consequently, only seven out of the 609 DEGs, MCM5, CDC6, RRM2, CCNB2, AURKA, BIRC5, and PIK3CA, significantly interacted. The PPI network of hub genes obtained from STRING is shown in Figure 3.
Figure 3.
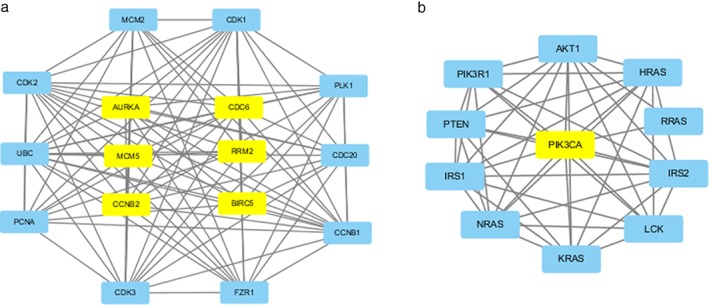
Protein–protein interaction network of hub genes obtained using Cytoscape software. (a) There is a strong interaction between MCM5, CDC6, RRM2, CCNB2, AURKA, and BIRC5. (b) PIK3CA does not interact with any of the genes.
Survival analysis
Using the ONCOMINE and Kaplan–Meier‐plotter databases, we performed a Kaplan–Meier curve and Cox regression for the three genes and differentially expressed lncRNAs, and results indicated that AURKA and BIRC5 were obviously associated with survival in lung carcinoma patients. Higher AURKA and BIRC5 expression indicated shorter overall survival (hazard ratio = 1.62, 1.63, respectively) (Fig 4a,b). Because of the unique nature of lncRNA expression, differentially expressed lncRNAs may be a predictive biomarker of cancer. Meanwhile, a novel lncRNA was found; LINC00094 expression could predict lung cancer survival, especially in lung cancer patients with lower LINC00094 expression, which indicated shorter overall survival (hazard ratio = 0.81) (Fig 4c). Additionally, using the ONCOMINE database, AURKA and BIRC5 were significantly highly expressed in lung cancer tissues (Fig 5).
Figure 4.
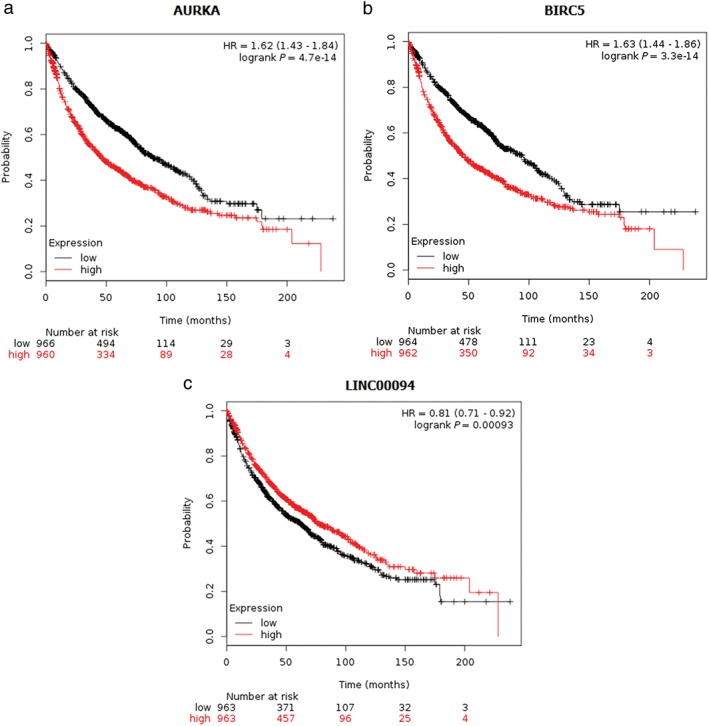
Kaplan–Meier plots for (a) AURKA, (b) BIRC5, and (c) LINC00094 in lung squamous cell carcinoma. Log‐rank P values and hazard ratios (HR, 95% confidence intervals in parentheses) are shown.
Figure 5.
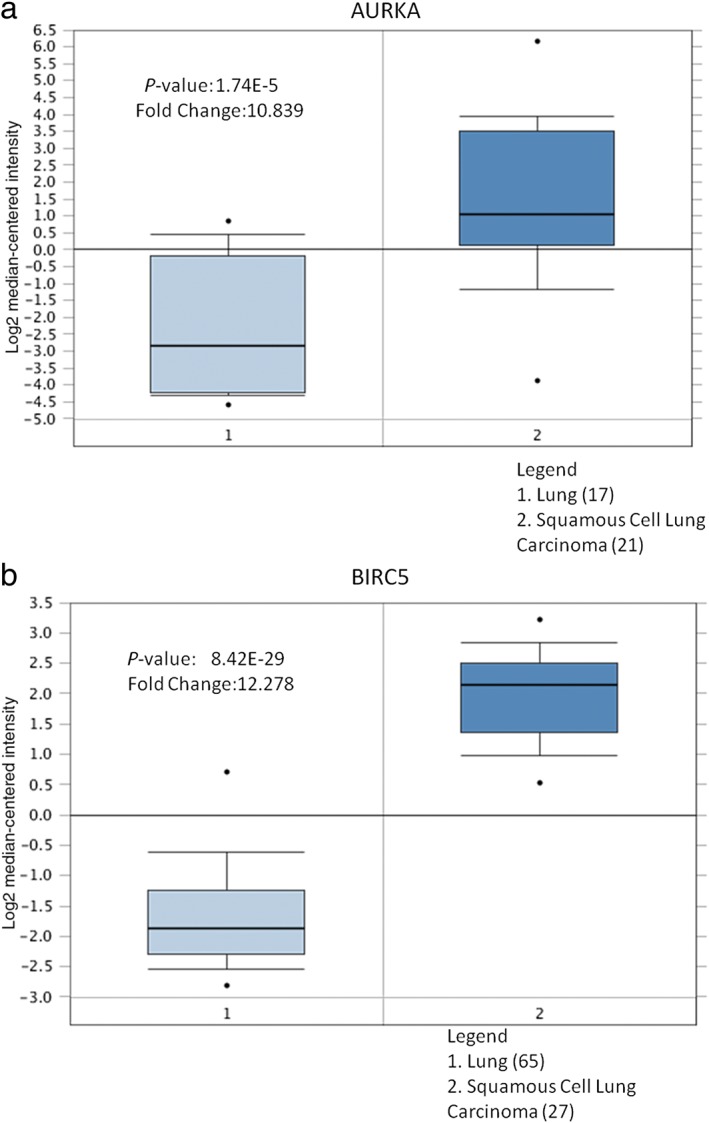
Figures were derived from gene expression data in the ONCOMINE database comparing expression levels in normal (left plot) and cancer tissues (right plot) in (a) AURKA and (b) BIRC5. The Y‐axis represents the median intensity, 10th, and 90th percentile data.
Further verification through qRT‐PCR
In order to verify our bioinformatic analyses, qRT‐PCR was performed to quantify the expression level of AURKA, BIRC5, and LINC00094 in primary tumor tissues of smoking lung SCC patients. As shown in Figure 6a,b, AURKA and BIRC5 were significantly upregulated and LINC00094 was downregulated in the lung SCC tumor samples compared to normal tissues (all P < 0.001, Fig 6c).
Figure 6.
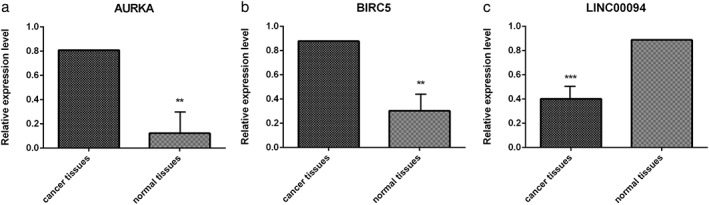
Verification of messenger RNA expression levels of differentially expressed genes and long noncoding RNA between lung squamous cell carcinoma and normal tissues through quantitative real‐time PCR. (a) AURKA, (b) BIRC5, (c) LINC00094. **P < 0.01; ***P < 0.001.
Hub gene‐related TFs
Using EpiTect ChIP qPCR Primers, we identified the TFs and binding sites of AURKA and BIRC5 for lung cancer associated key hub genes. The predicted TFs for AURKA are p53, NF‐kappaB and NF‐kappaB1. TFs of BIRC5 are p53, STAT3, NF‐kappaB, NF‐kappaB1, Egr‐1, HNF‐4alpha2, HNF‐4alpha1, Sp1, p300 and IRF‐1. The results are shown in Table 2 and Figure 7.
Table 2.
Genes and their corresponding transcription factors
| Gene | Transcription factor |
|---|---|
| AURKA | p53, NF‐kappaB, NF‐kappaB1 |
| BIRC5 | p53, STAT3, NF‐kappaB, NF‐kappaB1, Egr‐1, HNF‐4alpha2, HNF‐4alpha1, Sp1, p300, IRF‐1 |
Figure 7.
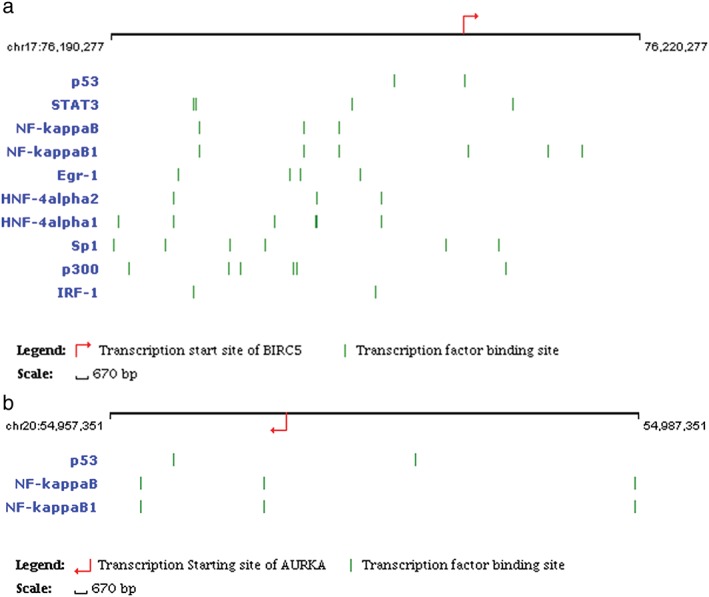
Transcription factors (TFs) and their hub gene binding sites. (a) TFs of BIRC5 are p53, STAT3, NF‐kappaB, NF‐kappaB1, Egr‐1, HNF‐4alpha2, HNF‐ 4alpha1, Sp1, p300, and IRF‐1. (b) TFs of AURKA are p53, NF‐kappaB, and NFkappaB1.
Discussion
Small cell lung cancer and SCC cells show the strongest association with cigarette smoking.20 Cigarette smoke is composed of a mixture of chemicals, which cause direct or indirect damage to respiratory epithelium and its genome.21 As a result, it is of paramount importance to characterize the genetic alterations and identify useful biomarkers predictive of survival and chemotherapy, which will help us understand the molecular mechanisms of smoking‐related lung cancer.
In this study, we compared gene expression profiles between lung cancer tissues from smoking patients and normal tissues (n = 60). A total of 598 DEGs were obtained in lung SCC tissues. To date, GO and KEGG pathway analyses are the most common and effective data mining tools used. Through KEGG and GO analyses, we discovered and revealed the various altered pathways in lung cancer patients. Our work may help to determine the molecular mechanisms of lung cancer. Functional GO enrichment showed that DEGs were enriched in the biological process of “regulation of transcription” and “cell adhesion,” which indicates a close association with cancer invasion, growth, and metastasis. Analysis revealed that many DEGs were enriched in cancer‐related pathways, such as PI3K‐Akt signaling, focal adhesion molecules, and p53 signaling pathways. This suggests that gene expression profiles were indeed different in smoking‐related cancer tissues. Seven key hub genes (MCM5, CDC6, RRM2, CCNB2, AURKA, BIRC5, and PIK3CA) were identified in our PPI network. Further evidence of their association with lung cancer was then supported by KEGG, GO, and survival analyses, which showed that AURKA and BIRC5 may be responsible for lung cancer.
Aurora kinase A is an enzyme encoded by the AURKA gene in humans, also known as threonine‐protein kinase 6.22 Aurora A belongs to the family of mitotic threonine kinases and is reported to perform important processes during mitosis and meiosis, the proper function of which is integral for healthy cell proliferation. Aurora A is motivated by various phosphorylations23 and activity reaches a peak during G2 to M phase transition in the process of a cell cycle.24 Aurora A is associated with a higher occurrence of cancer. Low expression of Aurora A can lead to cancer, as Aurora A is essential for the completion of cytokinesis. A previous study reported that smoking may contribute to oral cancer occurrence by modifying the AURKA level.25 Further study is needed to explore the mechanism by which smoking regulates AURKA expression in lung cancer. In this study, qRT‐PCR analyses confirmed the results of our bioinformatics analysis regarding AURKA. Once the cell begins mitosis and duplicates its DNA, it becomes aneuploid‐containing, with more chromosomes than normal cells, and cannot then separate into two different cells. Aneuploidy is a trait in a number of cancerous tumors.26 Generally, Aurora A expression levels are held back by the tumor suppressor, protein p53.
BIRC5, also named baculoviral inhibitor of apoptosis repeat‐containing 5 or survivin, is a protein encoded by the BIRC5 gene and is a member of the inhibitor of apoptosis family.27 BIRC5 can inhibit caspase activation, consequently leading to negative progress of apoptosis and programmed cell death. It has been proven that when BIRC5 is disrupted, apoptosis increases, leading to a decrease in tumor growth. Our qRT‐PCR results regarding BIRC5 were consistent with our previous study. The survivin protein is highly expressed in many human tumors and fetal tissue, but is rare in terminally differentiated cells.28 This data suggests that BIRC5 may become a new target for cancer therapy that could distinguish between cancer and normal cells. A recent study determined that BIRC5 was only expressed in the G2‐M phase and is also highly associated with the cell cycle.29 The study results also indicated that cigarette smoking influences nuclear BIRC5 expression in lung cancer at the early developmental stage.29 Another study showed that BIRC5 is a relevant and reproducible biomarker of severe rheumatoid arthritis and persistently high levels of BIRC5 are associated with smoking.30 The molecular mechanism of BIRC5 regulation is still not clear, but regulation seems to be related to p53 protein.31 This indicates that AURKA and BIRC5 are potential prognostic biomarkers of lung SCC, and may be involved in the p53 signal pathway. However, more work is required to clarify how smoking regulates AURKA and BIRC5 expression and eventually leads to lung cancer.
At present, high‐throughput transcriptomes are rapidly developing, and recent evidence shows that more than 90% of all mammalian genomes are positively transcribed; however less than 2% of the entire genome sequence contains protein‐coding genes.32 As various noncoding RNAs are transcribed from genomes, most studies focus on microRNAs and lncRNAs from transcribing genomes.33 Abnormal regulation of lncRNA has been found in some types of cancer, for instance, oral,34 gastric,35 and prostate cancers.36 Among these differentially expressed lncRNAs, a novel lncRNA, LINC00094, was discovered, which was obviously highly expressed in lung cancer tissues compared to normal tissues and could be a prognostic biomarker of lung cancer. Further in vitro studies are needed to discover the underlying molecular mechanism. To date, many functional lncRNAs have been characterized in the cancer process, many of which are associated with clinical prognosis or treatment.
Using EpiTect ChIP qPCR Primers, which has a text mining‐based function, we determined that three common TFs, namely p53, NF‐kappaB1, and NF‐kappaB, are associated with AURKA and BIRC5, and three common TFs, namely E2F, E2F‐1, and p53 are associated with RRM2 and CDC6. The E2F family plays an important role in the https://en.wikipedia.org/wiki/Cell_cycle process, acting as a https://en.wikipedia.org/wiki/Tumor_suppressor protein, and is associated with both cell proliferation and https://en.wikipedia.org/wiki/P53‐dependent https://en.wikipedia.org/wiki/Apoptosis.37 E2F promoter sites have been linked to transcriptional repression in resting cells and activation during the cell cycle.38 Further study showed that heavy‐ion irradiation could induce p53 cancer cell apoptosis through the E2F1 signal pathway. p53 is crucial in multicellular organisms, because it prevents cancer formation and consequently functions as a tumor suppressor.39 Equally, p53 has been named as “the guardian of the genome” as a result of its role in conserving stability and preventing genome mutation.40 Once we determine how to control TF function, we can then control expression of the identified genes, namely AURKA, BIRC5, RRM2, and CDC6 that lead to lung cancer. As these genes and their TFs may act as potential drug targets, investigation is worthy to further characterize the mechanisms of lung carcinoma.
To summarize, we performed data mining of a data set of 60 microarrays and found that a set of protein‐coding genes and lncRNAs was differentially expressed between lung cancer and normal tissues. Additionally, AURKA, BIRC5, and LINC00094 were significantly associated with lung cancer survival.
In conclusion, our study results indicate that AURKA, BIRC5, and LINC00094 expression may play an important role in diagnosis and prognosis and could be biomarkers or therapeutic targets for smoking‐related lung SCC.
Disclosure
No authors report any conflict of interest.
Supporting information
Table S1. List of primers designed for quantitative real‐time PCR verification.
Acknowledgment
The Department of Thoracic Surgery, Affiliated Hospital of Qingdao University supported this study.
Contributor Information
Jia Liu, Email: dadaliujia@qdu.edu.cn.
Wenjie Jiao, Email: xwkjiao@126.com.
References
- 1. Patel MI, Cheng I, Gomez SL. US lung cancer trends by histologic type. Cancer 2015; 121: 1150–2. [DOI] [PMC free article] [PubMed] [Google Scholar]
- 2. Chansky K, Detterbeck FC, Nicholson AG et al The IASLC lung cancer staging project: External validation of the revision of the TNM stage groupings in the eighth edition of the TNM classification of lung cancer. J Thorac Oncol 2017; 12: 1109–21. [DOI] [PubMed] [Google Scholar]
- 3. Torre LA, Siegel RL, Jemal A. Lung cancer statistics. Adv Exp Med Biol 2016; 893: 1–19. [DOI] [PubMed] [Google Scholar]
- 4. Egawa H, Furukawa K, Preston D et al Radiation and smoking effects on lung cancer incidence by histological types among atomic bomb survivors. Radiat Res 2012; 178: 191–201. [DOI] [PMC free article] [PubMed] [Google Scholar]
- 5. Liu Y, Ni R, Zhang H et al Identification of feature genes for smoking‐related lung adenocarcinoma based on gene expression profile data. Onco Targets Ther 2016; 9: 7397–407. [DOI] [PMC free article] [PubMed] [Google Scholar]
- 6. Wu Q, Shi Y, Ge L, Ma D, Zhang H, Wang J. Relationship of p73 gene polymorphism and additional gene‐smoking and gene‐obesity interaction with non‐small cell lung cancer risk. Oncotarget 2017; 8: 34423–8. [DOI] [PMC free article] [PubMed] [Google Scholar]
- 7. Zhang F, Chen X, Wei K et al Identification of key transcription factors associated with lung squamous cell carcinoma. Med Sci Monit 2017; 23: 172–206. [DOI] [PMC free article] [PubMed] [Google Scholar]
- 8. Hirsh V. New developments in the treatment of advanced squamous cell lung cancer: Focus on afatinib. Onco Targets Ther 2017; 10: 2513–26. [DOI] [PMC free article] [PubMed] [Google Scholar]
- 9. Khandelwal A, Bacolla A, Vasquez KM, Jain A. Long non‐coding RNA: A new paradigm for lung cancer. Mol Carcinog 2015; 54: 1235–51. [DOI] [PubMed] [Google Scholar]
- 10. Taft RJ, Pang KC, Mercer TR, Dinger M, Mattick JS. Non‐coding RNAs: Regulators of disease. J Pathol 2010; 220: 126–39. [DOI] [PubMed] [Google Scholar]
- 11. Der SD, Sykes J, Pintilie M et al Validation of a histology‐independent prognostic gene signature for early‐stage, non‐small‐cell lung cancer including stage IA patients. J Thorac Oncol 2014; 9: 59–64. [DOI] [PubMed] [Google Scholar]
- 12. Tantai JC, Pan XF, Zhao H. Network analysis of differentially expressed genes reveals key genes in small cell lung cancer. Eur Rev Med Pharmacol Sci 2015; 19: 1364–72. [PubMed] [Google Scholar]
- 13. Barrett T, Edgar R. Mining microarray data at NCBI's Gene Expression Omnibus (GEO)*. Methods Mol Biol 2006; 338: 175–90. [DOI] [PMC free article] [PubMed] [Google Scholar]
- 14. Harbig J, Sprinkle R, Enkemann SA. A sequence‐based identification of the genes detected by probesets on the Affymetrix U133 plus 2.0 array. Nucleic Acids Res 2005; 33: e31. [DOI] [PMC free article] [PubMed] [Google Scholar]
- 15. Wettenhall JM, Simpson KM, Satterley K, Smyth GK. affylmGUI: A graphical user interface for linear modeling of single channel microarray data. Bioinformatics 2006; 22: 897–9. [DOI] [PubMed] [Google Scholar]
- 16. Dennis G Jr, Sherman BT, Hosack DA et al DAVID: Database for annotation, visualization, and integrated discovery. Genome Biol 2003; 4 (5): P3. [PubMed] [Google Scholar]
- 17. Han L, Suzek TO , Wang Y, Bryant SH. The text‐mining based PubChem Bioassay neighboring analysis. BMC Bioinformatics 2010; 11: 549. [DOI] [PMC free article] [PubMed] [Google Scholar]
- 18. Győrffy B, Surowiak P, Budczies J, Lánczky A. Online survival analysis software to assess the prognostic value of biomarkers using transcriptomic data in non‐small‐cell lung cancer. PLoS ONE 2013; 8: e82241. [DOI] [PMC free article] [PubMed] [Google Scholar]
- 19. Rhodes DR, Yu J, Shanker K et al ONCOMINE: A cancer microarray database and integrated data‐mining platform. Neoplasia 2004; 6: 1–6. [DOI] [PMC free article] [PubMed] [Google Scholar]
- 20. de Groot P, Munden RF. Lung cancer epidemiology, risk factors, and prevention. Radiol Clin North Am 2012; 50: 863–76. [DOI] [PubMed] [Google Scholar]
- 21. Alavanja MC. Biologic damage resulting from exposure to tobacco smoke and from radon: Implication for preventive interventions. Oncogene 2002; 21: 7365–75. [DOI] [PubMed] [Google Scholar]
- 22. Zhou H, Kuang J, Zhong L et al Tumour amplified kinase STK15/BTAK induces centrosome amplification, aneuploidy and transformation. Nat Genet 1998; 20: 189–93. [DOI] [PubMed] [Google Scholar]
- 23. Gottardo M, Callaini G, Riparbelli MG. Aurora A inhibition by MNL8054 promotes centriole elongation during Drosophila male meiosis. Cell Cycle 2015; 14: 2844–52. [DOI] [PMC free article] [PubMed] [Google Scholar]
- 24. Hannak E, Kirkham M, Hyman AA, Oegema K. Aurora‐A kinase is required for centrosome maturation in Caenorhabditis elegans. J Cell Biol 2001; 155: 1109–16. [DOI] [PMC free article] [PubMed] [Google Scholar]
- 25. Lee CP, Chiang SL, Lee CH et al AURKA Phe31Ile polymorphism interacted with use of alcohol, betel quid, and cigarettes at multiplicative risk of oral cancer occurrence. Clin Oral Investig 2015; 19: 1825–32. [DOI] [PubMed] [Google Scholar]
- 26. Marumoto T, Honda S, Hara T et al Aurora‐A kinase maintains the fidelity of early and late mitotic events in HeLa cells. J Biol Chem 2003; 278: 51786–95. [DOI] [PubMed] [Google Scholar]
- 27. Yan M, Wang C, He B et al Aurora‐A kinase: A potent oncogene and target for cancer therapy. Med Res Rev 2016; 36: 1036–79. [DOI] [PubMed] [Google Scholar]
- 28. Sah NK, Khan Z, Khan GJ, Bisen PS. Structural, functional and therapeutic biology of survivin. Cancer Lett 2006; 244: 164–71. [DOI] [PubMed] [Google Scholar]
- 29. Hirano H, Maeda H, Takeuchi Y et al Association of cigarette smoking with the expression of nuclear survivin in pathological stage IA lung adenocarcinomas. Med Mol Morphol 2014; 47: 196–200. [DOI] [PubMed] [Google Scholar]
- 30. Svensson B, Hafström I, Erlandsson MC, Forslind K, Bokarewa MI. Smoking in combination with antibodies to cyclic citrullinated peptides is associated with persistently high levels of survivin in early rheumatoid arthritis: A prospective cohort study. Arthritis Res Ther 2014; 16: R12. [DOI] [PMC free article] [PubMed] [Google Scholar]
- 31. Mirza A, McGuirk M, Hockenberry TN et al Human survivin is negatively regulated by wild‐type p53 and participates in p53‐dependent apoptotic pathway. Oncogene 2002; 21: 2613–22. [DOI] [PubMed] [Google Scholar]
- 32. Wilusz JE, Sunwoo H, Spector DL. Long noncoding RNAs: Functional surprises from the RNA world. Genes Dev 2009; 23: 1494–504. [DOI] [PMC free article] [PubMed] [Google Scholar]
- 33. Gupta RA, Shah N, Wang KC et al Long non‐coding RNA HOTAIR reprograms chromatin state to promote cancer metastasis. Nature 2010; 464: 1071–6. [DOI] [PMC free article] [PubMed] [Google Scholar]
- 34. Shen L, Liu W, Cui J, Li J, Li C. Analysis of long non‐coding RNA expression profiles in ovarian cancer. Oncol Lett 2017; 14: 1526–30. [DOI] [PMC free article] [PubMed] [Google Scholar]
- 35. Hu QY, Zhao ZY, Li SQ, Li L, Li GK. A meta‐analysis: The diagnostic values of long non‐coding RNA as a biomarker for gastric cancer. Mol Clin Oncol 2017; 6: 846–52. [DOI] [PMC free article] [PubMed] [Google Scholar]
- 36. Zhao R, Sun F, Bei X et al Upregulation of the long non‐coding RNA FALEC promotes proliferation and migration of prostate cancer cell lines and predicts prognosis of PCa patients. Prostate 2017; 77: 1107–17. [DOI] [PubMed] [Google Scholar]
- 37. Xie Y, Si J, Wang YP et al E2F is involved in Radioresistance of carbon ion induced apoptosis via Bax/caspase 3 signal pathway in human hepatoma cell. J Cell Physiol 2017. https://doi.org/10.1002/jcp.26005 [DOI] [PubMed] [Google Scholar]
- 38. Fischer M, Müller GA. Cell cycle transcription control: DREAM/MuvB and RB‐E2F complexes. Crit Rev Biochem Mol Biol 2017. https://doi.org/10.1080/10409238.2017.1360836 [DOI] [PubMed] [Google Scholar]
- 39. Surget S, Khoury MP, Bourdon JC. Uncovering the role of p53 splice variants in human malignancy: A clinical perspective. Onco Targets Ther 2013; 7: 57–68. [DOI] [PMC free article] [PubMed] [Google Scholar]
- 40. Nguyen D, Liao W, Zeng SX, Lu H. Reviving the guardian of the genome: Small molecule activators of p53. Pharmacol Ther 2017; 178: 92–108. [DOI] [PMC free article] [PubMed] [Google Scholar]
Associated Data
This section collects any data citations, data availability statements, or supplementary materials included in this article.
Supplementary Materials
Table S1. List of primers designed for quantitative real‐time PCR verification.