

Abstract
High-protein diet (HPD) curtails obesity and/or fat mass, but it is unknown whether it reverses neuroinflammation or alters glucose levels, CCK sensitivity, and gut microbiome in rats fed a Western diet (WD)-induced obesity (DIO). Male rats fed a WD (high fat and sugar) for 12 wk were switched to a HPD for 6 wk. Body composition, food intake, meal pattern, sensitivity to intraperitoneal CCK-8S, blood glucose, brain signaling, and cecal microbiota were assessed. When compared with a normal diet, WD increased body weight (9.3%) and fat mass (73.4%). CCK-8S (1.8 or 5.2 nmol/kg) did not alter food intake and meal pattern in DIO rats. Switching to a HPD for 6 wk reduced fat mass (15.7%) with a nonsignificantly reduced body weight gain, normalized blood glucose, and decreased feeding after CCK-8S. DIO rats on the WD or switched to a HPD showed comparable microbial diversity. However, in HPD versus WD rats, there was enrichment of 114 operational taxonomic units (OTUs) and depletion of 188 OTUs. Of those, Akkermansia muciniphila (enriched on a HPD), an unclassified Clostridiales, a member of the RF39 order, and a Phascolarctobacterium were significantly associated with fat mass. The WD increased cytokine expression in the hypothalamus and dorsal medulla that was unchanged by switching to HPD. These data indicate that HPD reduces body fat and restores glucose homeostasis and CCK sensitivity, while not modifying brain inflammation. In addition, expansion of cecal Akkermansia muciniphila correlated to fat mass loss may represent a potential peripheral mechanism of HPD beneficial effects.
Keywords: body composition, blood glucose, gut microbiota, high-fat diet, meal pattern
clinical studies in obese subjects indicate that a high-protein diet (HPD) is effective in promoting fat mass loss while maintaining muscle mass compared with low-carbohydrate, low-fat diets (18, 30, 42). However, there is inconsistency in the literature about the long-term effect of a high-protein diet on weight loss and cardiovascular and metabolic risk (49). In experimental animals, a diet composed of high fat and high sugar is considered to represent a Western-style diet (WD) and induces obesity (DIO) in rodents closely resembling the polygenic nature and pathological features of human obesity (24). We recently reported that rats fed a WD and then switched to a high-protein diet for 2 wk had reduced body weight and fat mass with preserved lean body mass (53). This was associated with an improved glucose tolerance compared with the DIO rats switched to a normal diet (53).
High-fat diet (HFD)-induced obesity (DIO) in rodents has been extensively used to gain insight into the pathophysiological processes of obesity and to develop polymechanistic therapeutic antiobesity strategies targeting these mechanisms (24). Rodents on a HFD have been shown to have decreased sensitivity to the vagally mediated satiety action of peripheral CCK (16, 17). Moreover, the composition of the gut microbiome shifts with obesity, including in DIO rodents (60) and obese humans (32, 61). Recent studies showed that changes in the composition of gut microbiota, particularly Akkermansia, influence metabolic inflammation and metabolism in rodents (45, 76).
A HFD also induces alterations in the brain. In particular, neuroinflammation occurs in the hypothalamus of DIO rodents, as shown by the increased expression of cytokines and other inflammatory mediators that impact metabolic function (64). The hypothalamus and dorsal medulla are both involved in regulating energy intake, digestion, and metabolism (46, 70) and display altered levels of metabolic regulatory hormones, neuropeptides, and receptors under obese conditions (46). There is evidence that HPD activates satiety-related signaling in normal rodents (20, 27), but it is unknown whether chronic HPD reverses alterations that have taken place in the brain of DIO rats. Such knowledge may provide insight into potential mechanisms contributing to the reported beneficial effects of a HPD in clinical and experimental settings.
In the present study, we assessed the effects of switching DIO rats to a HPD for 6 wk instead of 2 wk as in our previous studies to investigate metabolic, microbial, brain, and inflammatory factors potentially contributing to the loss of fat mass with preservation of lean mass on a HPD (53). We first established the influence of a HPD on body weight, visceral vs. brown fat, food intake, and blood glucose. We then examined whether peripheral changes induced by HPD were associated with the normalization of DIO-induced alterations of peripheral and brain mechanisms regulating these functions. Namely, we investigated the sensitivity to peripheral CCK-induced satiety (16, 17) of DIO rats switched to a HPD compared with rats maintained on WD. This was assessed by monitoring changes in meal structures with an automated rat feeding monitoring system (22). We also examined alterations in the cecal microbiota using high-throughput 16S ribosomal RNA taxonomic profiling in rats maintained on WD or switched to the HPD compared with ND. We focused on the cecum as the fermentation occurs mainly in the hindgut, and previous animal studies investigating diet-induced alterations of gut microbiota identified changes in the cecal microbiome (34, 47). Lastly, we assessed the effects of WD on gene expression of regulatory metabolic signals and inflammatory markers in the hypothalamus and dorsal medulla and whether switching to a HPD influenced these changes.
METHODS
Animals.
Adult male Sprague-Dawley rats (Harlan Laboratories, San Diego, CA) weighing 200–225 g were housed two per cage under controlled conditions of temperature (22 ± 2°C) and lighting (from 6:00 AM to 6:00 PM). Rats had access ad libitum to rodent diets and tap water. Animal care and experimental procedures followed institutional ethical guidelines and the requirements of the federal authority for animal research conduct. All experiments were approved by the Animal Research Committee at Veterans Affairs Greater Los Angeles Healthcare System (protocol number 11047–09).
Diets and feeding protocols.
The following diets (Research Diets, New Brunswick, NJ) were used and had similar composition as in our previous report (53): WD [4.7 kcal/g, 20% from protein, 45% from fat (lard 39%, soy bean oil 6%), and 35% from carbohydrates (50% from sucrose)] and HPD [3.8 kcal/g, 52% from protein (casein), 9% from fat, and 39% from carbohydrates]. Diets were stored at 4°C until used. Rats were fed the WD for 10–12 wk, and then half of them were switched to the HPD, and the other half remained on the WD for 6 wk. Control rats were fed a normal diet (ND) (3.0 kcal/g, 15% from protein, 9% from fat, and 76% from carbohydrates; Prolab RMH 2500 LabDiet, PMI Nutritional, Brentwood, MO). Experiments were performed on two cohorts (58 rats in total): 17 on the ND and 41 on the WD, of those on WD, 25 were switched later to the HPD. DIO in rats on the WD was defined as having a greater than 50% increase in body fat mass compared with the mean fat mass of rats on the ND. Eight DIO and eight ND rats from the first cohort were used for the meal pattern measurement after 10 wk on the WD (Fig. 1A). The second cohort of rats on the WD (18 out of 21 gained >50% of fat mass compared with rats on ND) was monitored weekly for body weight and composition before and after switching from the WD to HPD. They were euthanized 6 wk later to assess visceral fat mass, cecal microbiome, and brain inflammatory and homeostatic signals (Fig. 1B).
Fig. 1.

Schematic representation of experimental protocols in rats on a Western diet (WD), switched to a high-protein diet (HPD) compared with a normal chow diet (ND). A: feeding behavior monitoring, meal pattern and CCK testing. B: measurements of body composition, blood glucose, cecal microbiota, and brain signals.
Body weight and composition measurements.
Body weight and composition were assessed in rats fed ND and WD before and weekly after switching from the WD to HPD or maintained on the same diet (ND or WD) for 6 wk (Fig. 1B). Body composition was measured using a rodent MRI body composition analyzer (EchoMRI 700, EchoMedical Systems, Houston, TX), as previously described (53). Body weight and changes in fat and lean mass were calculated relative to values before the dietary switch.
Feeding monitoring and meal pattern analysis.
The microstructure analysis of feeding behavior was conducted using the rat BioDAQ episodic food intake monitor (BioDAQ, Research Diets, New Brunswick, NJ), as detailed in our previous rat studies (22). DIO rats were placed in the BioDAQ system after 10 wk on the WD, and age-matched rats fed the ND were placed in the BioDAQ system as controls (Fig. 1A). DIO and control animals were acclimated for 2 wk to single housing in a cage containing an enrichment device (red polycarbonate tube) and to learn how to access the food from a front feeding hopper. Then basal 24-h food intake and meal pattern of WD rats were assessed, as well as at 6 wk after switching to the HPD (Fig. 1A). Water was provided ad libitum from a regular water bottle. Food intake and feeding behavior were monitored continuously second by second by the BioDAQ system, which weighs (±0.01 g) the hopper containing the food and algorithmically detects “not eating” as weight stable and “eating” as weight unstable. Feeding bouts (changes in stable weight before and after a bout) are recorded with a start time, duration, and amount consumed. Meals consisted of one or more bouts separated by an intermeal interval. The intermeal interval and minimum meal amount are user-definable. We defined the intermeal interval of 15 min and minimum meal amount of 0.1 g (22). Thus, food intake was considered as one meal when the feeding bouts occurred within 15 min of the previous feeding, and their sum was equal to or greater than 0.1 g. Bouts of feeding longer than 15 min apart were considered a new meal. Meal structures included the number of meals (meal frequency), meal size, meal duration, intermeal interval (time difference between the end of one meal and the initiation of the next meal), and total time spent eating. These parameters were calculated by the software provided by the manufacturer (BioDAQ Monitoring Software 2.3.02). The satiety ratio was determined as the intermeal interval divided by the meal size. Since rats are nocturnal animals, food intake and meal structures were analyzed separately in dark and light phases in addition to daily feeding measurements.
Water intake.
Water intake was measured manually every day in groups maintained on a WD or switched to a HPD for 2–3 wk and then weekly until the end of the 6-wk period. Total water intake was calculated by subtracting the weights of the bottle before and after a 24-h period and divided by days when assessed weekly.
Blood glucose levels.
Because rodents are nocturnal animals, the blood glucose was assessed 1–2 h before the dark phase in rats on WD switched to HPD for 6 wk compared with rats maintained on WD or ND. Blood was obtained by a tail prick, and blood glucose was determined using One-Touch Ultra glucometer and standard glucose test strips (LifeScan, Milpitas, CA).
CCK-8S test.
Experiments were performed in DIO rats acclimated to the feeding monitoring system (BioDAQ). CCK-8S treatment by a crossover design with a 5-day-interval was started 2 wk after the rats were placed individually in the BioDAQ cages. The same rats were switched to the HPD for 6 wk and then tested again for the CCK-8S effect (Fig. 1A). The assessment of food intake and meal structures was performed during the first hour of the dark phase with the feeding hopper gates being closed for 90 min before the dark phase to synchronize feeding in rats. Sterile saline or CCK-8S (sulfated form; Sigma-Aldrich, St. Louis, MO) at 1.8 and 5.2 nmol/kg (~2 and 6 µg/kg, dissolved in sterile saline) was injected intraperitoneally (1 ml/kg ip) just before the dark phase that is associated with nocturnal eating. The regimen of CCK-8 administration was based on our previous study on CCK influence on feeding, in which rats were placed under the same monitoring conditions (22).
Tissue and cecal content collection.
Groups of rats of the same age on ND, WD, or WD switched to HPD for 6 wk (Fig. 1B), were euthanized by isoflurane overdose followed by thoracotomy between 1 and 3 h before the dark phase. We selected this time period before the dark phase to reflect “basal” conditions before nocturnal eating and took into account that some rats start eating a couple of hours before the light is turned off. The mesenteric, epididymal, and interscapular brown adipose tissues were removed and weighed. The cecal content, dorsal medulla, and hypothalamus were collected from the second cohort of rats fed the ND for 18 wk or the WD for 12 wk then switched to the HPD or kept on the WD 6 wk (Fig. 1B), immediately frozen on dry ice and stored in a deep freezer at −80°C until RNA isolation. The dissection of the hypothalamus and dorsal medulla was performed by placing the brain in a cryostat at −18°C for 20–30 min, and then, the hypothalamus was trimmed using the following landmarks and coordinates from Paxinos and Watson’s brain atlas (43): coronally, the middle of the optical chiasm and posterior the median eminence (approximately from −0.5 to −3.6 mm from the bregma), sagittally, left and right side lateral to the optic tract (~2.5 mm from the midline), and dorsally: the anterior commissure. The dorsal medulla was dissected out by cuttings at ~1 mm rostral and 1 mm caudal to the area postrema (approximately from −13.5 to −15 mm from the bregma), and ~2 mm ventral to the bottom of the 4th ventricle, and 2 mm lateral on each side.
16S ribosomal RNA sequencing.
Genomic DNA was extracted from cecal content using the Powersoil kit, as per the manufacturer’s instructions (MO BIO, Carlsbad, CA). The V4 region of 16S ribosomal RNA genes was amplified and underwent paired end sequencing on an Illumina MiSeq using the 2 × 150 bp v2 kit, as previously described (58). The 253 base pair reads were processed using QIIME v1.9.1 with default parameters (4). Sequence depth ranged from 45,741 to 125,159 sequences per sample. Operational taxonomic units (OTUs) were picked against the May 2013 version of the Greengenes database, prefiltered at 97% identity. OTUs were removed if they were present in less than three samples. α-Diversity (i.e., bacterial diversity within a sample) and β-diversity (differences in composition across samples) were calculated in QIIME version 1.9.1 using OTU-level data rarefied to 45,704 sequences. α-Diversity metrics included Faith’s phylogenetic diversity metric, Chao1, and Shannon index. The significance of differences in α-diversity was calculated using the Mann-Whitney U-test. β-Diversity was calculated using unweighted UniFrac and was visualized by principal coordinate analysis. Adonis, a permutational ANOVA, was performed using 100,000 permutations to test for differences in β-diversity across the dietary groups (2). The metagenomic content of samples was inferred from 16S sequence data using PICRUSt 1.0 and the KEGG database, which includes 6,909 metagenes grouped into 214 metagenomic pathways (29).
Quantitative real-time PCR.
The hypothalamus and dorsal medulla samples were homogenized, and total RNA was extracted using TRIzol (Invitrogen, Carlsbad, CA) following the manufacturerʼs recommended protocol. First-strand oligo-dT primed cDNA was synthesized from total RNA of each sample using the ThermoScript RT-PCR system (Invitrogen). The transcripts of inflammatory factors, neurotransmitters, and receptors were determined in duplicates using StepOnePlus real-time PCR System (Applied Biosystems, Waltham, MA) in a 25-μl reaction volume. The optimized reaction contained 12.5 μl of SYBR Premix Ex Taq (Perfect Real Time, Takara Mirus Bio, Madison, WI), 0.5 μl of oligonucleotide primers (10 μM), 1 μl of the cDNA synthesis reaction, and 10.5 μl of H2O. Table 1 lists the selected forward and reverse primers. The house-keeping gene, rat GAPDH was also analyzed as an internal control. Thermal conditions were as follows: 95°C for 4 min followed by 40 cycles of 95°C for 10 s, 57°C for 10 s; and 72°C for 20 s with a final extension cycle of 10 min at 72°C. The specificity of the amplification reaction was determined by performing a melting curve analysis of the PCR fragments. Data were quantified using the comparative cycle threshold (Ct) method. For each sample, Ct was normalized to GAPDH, and a final value of 2−ΔΔCt was adjusted so that the control had a mean relative mRNA level of 1, as previously described (73).
Table 1.
Sequences of the primers used for real-time RT-PCR
| Name | Sequence (5′-3′) | Product Length, bp | Accession Number |
|---|---|---|---|
| CCK1R | Forward: CCACCTACTTCATGGGCACT | 290 | NM_012688.3 |
| Reverse: CAGGAATGTTTGCCAGGACT | |||
| CCL2 | Forward: CCACCTACTTCATGGGCACT | 167 | NM_031530.1 |
| Reverse: CAGGAATGTTTGCCAGGACT | |||
| CRF | Forward: TCTCTCTGGATCTCACCTTCCACC | 77 | X03036 |
| Reverse: AGCTTGCTGAGCTAACTGCTCTGC | |||
| GAPDH | Forward: GACAACTTTGGCATCGTGGA | 133 | NM_017008 |
| Reverse: ATGCAGGGATGATGTTCTGG | |||
| GHS-R1a | Forward: CTCATCGGGAGGAAGCTATG | 216 | U94321 |
| Reverse: CAGGTTGCAGTACTGGCTGA | |||
| GLP-1R | Forward: CGAGCACTGTCCGTCTTCAT | 164 | NM_012728.1 |
| Reverse: AACCAGTAGTAGTTGGCCGC | |||
| IL-10 | Forward: CCTGCTCTTACTGGCTGGAG | 161 | NM_012854.2 |
| Reverse: TGTCCAGCTGGTCCTTCTTT | |||
| IL-6 | Forward: CCGGAGAGGAGACTTCACAG | 134 | NM_012589.2 |
| Reverse: CAGAATTGCCATTGCACAAC | |||
| IRa | Forward: ATGCCACCAATCCTTCCGTT | 268 | NM_017071.2 |
| Reverse: CTGGCCGAGTCGTCATACTC | |||
| LepR | Forward: CTGGGTTTGCGTATGGAAGT | 217 | NM_012596.1 |
| Reverse: CCAGTCTCTTGCTCCTCACC | |||
| mTOR | Forward: CCACCTACTTCATGGGCACT | 264 | NM_019906.1 |
| Reverse: CAGGAATGTTTGCCAGGACT | |||
| POMC | Forward: TCCATAGACGTGTGGAGCTG | 174 | AF510391.1 |
| Reverse: GACGTACTTCCGGGGATTTT | |||
| TNF-α | Forward: TGCCTCAGCCTCTTCTCATT | 108 | X66539.1 |
| Reverse: CCCATTTGGGAACTTCTCCT | |||
| TNF-β | Forward: TGAGTGGCTGTCTTTTGACG | 146 | NM_021578.2 |
| Reverse: TGGGACTGATCCCATTGATT |
CCL2, C-C motif chemokine ligand 2; CRF, corticotropin-releasing factor; GAPDH, glyceraldehyde-3-phosphate dehydrogenase; GHS-R1a, growth hormone secretagogue receptor 1a; GLP-1, glucagon-like peptide receptor 1; IL, interleukin; IRa, insulin receptor A; LepR, leptin receptor; mTOR, mammalian target of rapamycin; POMC, proopiomelanocortin; TGF-β, transforming growth factor-β; TNF-α: tumor necrosis factor-α.
Statistical analysis.
Data were analyzed by one-way ANOVA followed by Tukey post hoc tests. Body and fat weight changes in HPD and WD groups were analyzed by repeated measurement of one-way ANOVA. Data are expressed as means ± SE. P < 0.05 was considered significant. Association of microbial genera, OTUs, and predicted metagenes with dietary groups was evaluated using DESeq2 in R, which employs an empirical Bayesian approach to shrink dispersion and fit nonrarified count data to a negative binomial model (35). Unrarefied 16S rRNA count data were fitted to multivariate models with dietary group as a predictor. P values for differential abundance were converted to q values to correct for multiple hypothesis testing (<0.05 for significance) (54). DESeq2 models were also run with fat mass as a covariate in addition to dietary group to identify taxa associated with fat loss. Selected metagenes associated with the HPD were further analyzed with FishTaco (36). This method uses a permutation approach and Shapley value analysis to quantitate the contribution of individual taxa to shifts in metagene abundance between two clusters.
RESULTS
Western-style diet induces larger body fat mass than body weight gain and switching to HPD reduces fat mass.
Rats on the WD for 18 wk had a significant 85.4% higher body fat mass and 12% higher body weight than rats on the ND, while the lean mass and body water content were not significantly modified (Fig. 2, A–D). Rats switched from the WD to the HPD for 6 wk had 28.6% less body fat mass than those remaining on the WD, and 15.7% less than their own body fat before HPD switching (Fig. 2B, P < 0.05). The body weight was still significantly higher than that of rats on the ND and did not reach statistical significance from the WD group (Fig. 2A). The differences in fat mass and body weight between the WD and WD-HPD groups were 20.8 g (P < 0.05) and 20.4 g (P > 0.05), respectively, while lean mass and water content were unchanged (Fig. 2, A–D), indicating that the weight loss was mainly related to the decrease in fat mass. The fat mass loss induced by HPD reached its nadir at 4 wk after the dietary switch and remained at similar values in the subsequent 2 wk (Fig. 2F). However, the body weight was significantly inhibited only 1 wk after the dietary switch, and thereafter, the HPD rats gained weight at a parallel rate as WD rats (Fig. 2E). The lean mass was increased similarly in both WD and HPD groups (Fig. 2, G and H).
Fig. 2.

Body weight and composition of male rats on a WD for 12 wk and either switched to a HPD (WD-HPD) or remaining on a WD compared with controls fed a ND. A–D: six weeks after the HPD switch. E–H: weekly body weight and composition. Data are means ± SE. Rats per group are indicated at the bottom of each bar. *P < 0.05 vs. ND and #P < 0.05 vs. WD (one-way ANOVA or t-test).
The epididymal adipose tissue weight in DIO rats was significantly increased compared with ND group (8.7 ± 0.6 vs. 4.5 ± 0.2 g, respectively) and decreased to 6.8 ± 0.3 g in rats switched to the HPD (P < 0.05 vs. DIO), and values were still significantly higher than those of ND (Fig. 3A). A similar increase was found in the mesenteric adipose tissue in WD and WD-HPD groups compared with ND (4.7 ± 0.5 and 3.3 ± 0.4 g, respectively vs. 2.1 ± 0.2, P < 0.05, Fig. 3B). By contrast, the weights of brown adipose tissue did not differ among the three dietary groups (Fig. 3C).
Fig. 3.

Weights of adipose tissues in male rats on a WD for 12 wk and either switched to a HPD (WD-HPD) for 6 wk or remaining on WD compared with controls fed a ND. Epididymal (A), mesenteric (B), and brown adipose tissue (C). Data are means ± SE of 8–11 rats/group are indicated at the bottom of each bar in A. *P < 0.05 vs. ND and #P < 0.05 vs. WD (one-way ANOVA).
HPD modifies WD-altered meal pattern and water intake in DIO rats.
After rats were switched from the WD to a HPD, daily caloric intake was only reduced on the first day and then equalized between the two groups (data not shown). Rats on the ND or maintained on WD for 18 wk, and rats on WD for 12 wk and then 6 wk on HPD ingested similar calories per day (62.5 ± 2.5, 60.3 ± 4.2, and 60.1 ± 1.4 kcal, respectively, Table 2). WD significantly increased the average meal size, but reduced the bouts, meal frequency, and time spent on meals, while the meal rate, meal duration and intermeal interval were not modified compared with ND, as monitored during a 24-h period. Separate analysis during the dark and light phases showed a similar meal pattern, except that there was an increase in meal rate and a prolonged intermeal interval in the dark phase in the WD group. The satiety ratios over 24 h and during the dark phase did not differ among the three diet groups. The light-phase intermeal interval and satiety ratio cannot be calculated during the daytime due to the near absence of meal (0–1 meal). Switching to the HPD for 6 wk reversed the WD-induced increased meal size and the rate of each meal, and decreased bouts and total time spent on meals. HPD also increased meal duration during 24 h, but did not alter the WD-induced increase in calories per meal during the light phase (Table 2).
Table 2.
Meal patterns (24 h and during dark and light phase) of DIO rats on WD and switched to HPD (WD-HPD) 6 wk compared with normal rats on ND
| 24 h |
Dark Phase |
Light Phase |
|||||||
|---|---|---|---|---|---|---|---|---|---|
| Normal rats |
DIO rats |
Normal rats |
DIO rats |
Normal rats |
DIO rats |
||||
| ND | WD | WD-HPD | ND | WD | WD-HPD | ND | WD | WD-HPD | |
| Food intake, kcal | 62.5 ± 2.5 | 60.3 ± 4.2 | 60.1 ± 1.4 | 51.8 ± 3.7 | 54.2 ± 2.9 | 50.9 ± 2.9 | 10.4 ± 2.1 | 6.3 ± 3.4 | 9.3 ± 2.8 |
| Bouts, number | 99.6 ± 5.2 | 47.3 ± 5.4* | 68.1 ± 5.9*# | 80.4 ± 6.0 | 42.8 ± 5.0* | 55.0 ± 5.0* | 19.3 ± 2.3 | 4.5 ± 1.4* | 13.1 ± 2.1# |
| Meal frequency, number | 8.0 ± 0.5 | 4.8 ± 0.5* | 7.5 ± 0.6# | 6.1 ± 0.6 | 4.0 ± 0.3* | 6.1 ± 0.5# | 1.9 ± 0.3 | 0.8 ± 0.3* | 1.4 ± 0.4 |
| Meal size, kcal/meal | 8.0 ± 0.4 | 13.2 ± 0.8* | 8.4 ± 0.7# | 8.7 ± 0.6 | 13.8 ± 0.9* | 8.6 ± 0.8# | 6.2 ± 1.0 | 3.6 ± 1.7* | 5.9 ± 1.2# |
| Meal rate, kcal/min | 0.8 ± 0.1 | 0.8 ± 0.1 | 0.3 ± 0.1# | 0.4 ± 0.0 | 0.8 ± 0.1* | 0.3 ± 0.1# | 0.4 ± 0.1 | 1.2 ± 0.3* | 0.5 ± 0.1# |
| Meal duration, min | 11.1 ± 0.7 | 17.3 ± 2.6 | 26.4 ± 2.6* | 21.8 ± 2.2 | 19.3 ± 2.6 | 28.5 ± 3.0# | 17.5 ± 2.7 | 5.5 ± 1.1* | 17.3 ± 2.8# |
| Total meal time, min | 160.5 ± 10.3 | 82.5 ± 13.3* | 195.4 ± 20.1# | 128.4 ± 10.5 | 77.9 ± 12.5* | 168.8 ± 15.7# | 32.1 ± 6.7 | 4.5 ± 2.3 | 26.5 ± 10.1 |
| Latency to 1st meal, min | 25.6 ± 7.7 | 21.6 ± 5.4 | 9.6 ± 4.3 | ||||||
| Intermeal interval, min | 179.2 ± 11.4 | 221.4 ± 33.4 | 177.9 ± 20.6 | 92.5 ± 6.7 | 156.8 ± 11.3* | 85.1 ± 6.6# | |||
| Satiety ratio, min/kcal | 23.0 ± 2.0 | 17.6 ± 2.8 | 21.5 ± 3.3 | 10.6 ± 0.5 | 11.4 ± 0.6 | 10.0 ± 0.4 | |||
Data are means ± SE. One-way ANOVA was performed for each indicated time period, n = 8/group. DIO, diet-induced obesity; ND, normal diet; WD, Western diet; HPD, high-protein diet.
P < 0.05 vs. ND.
P < 0.05 vs. WD.
Water intake was significantly lower in rats on the WD than the ND (16.3 ± 1.7 vs. 25.5 ± 1.1 ml/day, P < 0.05), whereas those switched to the HPD drank a similar amount as rats on the ND (26.1 ± 1.1 ml/day, means of 7 days at the 6th week after switching to HPD).
HPD improves sensitivity to intraperitoneal CCK-8S.
In DIO rats remaining on the WD, reduction in food intake and alterations in meal pattern after intraperitoneal injection of CCK-8S (1.8 and 5.2 nmol/kg) did not reach significance when analyzed either for the first hour of dark phase (data not shown) or the first meal (Fig. 4, A and B) postinjection. In DIO rats switched to the HPD, CCK-8S at both doses, compared with intraperitoneal saline, decreased the 1-h dark-phase food intake (2.5 ± 0.3 and 2.1 ± 0.2, respectively, vs. 4.0 ± 0.4 g/h, P < 0.05), and meal size (1.8 ± 0.2 and 1.8 ± 0.3, respectively, vs. 3.0 ± 0.3 g/h, P < 0.05), while the other parameters (bouts, meal frequency, time of meal, and meal duration) were not modified (data not shown). CCK-8S injected intraperitoneally in rats on HPD also decreased the first meal size (CCK-8S, 1.8 or 5.2 nmol: 2.1 ± 0.2 and 1.8 ± 0.3, respectively, vs. saline: 3.2 ± 0.3 g/meal, P < 0.05, Fig. 4C), and increased the latency to the 1st meal at 5.2 nmol/kg (18.9 ± 7.0 vs. saline 0.7 ± 0.2 min, P < 0.05; Fig. 4D). Of note, intraperitoneally saline-injected rats on the WD took significantly longer on average to start the first meal (30.4 ± 11.3 min) compared with those switched to the HPD (1.8 ± 1.3 min, P < 0.05; Fig. 4, B and D).
Fig. 4.

A HPD for 6 wk following a Western diet (WD) for 12 wk improved sensitivity to intraperitoneal CCK-8S compared with rats remaining on WD. A and B: rats maintained on WD. C and D: rats switched to HPD. Data are means ± SE. Rats per group are indicated at the bottom of each bar. *P < 0.05 vs. 0.0 (saline) and #P < 0.05 vs. 1.8 (CCK-8S dose nmol/kg) (one-way ANOVA).
HPD normalized blood glucose levels.
The blood glucose levels before the dark phase were 94.8 ± 2.8 mg/dl in rats on the ND. DIO rats remaining on the WD had elevated blood glucose levels (110.9 ± 2.4 mg/dl; P < 0.05 vs. ND), whereas DIO rats switched to the HPD had blood glucose levels (98.1 ± 3.1 mg/dl) similar to those of ND controls (Fig. 5).
Fig. 5.
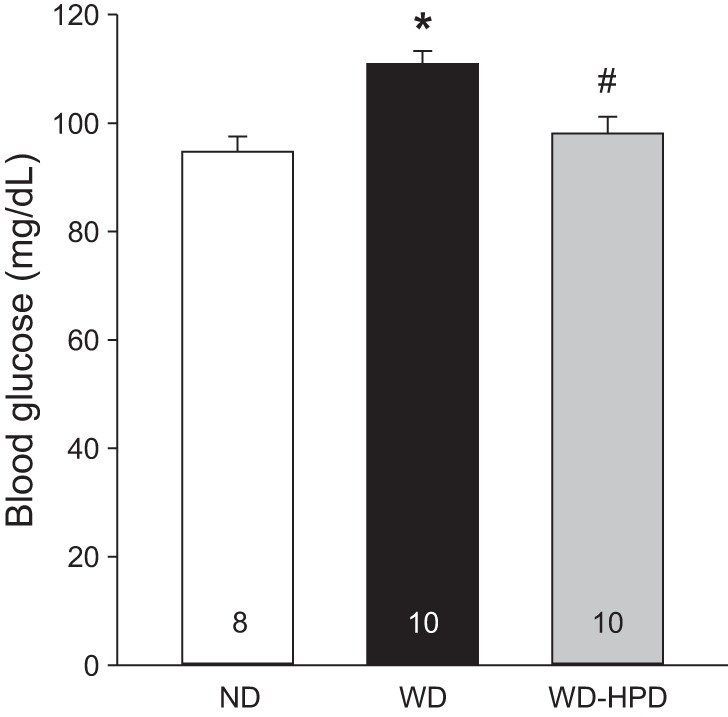
HPD for 6 wk following a WD for 12 wk prevents the hyperglycemia induced by a WD. Blood was collected by a tail prick 1–2 h before the dark phase in groups maintained on a ND or a WD, or switched to HPD (WD-HPD). Data are means ± SE, and rats/group are indicated in each bar. *P < 0.05 vs. ND and #P < 0.05 vs. WD (one-way ANOVA).
Gut microbiome shifted by WD and HPD.
The cecal microbiome of DIO rats, irrespective of whether they remained on the WD or were switched to the HPD, had increased α-diversity compared with ND rats using measures of richness (Chao1), phylogenetic diversity (Faith’s), and evenness (Shannon index) (Fig. 6A). There was no significant difference in α-diversity between the WD and HPD groups. β-Diversity analysis using unweighted UniFrac demonstrated that each dietary group had distinct cecal microbiota, with P < 10−5 by Adonis (Fig. 6B). The ND cecal microbiome was characterized by dominance of Lactobacillus, whereas the WD cecal microbiome was characterized by blooms of a number of other taxonomic groups, including unclassified members of the Clostridiaceae and Ruminococcaceae families and the RF39 order (Fig. 6C). DIO rats switched to the HPD showed expansion of Akkermansia, Ruminococcus, and Bacteroides. Differential abundance testing was performed using DESeq2 to identify specific microbes, defined as operational taxonomic units (OTUs) that were associated with either the WD or WD switched to the HPD. The HPD group had increased abundance of 114 OTUs and decreased abundance of 188 OTUs at a significance threshold of q < 0.05 (Fig. 6D). Of these, five OTUs were found to have a statistically significant association with fat mass after adjustment for the effect of dietary group in multivariate models. Two OTUs enriched on the HPD—Akkermansia muciniphila (q = 0.008) and an unclassified Clostridiales (q = 0.04)—were associated with decreased fat mass, while two OTUs that were depleted on the HPD—an unclassified RF39 (q = 0.0001) and a Phascolarctobacterium (q = 0.02)—were associated with increased fat mass.
Fig. 6.

HPD for 6 wk after a WD for 12-wk shifts the cecal microbiome of DIO rats maintained on a WD, with expansion of Akkermansia and reduction of RF39. A: three measures of α diversity are shown for the three dietary groups. P values were calculated using the Mann Whitney U-test. ***P < 0.0001. B: principal coordinates analysis plot colored by dietary group. C: mean taxonomic composition of the three dietary groups is shown at the phylum and genus level. The colors representing the most abundant taxa are shown to the right. D: operational taxonomic units (OTUs) with differential abundance in the HPD group compared with the WD group in DESeq2 models (q < 0.05) are shown, arranged by genus or higher taxonomic level (f = family, o = order) for OTUs that could not be classified at the genus level. Five OTUs that were associated with change in fat mass in multivariate DESeq2 models are colored based on the direction of the association. Circle size represents the significance of the association.
We investigated whether the differences in cecal microbiota characterizing each dietary group were associated with distinct functional profiles of the microbiome. The metagenome was predicted from the 16S rRNA sequence data using PICRUSt, which employs gene content imputation from the phylogenetically closest reference genomes for each OTU. Differential abundance testing between the WD and HPD groups revealed 56 differentially abundant metagenomic pathways with q < 0.05 (Fig. 7A). Of the top eight most enriched pathways on the HPD, five were categorized in the KEGG database within “glycan metabolism.” The individual taxa that made the greatest contribution to the association of HPD with these glycan-related KEGG pathways were identified using FishTaco. This analysis highlighted that Akkermansia muciniphila was the largest contributor to shifts in three of the five glycan metabolism pathways and that the unclassified RF39, through its inverse correlation with microbes expressing these metagenomics pathways, contributed to the observed shifts of all five pathways (Fig. 7B).
Fig. 7.

HPD for 6 wk after a WD for 12 wk increased the predicted abundance of metagenomic pathways involved in glycan metabolism. A: fold change in predicted abundance between the HPD and WD groups of 56 metagenomics pathways with q < 0.05 in DESeq2 models. The five differential metagenomic pathways categorized in KEGG as related to glycan metabolism are colored in blue. B: contribution of individual taxa to the significance of the five enriched metagenomics pathways related to glycan metabolism was evaluated using FishTaco. The positive and negative effects of taxa on significance are shown separately for taxa that are more abundant in the HPD group (upper bar) and those more abundant in the WD group (lower bar). Taxa could influence significance either by carrying genes in the selected pathway or by being correlated with other taxa carrying the gene. “Other” refers to the total effect of all other taxa not specifically depicted in the graphs.
HPD had a limited effect on WD-altered gene expression of cytokines and neuronal signals in the hypothalamus and dorsal medulla.
Rats remaining on the WD compared with rats on the ND had a significantly increased hypothalamic gene expression of TNF-α and transforming growth factor-β (TGF-β) with a trend for C-C motif chemokine ligand 2 (CCL2) and IL-10 (Fig. 8), while IL-6 was unchanged (data not shown). The WD rats switched to the HPD also showed a similar increased expression of TNF-α and TGF-β and displayed a significant higher expression of CCL2 and IL-10 (Fig. 8) with no change in IL-6 (not shown) compared with ND. WD and WD switched to a HPD induced a similar significant decrease in the expression of mammalian target of rapamycin (mTOR, Fig. 8). Corticotropin-releasing factor (CRF) mRNA level was significantly reduced in rats switched to the HPD compared with those on the ND, while there was a trend in the WD group (Fig. 8). There were no changes in the hypothalamic expression of metabolic hormone receptors, namely growth hormone secretagogue receptor 1a (ghrelin receptor), leptin receptor, CCK receptor 1, and insulin receptor A and B (data not shown).
Fig. 8.

Altered expression of cytokines and mammalian target of rapamycin (mTOR) in the hypothalamus of rats on a WD were not modified by switching to a high-protein diet (WD-HPD) for 6 wk. Data are means ± SE; number of rats/group is indicated at the bottom of the column in the first graph. *P < 0.05 vs. ND (one-way ANOVA).
In the dorsal medulla, the WD and the WD switched to a HPD groups showed a significant similar increase in mRNA levels of CCL2, IL-10, TGF-β, leptin receptor, insulin receptor A, and glucagon-like peptide receptor 1 (GLP-1R) compared with ND (Fig. 9). The WD induced a significant increase in proopiomelanocortin (POMC) mRNA levels in the medulla that was no longer observed in HPD group (Fig. 9). TNF-α and CCK receptor 1 were not significantly changed by the WD and WD-HPD (Fig. 9 and data not shown).
Fig. 9.

Altered expression of cytokines, POMC, and gut neuropeptide receptors in the dorsal medulla of rats on a WD was not modified by switching to a HPD (WD-HPD) for 6 wk. Data are means ± SE, n = 6–11. *P < 0.05 vs. ND (one-way ANOVA). GLP-1R, glucagon-like peptide 1 receptor; IRa, insulin receptor A; LepR, leptin receptor.
DISCUSSION
This study demonstrates that a prolonged HPD feeding induces a more prominent reduction in percentage of body fat mass than body weight in DIO rats. HPD improves the satiety effect of peripheral CCK and normalizes water intake and basal blood glucose levels. HPD shifts the cecal microbiota with the enrichment of some taxa, in particular, Akkermansia muciniphila, being correlated with the reduction in fat mass, consistent with this strain being beneficial for reducing fat mass gain induced by HFD (19, 45). However, the HPD does not significantly modify the brain inflammatory response occurring in the hypothalamus and that we demonstrated to be present also in the dorsal medulla of rats on WD.
Body composition, meal structure, and water intake.
We previously reported that DIO rats switched to the same HPD as used in the present study for 2 wk had a significant reduction of fat mass compared with those switching to a normal diet (53). The present study extends these observations by showing a 28.6% less body fat mass gain in rats switched to HPD for 6 wk, while body weight, lean mass, and brown fat were not significantly changed compared with rats remaining on the WD.
An important feature of our model was the equivalent caloric intake by rats fed on each of the three diets. We observed only a transient 31% reduction of food intake during the first 1–2 days following the switch to HPD, consistent with our previous findings under the same conditions (53). This could be related to the HPD being initially perceived as less palatable than the WD (37). It is noteworthy that in choice preference experiments, rats select casein-containing diets over other proteins (51). The HPD used contained 52% protein as casein, supporting the acceptability of the HPD, as also shown by the absence of a difference in caloric intake compared with WD and ND rats during the 6-wk experimental period. These data indicate that HPD can reduce body fat under isocaloric conditions. Clinical studies in obese subjects have shown improved body composition induced by the HPD characterized by greater reduction in body fat without losing lean mass (6, 18, 42). This supports the face validity of this HPD model that contained 50% calories from protein, a percentage within the same range used in human HPD (66). Of note, the fat loss induced by HPD in our model is not caused by caloric restriction and may be related to increased energy expenditure as HPD increases oxygen consumption, thermogenesis, and postprandial ATP utilization (15, 66). In addition, the HPD induced satiation by reducing the size and rate of meals to levels of ND, while the WD increased them. Eating quickly has been shown associated with excess weight (40). Our data support that reduced meal size and rate may be relevant interventions for body weight management.
In the present study, we additionally measured water intake and found that rats on a WD drink about one-third less water than those on a normal diet. Importantly, switching to the HPD completely restored the daily amount of water taken. Other studies in mice fed high-protein diets containing different concentrations of proteins showed a positive correlation between water and nitrogen intake (44). However, whether this dietary component solely contributes to the normalization of water intake in HPD group remains to be established.
Blood glucose levels.
It is well known that the blood glucose levels are elevated in obese subjects (31) and in experimental animals on long-term HFD (5). Little information is available about the effect of HPD on obesity-associated hyperglycemia. In this study, we demonstrated that switching to a HPD for 6 wk normalized to control levels the increased basal blood glucose levels in rats maintained on WD. These data expand our previous findings showing that rats on the same HPD for 2 wk had an improved glucose tolerance test (53). We also previously found that switching to normal chow for 2 wk after a WD had less of an effect than switching to HPD to reduce body fat and did not improve blood glucose levels increased by WD (53). The maintenance of glucose homeostasis induced by chronic intake of HPD after DIO may involve actions linked with reduction of adipose tissues, hepatic gluconeogenesis, and/or glucose metabolism (15, 66).
CCK sensitivity.
In this study, DIO rats injected peripherally with CCK-8S had no significant changes in food intake and meal pattern compared with vehicle, as monitored during the first 1 h postinjection in the dark phase. We previously reported that CCK-8S injected intraperitoneally at the same doses and experimental conditions in rats on a ND reduced food intake, meal size and duration, and the latency to the first meal (22). These data are consistent with previous reports that CCK sensitivity is decreased in obese rodents, as assessed by the attenuated CCK effect on food intake and gastric emptying (17, 39, 56). Switching DIO rats to the HPD restored the sensitivity to intraperitoneal CCK-8, including the reduction of food intake and meal size and prolonged latency to the first meal. A previous report indicates that the decreased sensitivity to CCK can also be reversed by switching rats on a HFD for 9 wk to a low-fat diet (56), and this rescue occurred under conditions of similar body weight gain (although body adiposity was not directly assessed) (8). There is also evidence that the HFD-induced decreased sensitivity to CCK satiety signaling may be attributed to HFDʼs already high circulating levels of CCK, which may result in CCK desensitization, as suggested by the downregulation of CCK-R1 receptors in the nodose ganglia and reduced CCK-related vagal afferent activation (17, 55). Response to CCK treatment was reduced in the neurons from the nodose ganglia and in the jejunum afferents of obese mice on a HFD for 8–10 wk (9). These data support that the reduction of fat intake associated with the HPD is an important contributing factor to increased CCK sensitivity. In addition, the HPD may have curtailed leptin resistance occurring under DIO conditions (13) by reducing visceral fat mass and, thereby, restoring the CCK-leptin synergistic interaction on vagal afferents driving the satiety signal (3). However, our data cannot answer whether it is the change in dietary composition per se or fat loss that is most relevant for improved CCK sensitivity on a HPD. Thus, the relative importance of changes in dietary fat composition and adiposity to restore CCK sensitivity induced by a HPD will need to be further dissected.
The gut microbiome of DIO is shifted by a HPD.
Recent data suggest that the intestinal microbiome can mediate the response to antiobesity interventions, such as bariatric surgery and diet (19, 52). We demonstrated that the HPD induces changes in the cecal microbiome, including increased Akkermansia muciniphila in rats with DIO. This is consistent with the literature demonstrating that dietary shifts can induce rapid changes in microbial composition and that diet is associated with long-term microbial community structure (1). In particular, animal protein intake greatly influences the microbiome after as little as 1 day of consumption (10, 72). Akkermansia is of particular interest, as the literature suggests that it may mediate the response to antiobesity interventions. This genus has been shown to be depleted in obese mice and humans but enriched after gastric bypass surgery (19, 33, 75). Metformin, a diabetes medication associated with weight loss, has also been shown to induce Akkermansia muciniphila (50). Colonization of germ-free mice with the microbiome of mice following gastric bypass surgery reduced adiposity compared with recipients of sham-operated mice, associated with increased Akkermansia (33). Convergent studies have demonstrated that treatment of DIO mice (induced by either a high-fat diet or WD) with daily gavage of live, but not heat-killed, Akkermansia muciniphila reduced adipose tissue deposits and hyperglycemia in mice (19, 41). In the present study, the induction of Akkermansia may underlie the fat loss induced by the HPD, as suggested by the significant inverse association of Akkermansia muciniphila with body fat mass in multivariate models adjusting for dietary group. Little is known about the mechanisms through which Akkermansia mediates its apparent association with improved metabolic parameters, but intriguingly, we found that it accounted for large predicted shifts in glycan metabolism in the cecal microbiome. These shifts may have the net effect of fortifying the intestinal mucus barrier, as it has been previously reported that treatment with Akkermansia muciniphila reversed thinning of the colonic mucus barrier induced by a high-fat diet (19). Likewise, a recent study also showed that a specific protein isolated from the outer membrane of Akkermansia muciniphila interacts with Toll-like receptor 2 to improve the gut barrier and partly recapitulate the beneficial effects of the bacterium on fat mass development and insulin resistance in DIO mice (45).
Interestingly, an unclassified member of RF39 was associated with increased fat mass. The RF39 order falls within the Mollicutes class, which is dramatically increased in mice on the WD, and may represent a novel phylogenetic entity of interest for understanding the pathophysiology of obesity related to the WD (41). A potential mechanism by which microbes might contribute to fat gain on a WD, even though caloric intake was equivalent to that of the ND and HPD groups, is increased energy extraction from ingested food, as previously reported for the obesity-associated microbiome of mice (61).
Altered expression of inflammatory and neurohormonal signals in DIO rats.
The study presents three main novel findings related to brain inflammatory and neuronal signals in DIO rats: 1) inflammatory mediators are upregulated not only in the hypothalamus, but also in the dorsal medulla containing the dorsal vagal complex (NTS and dorsal motor nucleus of the vagus, DMV) (23) and area postrema by long-term WD feeding; 2) the expression of POMC and receptors for leptin, insulin, and GLP-1 is upregulated in the dorsal medulla, but not in the hypothalamus by the WD; and 3) switching DIO rats to the HPD for 6 wk has no significant effect on these hypothalamic and brain stem inflammatory changes, while in the hypothalamus, there is a significant increase in the expression of CCL2 and IL-10 and a decrease of CRF compared with rats on a ND.
We showed a significant increase of TNF-α and TGF-β in the hypothalamus of WD-fed rats. This is in line with the well-documented increased expression of cytokines in the hypothalamus in response to HFD and obesity (12, 59, 71). Rodents fed a HFD display an increase in inflammatory cytokines (TNF-α, IL-1, and IL-6) and mediators (Toll-like receptors, NF-κB), along with activation of microglia in the hypothalamus (57, 59). Recent studies in mice fed a HFD for several weeks demonstrated that microglia and astrocytes are involved in the processes of hypothalamic inflammation induced by HFD (57, 63). Likewise, in humans, magnetic resonance imaging revealed gliosis in the brain of obese subjects (57). With regard to TGF-β, this cytokine has often been studied for its anti-inflammatory properties (68). However, a recent report in mice showed, consistent with our findings, that HFD increased hypothalamic TGF-β expression, and that TGF-β activated the proinflammatory NF-κB pathways playing a role, with other cytokines, in the inflammatory response induced by HFD at this site (74).
Whether inflammatory mediators are also induced in extrahypothalamic brain areas by HFD has so far been little investigated, in particular, in the dorsal medulla that encompasses key centers, such as the NTS together with the area postrema that integrate signals derived from nutrients and peripheral hormones (21, 48). We showed, for the first time, a significant increase in the gene expression of TGF-β and the chemokine CCL2 in the dorsal medulla of rats fed a WD. On the basis of the proinflammatory action of TGF-β in the context of HFD (74) and the elevation of CCL2 known to be associated with inflammation and microgliosis (28), these changes may reflect inflammatory response also taking place in the hindbrain. This is supported by a recent report that feeding rats a HFD for 3 wk induced microglia activation in the NTS and DMV, along with neuronal remodeling involving vagal input (65). In addition, we also observed a significant increase in the anti-inflammatory cytokine IL-10 in the dorsal medulla of rats fed WD. It may be speculated that IL-10 plays a role in modulating the proinflammatory response (38), as reflected by the nonsignificant change in TNF-α in the dorsal medulla, unlike in the hypothalamus, where this cytokine expression is elevated, while there is no change in IL-10. The present and previous observations point to the brain stem as another important site responding to HFD by altering cytokines/chemokine and activating microglia.
Of importance, switching rats from WD to a HPD diet for 6 wk did not influence the WD-induced proinflammatory mediator changes in both the dorsal medulla and hypothalamus, except for an increase in the hypothalamic anti-inflammatory cytokine IL-10. The present observation is significant in the context that the activation of inflammatory signaling pathways induced by HFD in the hypothalamus is known to play a role in the resistance to insulin and leptin and in the development of obesity (11, 67). Taken together, the present findings suggest that the beneficial effects of a HPD to restore altered peripheral parameters evoked by WD are not related to the normalization of brain proinflammatory response, even under conditions of reduced fat mass.
Therefore, we next assessed whether neuropeptides or sensing signaling gene expression associated with changes in energy status in the hypothalamus and dorsal medulla are influenced by HPD. In the hypothalamus, mTOR is well established to regulate body weight, energy expenditure, and glucose/lipid homeostasis, and mTORC1 signaling is decreased by HFD (7, 26). We showed that the WD downregulates the expression of hypothalamic mTOR; however, these changes were not modified by HPD. Likewise, in the hindbrain, mRNA levels of POMC and receptors for leptin, insulin, and GLP-1 that were upregulated in the dorsal medulla by HFD were unchanged after 6 wk of HPD. Therefore, switching to the HPD for 6 wk had little influence on these signals in the dorsal medulla altered by HFD. This contrasts with the beneficial effects on several peripheral parameters (glucose, CCK sensitivity, fat mass, and microbiota) pointing to an action of HPD occurring primarily at peripheral sites. The alterations of the gut microbiome represent an attractive candidate mechanism, which may, in turn, influence neurohormonal networks in the digestive tract that regulate metabolism, including increased sensitivity to CCK. Further understanding of the mechanistic link between the microbiome and the peripheral beneficial effects of the HPD may spur development of therapies for obesity that directly target the microbiome to complement dietary intake.
Perspectives and Significance
There is a paucity of experimental studies on the impact of HPD on central and peripheral alterations induced by chronic HFD (15, 66). We show that switching rats from a WD to a HPD for over 6 wk restores glucose homeostasis and reduces body fat while maintaining lean mass. This is consistent with clinical studies (6) and provides a relevant experimental model to study underlying mechanisms. The HPD also restores sensitivity to intraperitoneal CCK, while exerting little effect on the WD-altered gene expression of proinflammatory mediators, neuropeptides, and receptors for gut hormones in the hypothalamus and/or dorsal medulla. These findings suggest that HPD-induced reduction of fat mass, restoration of glucose homeostasis, and CCK sensitivity primarily involve peripheral mechanisms. Of potential significance is the observed association between cecal Akkermansia muciniphila and an unclassified Clostridiales with loss of fat mass on a HPD. This is relevant in the context that Akkermansia muciniphila is one of the most abundant members of the human gut microbiota, with strong effects on metabolism (14). Further investigations will be required to elucidate the role of specific microbial taxa changes in mediating the beneficial actions of a HPD. In addition, further studies with rats achieving equivalent fat mass loss to the HPD group through reduced calorie intake are required to determine to what extent the physiological changes observed in the present study are related to the HPD itself rather than the metabolic shifts that occur during a period of fat mass loss.
With regard to previous and present convergent evidence demonstrating that obesity and/or high-fat diet are associated with inflammation in the brain, studies on HFD-induced neuroinflammation in the brains of obese humans are still sparse (57). This topic has attracted little attention in the obesity literature (25) despite evidence that chronic neuroinflammation may be relevant to the development of brain atrophy in obese patients (62, 69). Atrophy and neuroinflammation in the brains of obese individuals may not be easily reversed, at least not by diet management.
GRANTS
This work was supported by National Institutes of Health Grant DK-41301 (Models of GI Functions and Diseases, to Y. Taché, L. Wang, and M. Million), a Veterans Affairs (VA) Senior Career Scientist Award (to Y. Taché), and VA Rehabilitation and Merit Review grants (to J. R. Pisegna, Y. Taché, and L. Wang).
DISCLOSURES
No conflicts of interest, financial or otherwise, are declared by the authors.
AUTHOR CONTRIBUTIONS
L.W. and Y.T. conceived and designed research; L.W., J.P.J., V.L., P.-Q.Y., S.V.W., and M.M. performed experiments; L.W., J.P.J., V.L., P.-Q.Y., and S.V.W. analyzed data; L.W., J.P.J., V.L., P.-Q.Y., S.V.W., J.R.R.J., and J.R.P. interpreted results of experiments; L.W., J.P.J., and V.L. prepared figures; L.W., J.P.J., and Y.T. drafted manuscript; L.W., J.P.J., and Y.T. edited and revised manuscript; L.W., J.P.J., V.L., P.-Q.Y., S.V.W., M.M., J.R.R.J., J.R.P., and Y.T. approved final version of manuscript.
ACKNOWLEDGMENTS
We are grateful to Honghui Liang for excellent technical support.
REFERENCES
- 1.Albenberg LG, Wu GD. Diet and the intestinal microbiome: associations, functions, and implications for health and disease. Gastroenterology 146: 1564–1572, 2014. doi: 10.1053/j.gastro.2014.01.058. [DOI] [PMC free article] [PubMed] [Google Scholar]
- 2.Anderson MJ. A new method for non-parametric multivariate analysis of variance. Austral Ecol 26: 32–46, 2001. doi: 10.1111/j.1442-9993.2001.01070.pp.x. [DOI] [Google Scholar]
- 3.Barrachina MD, Martínez V, Wang L, Wei JY, Taché Y. Synergistic interaction between leptin and cholecystokinin to reduce short-term food intake in lean mice. Proc Natl Acad Sci USA 94: 10455–10460, 1997. doi: 10.1073/pnas.94.19.10455. [DOI] [PMC free article] [PubMed] [Google Scholar]
- 4.Caporaso JG, Kuczynski J, Stombaugh J, Bittinger K, Bushman FD, Costello EK, Fierer N, Peña AG, Goodrich JK, Gordon JI, Huttley GA, Kelley ST, Knights D, Koenig JE, Ley RE, Lozupone CA, McDonald D, Muegge BD, Pirrung M, Reeder J, Sevinsky JR, Turnbaugh PJ, Walters WA, Widmann J, Yatsunenko T, Zaneveld J, Knight R. QIIME allows analysis of high-throughput community sequencing data. Nat Methods 7: 335–336, 2010. doi: 10.1038/nmeth.f.303. [DOI] [PMC free article] [PubMed] [Google Scholar]
- 5.Cerf ME. High fat diet modulation of glucose sensing in the β-cell. Med Sci Monit 13: RA12–RA17, 2007. [PubMed] [Google Scholar]
- 6.Clifton PM, Condo D, Keogh JB. Long term weight maintenance after advice to consume low-carbohydrate, higher-protein diets—a systematic review and meta-analysis. Nutr Metab Cardiovasc Dis 24: 224–235, 2014. doi: 10.1016/j.numecd.2013.11.006. [DOI] [PubMed] [Google Scholar]
- 7.Cota D, Matter EK, Woods SC, Seeley RJ. The role of hypothalamic mammalian target of rapamycin complex 1 signaling in diet-induced obesity. J Neurosci 28: 7202–7208, 2008. doi: 10.1523/JNEUROSCI.1389-08.2008. [DOI] [PMC free article] [PubMed] [Google Scholar]
- 8.Covasa M, Ritter RC. Rats maintained on high-fat diets exhibit reduced satiety in response to CCK and bombesin. Peptides 19: 1407–1415, 1998. doi: 10.1016/S0196-9781(98)00096-5. [DOI] [PubMed] [Google Scholar]
- 9.Daly DM, Park SJ, Valinsky WC, Beyak MJ. Impaired intestinal afferent nerve satiety signalling and vagal afferent excitability in diet induced obesity in the mouse. J Physiol 589: 2857–2870, 2011. doi: 10.1113/jphysiol.2010.204594. [DOI] [PMC free article] [PubMed] [Google Scholar]
- 10.David LA, Maurice CF, Carmody RN, Gootenberg DB, Button JE, Wolfe BE, Ling AV, Devlin AS, Varma Y, Fischbach MA, Biddinger SB, Dutton RJ, Turnbaugh PJ. Diet rapidly and reproducibly alters the human gut microbiome. Nature 505: 559–563, 2014. doi: 10.1038/nature12820. [DOI] [PMC free article] [PubMed] [Google Scholar]
- 11.de Git KC, Adan RA. Leptin resistance in diet-induced obesity: the role of hypothalamic inflammation. Obes Rev 16: 207–224, 2015. doi: 10.1111/obr.12243. [DOI] [PubMed] [Google Scholar]
- 12.De Souza CT, Araujo EP, Bordin S, Ashimine R, Zollner RL, Boschero AC, Saad MJ, Velloso LA. Consumption of a fat-rich diet activates a proinflammatory response and induces insulin resistance in the hypothalamus. Endocrinology 146: 4192–4199, 2005. doi: 10.1210/en.2004-1520. [DOI] [PubMed] [Google Scholar]
- 13.de Lartigue G, Barbier de la Serre C, Espero E, Lee J, Raybould HE. Diet-induced obesity leads to the development of leptin resistance in vagal afferent neurons. Am J Physiol Endocrinol Metab 301: E187–E195, 2011. doi: 10.1152/ajpendo.00056.2011. [DOI] [PMC free article] [PubMed] [Google Scholar]
- 14.Derrien M, Collado MC, Ben-Amor K, Salminen S, de Vos WM. The Mucin degrader Akkermansia muciniphila is an abundant resident of the human intestinal tract. Appl Environ Microbiol 74: 1646–1648, 2008. doi: 10.1128/AEM.01226-07. [DOI] [PMC free article] [PubMed] [Google Scholar]
- 15.Devkota S, Layman DK. Protein metabolic roles in treatment of obesity. Curr Opin Clin Nutr Metab Care 13: 403–407, 2010. doi: 10.1097/MCO.0b013e32833a7737. [DOI] [PubMed] [Google Scholar]
- 16.Duca FA, Sakar Y, Covasa M. The modulatory role of high-fat feeding on gastrointestinal signals in obesity. J Nutr Biochem 24: 1663–1677, 2013. doi: 10.1016/j.jnutbio.2013.05.005. [DOI] [PubMed] [Google Scholar]
- 17.Duca FA, Zhong L, Covasa M. Reduced CCK signaling in obese-prone rats fed a high-fat diet. Horm Behav 64: 812–817, 2013. doi: 10.1016/j.yhbeh.2013.09.004. [DOI] [PubMed] [Google Scholar]
- 18.Due A, Toubro S, Skov AR, Astrup A. Effect of normal-fat diets, either medium or high in protein, on body weight in overweight subjects: a randomised 1-year trial. Int J Obes Relat Metab Disord 28: 1283–1290, 2004. doi: 10.1038/sj.ijo.0802767. [DOI] [PubMed] [Google Scholar]
- 19.Everard A, Belzer C, Geurts L, Ouwerkerk JP, Druart C, Bindels LB, Guiot Y, Derrien M, Muccioli GG, Delzenne NM, de Vos WM, Cani PD. Cross-talk between Akkermansia muciniphila and intestinal epithelium controls diet-induced obesity. Proc Natl Acad Sci USA 110: 9066–9071, 2013. doi: 10.1073/pnas.1219451110. [DOI] [PMC free article] [PubMed] [Google Scholar]
- 20.Faipoux R, Tomé D, Gougis S, Darcel N, Fromentin G. Proteins activate satiety-related neuronal pathways in the brainstem and hypothalamus of rats. J Nutr 138: 1172–1178, 2008. [DOI] [PubMed] [Google Scholar]
- 21.Fromentin G, Darcel N, Chaumontet C, Marsset-Baglieri A, Nadkarni N, Tomé D. Peripheral and central mechanisms involved in the control of food intake by dietary amino acids and proteins. Nutr Res Rev 25: 29–39, 2012. doi: 10.1017/S0954422411000175. [DOI] [PubMed] [Google Scholar]
- 22.Goebel-Stengel M, Stengel A, Wang L, Ohning G, Taché Y, Reeve JR Jr. CCK-8 and CCK-58 differ in their effects on nocturnal solid meal pattern in undisturbed rats. Am J Physiol Regul Integr Comp Physiol 303: R850–R860, 2012. doi: 10.1152/ajpregu.00365.2011. [DOI] [PMC free article] [PubMed] [Google Scholar]
- 23.Grijalva CV, Novin D. The role of the hypothalamus and dorsal vagal complex in gastrointestinal function and pathophysiology. Ann NY Acad Sci 597: 207–222, 1990. doi: 10.1111/j.1749-6632.1990.tb16169.x. [DOI] [PubMed] [Google Scholar]
- 24.Hariri N, Thibault L. High-fat diet-induced obesity in animal models. Nutr Res Rev 23: 270–299, 2010. doi: 10.1017/S0954422410000168. [DOI] [PubMed] [Google Scholar]
- 25.Heymsfield SB, Wadden TA. Mechanisms, pathophysiology, and management of obesity. N Engl J Med 376: 254–266, 2017. doi: 10.1056/NEJMra1514009. [DOI] [PubMed] [Google Scholar]
- 26.Hu F, Xu Y, Liu F. Hypothalamic roles of mTOR complex I: integration of nutrient and hormone signals to regulate energy homeostasis. Am J Physiol Endocrinol Metab 310: E994–E1002, 2016. doi: 10.1152/ajpendo.00121.2016. [DOI] [PMC free article] [PubMed] [Google Scholar]
- 27.Journel M, Chaumontet C, Darcel N, Fromentin G, Tomé D. Brain responses to high-protein diets. Adv Nutr 3: 322–329, 2012. doi: 10.3945/an.112.002071. [DOI] [PMC free article] [PubMed] [Google Scholar]
- 28.Kiyota T, Yamamoto M, Xiong H, Lambert MP, Klein WL, Gendelman HE, Ransohoff RM, Ikezu T. CCL2 accelerates microglia-mediated Aβ oligomer formation and progression of neurocognitive dysfunction. PLoS One 4: e6197, 2009. doi: 10.1371/journal.pone.0006197. [DOI] [PMC free article] [PubMed] [Google Scholar]
- 29.Langille MG, Zaneveld J, Caporaso JG, McDonald D, Knights D, Reyes JA, Clemente JC, Burkepile DE, Vega Thurber RL, Knight R, Beiko RG, Huttenhower C. Predictive functional profiling of microbial communities using 16S rRNA marker gene sequences. Nat Biotechnol 31: 814–821, 2013. doi: 10.1038/nbt.2676. [DOI] [PMC free article] [PubMed] [Google Scholar]
- 30.Layman DK, Evans EM, Erickson D, Seyler J, Weber J, Bagshaw D, Griel A, Psota T, Kris-Etherton P. A moderate-protein diet produces sustained weight loss and long-term changes in body composition and blood lipids in obese adults. J Nutr 139: 514–521, 2009. doi: 10.3945/jn.108.099440. [DOI] [PubMed] [Google Scholar]
- 31.LeRoith D. Dyslipidemia and glucose dysregulation in overweight and obese patients. Clin Cornerstone 8: 38–52, 2007. doi: 10.1016/S1098-3597(07)80027-5. [DOI] [PubMed] [Google Scholar]
- 32.Ley RE, Turnbaugh PJ, Klein S, Gordon JI. Microbial ecology: human gut microbes associated with obesity. Nature 444: 1022–1023, 2006. doi: 10.1038/4441022a. [DOI] [PubMed] [Google Scholar]
- 33.Liou AP, Paziuk M, Luevano JM Jr, Machineni S, Turnbaugh PJ, Kaplan LM. Conserved shifts in the gut microbiota due to gastric bypass reduce host weight and adiposity. Sci Transl Med 5: 178ra41, 2013. doi: 10.1126/scitranslmed.3005687. [DOI] [PMC free article] [PubMed] [Google Scholar]
- 34.Liu X, Blouin JM, Santacruz A, Lan A, Andriamihaja M, Wilkanowicz S, Benetti PH, Tomé D, Sanz Y, Blachier F, Davila AM. High-protein diet modifies colonic microbiota and luminal environment but not colonocyte metabolism in the rat model: the increased luminal bulk connection. Am J Physiol Gastrointest Liver Physiol 307: G459–G470, 2014. doi: 10.1152/ajpgi.00400.2013. [DOI] [PubMed] [Google Scholar]
- 35.Love MI, Huber W, Anders S. Moderated estimation of fold change and dispersion for RNA-seq data with DESeq2. Genome Biol 15: 550, 2014. doi: 10.1186/s13059-014-0550-8. [DOI] [PMC free article] [PubMed] [Google Scholar]
- 36.Manor O, Borenstein E. Systematic characterization and analysis of the taxonomic drivers of functional shifts in the human microbiome. Cell Host Microbe 21: 254–267, 2017. doi: 10.1016/j.chom.2016.12.014. [DOI] [PMC free article] [PubMed] [Google Scholar]
- 37.McArthur LH, Kelly WF, Gietzen DW, Rogers QR. The role of palatability in the food intake response of rats fed high-protein diets. Appetite 20: 181–196, 1993. doi: 10.1006/appe.1993.1019. [DOI] [PubMed] [Google Scholar]
- 38.Nakata M, Yamamoto S, Okada T, Yada T. AAV-mediated IL-10 gene transfer counteracts inflammation in the hypothalamic arcuate nucleus and obesity induced by high-fat diet. Neuropeptides 62: 87–92, 2017. doi: 10.1016/j.npep.2016.11.009. [DOI] [PubMed] [Google Scholar]
- 39.Niederau C, Meereis-Schwanke K, Klonowski-Stumpe H, Herberg L. CCK-resistance in Zucker obese versus lean rats. Regul Pept 70: 97–104, 1997. doi: 10.1016/S0167-0115(97)00014-1. [DOI] [PubMed] [Google Scholar]
- 40.Ohkuma T, Hirakawa Y, Nakamura U, Kiyohara Y, Kitazono T, Ninomiya T. Association between eating rate and obesity: a systematic review and meta-analysis. Int J Obes 39: 1589–1596, 2015. doi: 10.1038/ijo.2015.96. [DOI] [PubMed] [Google Scholar]
- 41.Org E, Parks BW, Joo JW, Emert B, Schwartzman W, Kang EY, Mehrabian M, Pan C, Knight R, Gunsalus R, Drake TA, Eskin E, Lusis AJ. Genetic and environmental control of host-gut microbiota interactions. Genome Res 25: 1558–1569, 2015. doi: 10.1101/gr.194118.115. [DOI] [PMC free article] [PubMed] [Google Scholar]
- 42.Paddon-Jones D, Westman E, Mattes RD, Wolfe RR, Astrup A, Westerterp-Plantenga M. Protein, weight management, and satiety. Am J Clin Nutr 87: 1558S–1561S, 2008. [DOI] [PubMed] [Google Scholar]
- 43.Paxinos G, Watson C. The Rat Brain in Stereotaxic Coordinates. Orlando, FL: Academic, 2007. [Google Scholar]
- 44.Petzke KJ, Freudenberg A, Klaus S. Beyond the role of dietary protein and amino acids in the prevention of diet-induced obesity. Int J Mol Sci 15: 1374–1391, 2014. doi: 10.3390/ijms15011374. [DOI] [PMC free article] [PubMed] [Google Scholar]
- 45.Plovier H, Everard A, Druart C, Depommier C, Van Hul M, Geurts L, Chilloux J, Ottman N, Duparc T, Lichtenstein L, Myridakis A, Delzenne NM, Klievink J, Bhattacharjee A, van der Ark KC, Aalvink S, Martinez LO, Dumas ME, Maiter D, Loumaye A, Hermans MP, Thissen JP, Belzer C, de Vos WM, Cani PD. A purified membrane protein from Akkermansia muciniphila or the pasteurized bacterium improves metabolism in obese and diabetic mice. Nat Med 23: 107–113, 2017. doi: 10.1038/nm.4236. [DOI] [PubMed] [Google Scholar]
- 46.Riediger T. The receptive function of hypothalamic and brainstem centres to hormonal and nutrient signals affecting energy balance. Proc Nutr Soc 71: 463–477, 2012. doi: 10.1017/S0029665112000778. [DOI] [PubMed] [Google Scholar]
- 47.Saha DC, Reimer RA. Long-term intake of a high prebiotic fiber diet but not high protein reduces metabolic risk after a high fat challenge and uniquely alters gut microbiota and hepatic gene expression. Nutr Res 34: 789–796, 2014. doi: 10.1016/j.nutres.2014.08.004. [DOI] [PubMed] [Google Scholar]
- 48.Schwartz GJ. Brainstem integrative function in the central nervous system control of food intake. Forum Nutr 63: 141–151, 2010. doi: 10.1159/000264402. [DOI] [PubMed] [Google Scholar]
- 49.Schwingshackl L, Hoffmann G. Long-term effects of low-fat diets either low or high in protein on cardiovascular and metabolic risk factors: a systematic review and meta-analysis. Nutr J 12: 48, 2013. doi: 10.1186/1475-2891-12-48. [DOI] [PMC free article] [PubMed] [Google Scholar]
- 50.Shin NR, Lee JC, Lee HY, Kim MS, Whon TW, Lee MS, Bae JW. An increase in the Akkermansia spp. population induced by metformin treatment improves glucose homeostasis in diet-induced obese mice. Gut 63: 727–735, 2014. doi: 10.1136/gutjnl-2012-303839. [DOI] [PubMed] [Google Scholar]
- 51.Soenen S, Westerterp-Plantenga MS. Proteins and satiety: implications for weight management. Curr Opin Clin Nutr Metab Care 11: 747–751, 2008. doi: 10.1097/MCO.0b013e328311a8c4. [DOI] [PubMed] [Google Scholar]
- 52.Sonnenburg JL, Bäckhed F. Diet-microbiota interactions as moderators of human metabolism. Nature 535: 56–64, 2016. doi: 10.1038/nature18846. [DOI] [PMC free article] [PubMed] [Google Scholar]
- 53.Stengel A, Goebel-Stengel M, Wang L, Hu E, Karasawa H, Pisegna JR, Taché Y. High-protein diet selectively reduces fat mass and improves glucose tolerance in Western-type diet-induced obese rats. Am J Physiol Regul Integr Comp Physiol 305: R582–R591, 2013. doi: 10.1152/ajpregu.00598.2012. [DOI] [PMC free article] [PubMed] [Google Scholar]
- 54.Storey JD, Tibshirani R. Statistical significance for genomewide studies. Proc Natl Acad Sci USA 100: 9440–9445, 2003. doi: 10.1073/pnas.1530509100. [DOI] [PMC free article] [PubMed] [Google Scholar]
- 55.Swartz TD, Duca FA, Covasa M. Differential feeding behavior and neuronal responses to CCK in obesity-prone and -resistant rats. Brain Res 1308: 79–86, 2010. doi: 10.1016/j.brainres.2009.10.045. [DOI] [PubMed] [Google Scholar]
- 56.Swartz TD, Savastano DM, Covasa M. Reduced sensitivity to cholecystokinin in male rats fed a high-fat diet is reversible. J Nutr 140: 1698–1703, 2010. doi: 10.3945/jn.110.124149. [DOI] [PubMed] [Google Scholar]
- 57.Thaler JP, Yi CX, Schur EA, Guyenet SJ, Hwang BH, Dietrich MO, Zhao X, Sarruf DA, Izgur V, Maravilla KR, Nguyen HT, Fischer JD, Matsen ME, Wisse BE, Morton GJ, Horvath TL, Baskin DG, Tschöp MH, Schwartz MW. Obesity is associated with hypothalamic injury in rodents and humans. J Clin Invest 122: 153–162, 2012. doi: 10.1172/JCI59660. [DOI] [PMC free article] [PubMed] [Google Scholar]
- 58.Tong M, Jacobs JP, McHardy IH, Braun J. Sampling of intestinal microbiota and targeted amplification of bacterial 16S rRNA genes for microbial ecologic analysis. Curr Protoc Immunol 107: 7.41.1–7.41.11, 2014. doi: 10.1002/0471142735.im0741s107. [DOI] [PMC free article] [PubMed] [Google Scholar]
- 59.Tran DQ, Tse EK, Kim MH, Belsham DD. Diet-induced cellular neuroinflammation in the hypothalamus: Mechanistic insights from investigation of neurons and microglia. Mol Cell Endocrinol 438: 18–26, 2016. doi: 10.1016/j.mce.2016.05.015. [DOI] [PubMed] [Google Scholar]
- 60.Turnbaugh PJ, Bäckhed F, Fulton L, Gordon JI. Diet-induced obesity is linked to marked but reversible alterations in the mouse distal gut microbiome. Cell Host Microbe 3: 213–223, 2008. doi: 10.1016/j.chom.2008.02.015. [DOI] [PMC free article] [PubMed] [Google Scholar]
- 61.Turnbaugh PJ, Ley RE, Mahowald MA, Magrini V, Mardis ER, Gordon JI. An obesity-associated gut microbiome with increased capacity for energy harvest. Nature 444: 1027–1031, 2006. doi: 10.1038/nature05414. [DOI] [PubMed] [Google Scholar]
- 62.Tuulari JJ, Karlsson HK, Antikainen O, Hirvonen J, Pham T, Salminen P, Helmiö M, Parkkola R, Nuutila P, Nummenmaa L. Bariatric surgery induces white and grey matter density recovery in the morbidly obese: a voxel-based morphometric study. Hum Brain Mapp 37: 3745–3756, 2016. doi: 10.1002/hbm.23272. [DOI] [PMC free article] [PubMed] [Google Scholar]
- 63.Valdearcos M, Robblee MM, Benjamin DI, Nomura DK, Xu AW, Koliwad SK. Microglia dictate the impact of saturated fat consumption on hypothalamic inflammation and neuronal function. Cell Reports 9: 2124–2138, 2014. doi: 10.1016/j.celrep.2014.11.018. [DOI] [PMC free article] [PubMed] [Google Scholar]
- 64.Valdearcos M, Xu AW, Koliwad SK. Hypothalamic inflammation in the control of metabolic function. Annu Rev Physiol 77: 131–160, 2015. doi: 10.1146/annurev-physiol-021014-071656. [DOI] [PubMed] [Google Scholar]
- 65.Vaughn AC, Cooper EM, DiLorenzo PM, O’Loughlin LJ, Konkel ME, Peters JH, Hajnal A, Sen T, Lee SH, de La Serre CB, Czaja K. Energy-dense diet triggers changes in gut microbiota, reorganization of gut–brain vagal communication and increases body fat accumulation. Acta Neurobiol Exp (Wars) 77: 18–30, 2017. [DOI] [PMC free article] [PubMed] [Google Scholar]
- 66.Veldhorst M, Smeets A, Soenen S, Hochstenbach-Waelen A, Hursel R, Diepvens K, Lejeune M, Luscombe-Marsh N, Westerterp-Plantenga M. Protein-induced satiety: effects and mechanisms of different proteins. Physiol Behav 94: 300–307, 2008. doi: 10.1016/j.physbeh.2008.01.003. [DOI] [PubMed] [Google Scholar]
- 67.Velloso LA, Araújo EP, de Souza CT. Diet-induced inflammation of the hypothalamus in obesity. Neuroimmunomodulation 15: 189–193, 2008. doi: 10.1159/000153423. [DOI] [PubMed] [Google Scholar]
- 68.Wan YY, Flavell RA. ‘Yin-Yang’ functions of transforming growth factor-β and T regulatory cells in immune regulation. Immunol Rev 220: 199–213, 2007. doi: 10.1111/j.1600-065X.2007.00565.x. [DOI] [PMC free article] [PubMed] [Google Scholar]
- 69.Willette AA, Kapogiannis D. Does the brain shrink as the waist expands? Ageing Res Rev 20: 86–97, 2015. doi: 10.1016/j.arr.2014.03.007. [DOI] [PMC free article] [PubMed] [Google Scholar]
- 70.Williams KW, Elmquist JK. From neuroanatomy to behavior: central integration of peripheral signals regulating feeding behavior. Nat Neurosci 15: 1350–1355, 2012. doi: 10.1038/nn.3217. [DOI] [PMC free article] [PubMed] [Google Scholar]
- 71.Williams LM. Hypothalamic dysfunction in obesity. Proc Nutr Soc 71: 521–533, 2012. doi: 10.1017/S002966511200078X. [DOI] [PubMed] [Google Scholar]
- 72.Wu GD, Chen J, Hoffmann C, Bittinger K, Chen YY, Keilbaugh SA, Bewtra M, Knights D, Walters WA, Knight R, Sinha R, Gilroy E, Gupta K, Baldassano R, Nessel L, Li H, Bushman FD, Lewis JD. Linking long-term dietary patterns with gut microbial enterotypes. Science 334: 105–108, 2011. doi: 10.1126/science.1208344. [DOI] [PMC free article] [PubMed] [Google Scholar]
- 73.Wu SV, Yuan PQ, Wang L, Peng YL, Chen CY, Taché Y. Identification and characterization of multiple corticotropin-releasing factor type 2 receptor isoforms in the rat esophagus. Endocrinology 148: 1675–1687, 2007. doi: 10.1210/en.2006-0565. [DOI] [PMC free article] [PubMed] [Google Scholar]
- 74.Yan J, Zhang H, Yin Y, Li J, Tang Y, Purkayastha S, Li L, Cai D. Obesity- and aging-induced excess of central transforming growth factor-β potentiates diabetic development via an RNA stress response. Nat Med 20: 1001–1008, 2014. doi: 10.1038/nm.3616. [DOI] [PMC free article] [PubMed] [Google Scholar]
- 75.Zhang H, DiBaise JK, Zuccolo A, Kudrna D, Braidotti M, Yu Y, Parameswaran P, Crowell MD, Wing R, Rittmann BE, Krajmalnik-Brown R. Human gut microbiota in obesity and after gastric bypass. Proc Natl Acad Sci USA 106: 2365–2370, 2009. doi: 10.1073/pnas.0812600106. [DOI] [PMC free article] [PubMed] [Google Scholar]
- 76.Zhao S, Liu W, Wang J, Shi J, Sun Y, Wang W, Ning G, Liu R, Hong J. Akkermansia muciniphila improves metabolic profiles by reducing inflammation in chow diet-fed mice. J Mol Endocrinol 58: 1–14, 2017. doi: 10.1530/JME-16-0054. [DOI] [PubMed] [Google Scholar]