

SUMMARY
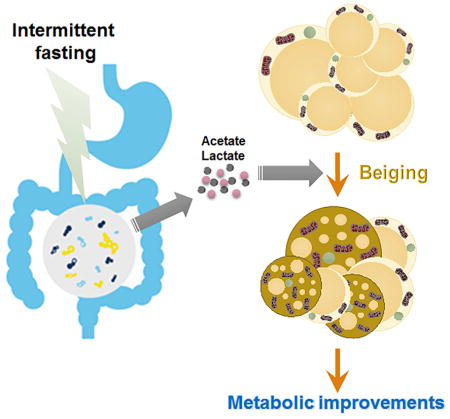
While activation of beige thermogenesis is a promising approach for treatment of obesity-associated diseases, there are currently no known pharmacological means to induce beiging in humans. Intermittent fasting is an effective and natural strategy for weight control, but the mechanism for its efficacy is poorly understood. Here, we show that an every other day fasting (EODF) regimen selectively stimulates beige fat development within white adipose tissue, and dramatically ameliorates obesity, insulin resistance and hepatic steatosis. EODF treatment results in a shift in the gut microbiota composition leading to the elevation of the fermentation products acetate and lactate, and the selective upregulation of monocarboxylate transporter 1 expression in beige cells. Microbiota-depleted mice are resistance to EODF-induced beiging, while transplantation of the microbiota from EODF-treated mice to microbiota-depleted mice activates beiging and improves metabolic homeostasis. These findings provide a new gut microbiota-driven mechanism for activating adipose tissue browning and treating metabolic diseases.
Keywords: intermittent fasting, every other day fasting (EODF), browning, beige adipocytes, gut microbiota, short chain fatty acid, metabolic syndrome, obesity
IN BRIEF
White adipose beiging is a promising therapy for obesity and related metabolic diseases. Here, Li, Xie et al. find that an EODF regimen can selectively induce the beiging of white adipose tissue and subsequently ameliorate metabolic disorders in mice. Gut microbiota orchestrate the effects EODF on beiging and metabolic improvement.
INTRODUCTION
Obesity and related metabolic disorders are growing health challenges for Western countries that mainly result from an imbalance between energy intake and energy expenditure (Hill et al., 2012; Hossain et al., 2007; Spiegelman and Flier, 2001). Emerging evidence suggests that non-shivering thermogenesis can re-establish energy balance and therefore counter the effects of elevated energy intake (Cannon and Nedergaard, 2011). This process is mediated primarily by the thermogenic activity of uncoupling protein 1 (UCP1) mainly in brown and beige fat cells (Harms and Seale, 2013; Kajimura et al., 2015). In this context, activating brown adipose tissue (BAT) or browning of white adipose tissue (WAT) could be a promising therapy for obesity and related metabolic diseases. Given current thinking that adult humans do not have active BAT (Kajimura et al., 2015; Nedergaard and Cannon, 2014), conversion of white fat to beige fat rather than BAT activation would hold more therapeutic potential. While many browning strategies have been described, mainly in rodent models, only a very limited number of them have so far supported selective browning of WAT (Bonet et al., 2013; Wu et al., 2013). Thus, the therapeutic potential associated with these approaches in a clinical setting is not yet clear.
Recently, intermittent fasting was demonstrated to optimize energy metabolism and promote health (Fontana and Partridge, 2015; Longo and Mattson, 2014). However, the mechanism for these benefits is unclear. Notably, one study found that time-restricted feeding can counteract obesity without reducing energy intake (Hatori et al., 2012). Although the perturbation of circadian rhythm was considered as a significant contributor to the increased energy expenditure (Hatori et al., 2012), the possibility exists that the white adipose browning would be a more direct mechanism. Therefore, in the current study, mice were placed on an every other day fasting (EODF) regimen to explore the effect on white adipose beiging and metabolic disorders. Evidence suggests that EODF selectively activates beige fat thermogenesis and ameliorates obesity-related metabolic diseases probably via the microbiota-beige fat axis.
RESULTS
EODF increased energy expenditure through non-shivering thermogenesis
To determine the adaptive metabolic changes in energy homeostasis induced by intermittent fasting, the effect of a 15-cycle EODF on body weight was first analyzed in mice fed chow diet. When compared with the ad libitum (AL) group, EODF did not affect cumulative food intake (Figure 1A), but reduced body mass gain (Figure 1B), indicative of lower metabolic efficiency and/or higher energy expenditure in EODF mice. To determine the fate of additional energy unaccounted for body mass gain, the masses of various body depots were analyzed. EODF significantly reduced fat mass, more specifically visceral epididymal WAT, while it did not change lean mass, and even increased the BAT mass (Figure 1C). These data indicate that EODF treatment might promote adaptive non-shivering thermogenesis and burning of fat. The circadian core body temperature measured rectally in EODF mice was higher than in the AL group (Figure 1D), as was the total energy expenditure (Figure 1E, S1), which suggests that the additional energy intake in EODF mice is released as heat. To determine the primary fuel utilized during this process, whole-body respiratory exchange ratios (RER) were assayed in one cycle of EODF. On the first day (“Fasted” day) of the RER assay, the RER of EODF-fasted mice was significantly lower than that of the AL mice, and nearly equal to 0.7 (Figure 1F, S1B), indicating that lipid utilization as a major energy fuel. Although on the second day (“Fed” day), when all mice were on feeding, the EODF mice had higher RER, their average RER in a whole EODF cycle was relatively lower than that in their AL counterparts (Figure 1F, S1B). These results indicate that the increased utilization of lipid, rather than carbohydrate, is responsible for the increased energy expenditure in EODF mice. Therefore, the EODF treatment appears to favor fat burning.
Figure 1. EODF treatment increases energy expenditure through WAT beiging.

(A) Cumulative food intake. n=14–16 mice/group.
(B) Body weight. n=14–16 mice/group.
(C) Normalized mass of body depots. n=7–8 mice/group.
(D) Circadian rectal temperature on fed day. n=14–16 mice/group.
(E–F) Daily total energy expenditure (E) and respiratory exchange ratio (F) during one cycle of EODF. On day 1 (“Fasted”), the EODF mice were fasted while the AL mice fed a chow diet. On day 2 (“Fed”), both groups had ad libitum access to chow. Data marked as “1 cycle” show the average value of the two days (“Fasted” plus “Fed”). n=4 mice/group.
(G) Representative image for inguinal WAT of AL(left) and EODF (right) mouse. Scale bar: 5 mm.
(H) Ucp1 mRNA expression in inguinal WAT in the fed state. n=7–8 mice/group.
(I) Representative H&E (upper) and UCP1 (lower) staining of inguinal WAT sections. Scale bar: 50 μm.
Data are presented as mean ± SEM. Different lowercase letters indicate different statistical significance by two-tailed unpaired t-test, a, p < 0.05; b, p < 0.01; c, p < 0.005; and d, p < 0.001 versus AL.
See also Figure S1–S5.
EODF selectively induces beiging of inguinal WAT but not activation of BAT
Non-shivering thermogenesis is mainly mediated by activating brown and/or beige adipocytes (Harms and Seale, 2013; Kajimura et al., 2015). Although the above data indicate a mild mass increase in the interscapular BAT in EODF mice (Figure 1C), Ucp1 expression was significantly suppressed (Figure S2A), and other thermogenic genes including peroxisome proliferator-activated receptor gamma coactivator 1-alpha (Pgc1a), and type II iodothyronine deiodinase (Dio2), were not upregulated in either the fed or fasted states of mice treated with EODF (Figure S2B,C). The mechanism by which EODF induces higher energy expenditure might differ from that of cold exposure, which is closely tied to β-AR signaling (Cypess et al., 2015; Mund and Frishman, 2013), while fasting is known to suppress norepinephrine turnover (Knehans and Romsos, 1983) and norepinephrine-induced thermogenesis in BAT (Hayashi and Nagasaka, 1983). In line with these data, EODF did not affect the expression of the β3-adrenergic receptor (Adrb3) mRNA in BAT in the fasted state, and suppressed it in the fed state (Figure S2D).
Intriguingly, and in contrast, EODF induced an obvious browning in subcutaneous (inguinal) WAT as indicated by tissue color (Figure 1G) and UCP1 expression (Figure 1H,I). Histological analysis of inguinal WAT in EODF mice also clearly revealed a significant increase in multilobular adipocytes (Figure 1I), which is a typical characteristic of beige adipocytes. Although the fold change of Ucp1 mRNA in the fasted state was relatively lower than in the fed state, the browning phenotype was still pronounced (Figure S3). To determine the washout period for EODF effect, the 15-cycle EODF-treated mice were placed back on AL feeding. The elevated Ucp1 mRNA levels in inguinal WAT were significantly diminished on the 7th day after returning to AL feeding, and fell to normal levels on the 15th day (Figure S4A). However, the effect of EODF on suppressing weight gain was sustained as the body weight gain was still significantly lower than the AL group on the 15th day (Figure S4B).
To examine the chronological relationship between WAT beiging and increased energy expenditure induced by EODF, the mice were exposed to short-term EODF. Following 3 cycles of EODF treatment, evident beiging in inguinal WAT was observed as indicated by a striking increase in Ucp1 mRNA expression (Figure S5A), while body weight or energy expenditure were not obviously changed yet (Figure S5B–D). These results suggest the effects of EODF on energy expenditure and weight loss are subsequent to its effect on WAT beiging.
The discrepancy of activation between brown and beige cells after EODF conditioning might be due to restricted β-AR-independent thermogenesis in subcutaneous WAT (Ye et al., 2013). The present data suggest that the EODF-induced browning might be independent of β-AR signaling, as EODF treatment significantly down-regulated expression of Adrb3 in both BAT and inguinal WAT under the fed state, and the trend was the same in fasted BAT and WAT (Figure S2D, S3). To further exclude the role of β-AR signaling, mice were acclimatized to thermoneutrality (30°C) for 1 day and then treated either AL or EODF over the entire period at 30°C. The EODF at 30°C still reduced body weight and fat mass, and induced pronounced inguinal WAT beiging as indicated by increased expression of Ucp1 mRNA, UCP1 protein, other beige fat thermogenic-associated markers and evident beige morphology (Figure 2A–E).
Figure 2. EODF induces inguinal WAT beiging independent of β-AR and FGF21 signaling.

(A) mRNA expression of thermogenic genes in inguinal WAT of mice under 30°C in the fed state. n= 10 mice/group.
(B) Body weight of mice before and after EODF treatment at 30°C. n= 10 mice/group.
(C) Fat mass of mice before and after EODF treatment at 30°C. n= 10 mice/group.
(D) Representative H&E staining of inguinal WAT sections from EODF (at 30°C) mice (right) and AL mice (left). Scale bar: 100 μm.
(E) Representative UCP1 immunohistochemical staining of inguinal WAT sections from EODF (at 30°C) mice (right) and AL mice (left). Scale bar: 100 μm.
(F–G) Liver Fgf21 mRNA expression (F) and serum FGF21 levels (G) of Ppara wild-type (Ppara+/+) and Pparα null (Ppara−/−) mice with or without EODF treatment in the fed state. n = 5 mice/group.
(H) mRNA expression of Ucp1 in inguinal WAT of Ppara+/+ and Ppara−/− mice with or without EODF treatment in the fed state. n = 5 mice/group.
(I) Serum acetate and lactate levels of mice at 30°C. n= 10 mice/group.
(J) mRNA expression of Mct1 in inguinal WAT of Ppara+/+ and Ppara−/− mice with or without EODF treatment in the fed state. n = 5 mice/group
(K) Serum acetate and lactate levels of Ppara+/+ and Ppara−/− mice with or without EODF treatment. n = 5 mice/group.
Data are presented as mean ± SEM. Different lowercase letters indicate statistical significance by two-tailed unpaired t-test, a, p < 0.05; c, p < 0.005; and d, p < 0.001. Black letters show the effects of EODF (EODF versus AL within the same strain), red letters the effects of Ppara knockout (Pparα−/− versus Ppara+/+ mice within the same treatment). SCFAs, short chain fatty acids.
EODF-induced WAT beiging independent of FGF21 signaling
In addition to β-AR signaling, FGF21 is another classical signaling hormone known to regulate WAT browning (Dutchak et al., 2012; Harms and Seale, 2013) and the adaptive fasting response (Inagaki et al., 2007). However, its expression or its correspondent receptor/obligate co-receptor expression levels in WAT were not altered after the EODF regimen (Figure S3). Liver-derived FGF21 is the most important contributor to circulating FGF21 levels and PPARα is a key regulator of hepatic FGF21 (Markan et al., 2014; Montagner et al., 2016). In addition, PPARα is known to mediate acute fasting-induced upregulation of both hepatic Fgf21 mRNA and circulating FGF21 protein levels (Montagner et al., 2016). Therefore, Ppara+/+ and Ppara−/− mice were used to examine the role of hepatic FGF21 in the beiging phenotype induced by the EODF regimen. Contrary to an acute fasting model, EODF in wild-type Ppara+/+ mice was associated with a modest decrease, not increase, in FGF21 expression (Figure 2F,G). Ppara−/− mice on AL had lower basal Fgf21 mRNA and circulating FGF21 protein levels (Figure 2F,G). As expected, the EODF regimen in Ppara−/− mice had no impact on either hepatic Fgf21 mRNA expression or circulating FGF21 levels (Figure 2F,G). EODF did however result in a corresponding increase in inguinal WAT Ucp1 mRNA when compared to Ppara−/− AL animals indicating a comparable beiging phenotype (Figure 2H); this increase was independent of changes in FGF21. Interestingly, WAT from Ppara−/− AL mice also exhibited elevated basal Ucp1 expression when compared to Ppara+/+ mice (Figure 2H). This suggests that loss of PPARα signaling promotes a modest increase in beiging in the absence of EODF. Taken together, these data indicate that EODF-induced inguinal WAT beiging does not appear to require FGF21.
Gut microbiota orchestrates EODF-induced WAT beiging
Recently, correlative evidence revealed a metabolic interaction between the gut microbial communities and the host, and gut bacteria have an important role in the regulation of brown and beige adipose tissues (Chevalier et al., 2015; Holmes et al., 2012; Mestdagh et al., 2012; Nicholson et al., 2012; Rooks and Garrett, 2016; Zietak et al., 2016). Previous studies revealed that fasting and feeding rhythms significantly alters the gut microbiota (Secor and Carey, 2016; Thaiss et al., 2014), and major changes in microbiota composition can directly promote WAT beiging (Chevalier et al., 2015). Therefore, it is reasonable to speculate that EODF might induce beiging by altering gut microbiota composition. To test this hypothesis, cecum microbiota community were profiled by 16S rRNA gene amplicon sequencing. EODF increased the length of the small intestine (Figure 3A) and caused clear alterations in the microbiota content as indicated by the generalized UniFrac distances (Figure 3B). Hierarchical clustering of individual species confirmed an effect of EODF on the gut microbiome (Figure 3C). According to a previous study (Chevalier et al., 2015), Firmicutes and Bacteroidetes are the most abundant phyla identified in healthy mice, which were also present in both EODF and AL groups. However, EODF significantly altered their relative abundance (Figure 3D). Moreover, significant differences were observed in Operational Taxonomic Unit (OTU) abundance at the phylum level in Firmicutes, Bacteroidetes, Actinobacteria and Tenericutes (Figure 3E). The EODF regimen increased the OTU abundance of Firmicutes, while decreasing most other phyla (Figure 3E). Notably, the ratio of Firmicutes/Bacteroidetes increased from 3.4 in AL mice to 8.9 in EODF mice. Intriguingly, mice with similar shifts in the ratio of Firmicutes/Bacteroidetes were reported to be associated with increased glucose uptake in inguinal WAT, but not in interscapular BAT (Chevalier et al., 2015). These data are consistent with the present results that EODF selectively induces beiging of inguinal WAT.
Figure 3. Gut microbiota mediates EODF induced WAT beiging.

(A) Length of small intestine of AL mice, EODF mice, mice transplanted with AL microbiota (AL/MT), and mice transplanted with EODF microbiota (EODF/MT). n=8 mice/group.
(B) UniFrac distances of AL and EODF mice. n=7–8 mice/group.
(C) Z-scores for genera between AL and EODF mice. n=7–8 mice/group.
(D) Hierarchical clustering diagram comparing ceca of AL and EODF mice. n=7–8 mice/group.
(E) Representative Phyla Operational Taxonomic Unit (OTU) abundance (%) of ceca of AL and EODF mice. n=7–8 mice/group.
(F) Ucp1 mRNA expression in inguinal WAT in the fed state. n= 8 mice/group.
Data are presented as mean ± SEM. Different lowercase letters indicate different statistical significance by two-tailed unpaired t-test (E) or one-way ANOVA with Bonferroni posttest (A, F), a, p < 0.05; b, p < 0.01; c, p < 0.005; and d, p < 0.001. Black letters versus AL, and green letters versus AL/MT.
See also Figure S6.
To investigate whether the EODF-induced microbial shift directly contributes to WAT beiging, microbiota from EODF and AL mice, referred as EODF microbiota and AL microbiota respectively, were transplanted to microbiota-depleted mice. Transplantation of EODF microbiota significantly upregulated inguinal WAT Ucp1 mRNA and increased small intestine length when compared to the mice transplanted with AL microbiota (Figure 3A and F). Notably, both the intestine length and Ucp1 mRNA expression in mice transplanted with AL microbiota also increased versus AL mice (Figure 3A and F), which is consistent with a previous report that the microbiota depletion promotes WAT beiging (Suarez-Zamorano et al., 2015). To explore whether the gut microbiota was necessary for EODF-induced beiging, EODF was performed on the microbiota-depleted mice. Indeed, EODF activated beiging only in control mice, but not in microbiota-depleted mice, although the microbiota depletion itself also induced WAT beiging (Figure S6A). Accordingly, the beneficial effects of EODF on several indices of metabolic function were also decreased when the gut microbiota was depleted (Figure S6B–G). Therefore, these findings suggest that the effects of EODF on inguinal WAT beiging might be mediated by the gut microbiota.
To further determine the potential mechanism by which gut microbiota influences EODF-induced beiging, 1H NMR-based metabolomics was carried out on cecal contents obtained from long-term and short-term EODF treated mice. In order to maximize the discrimination between AL and EODF mice, pairwise orthogonal projection to latent structure-discriminant analysis (OPLS-DA) was performed on normalized NMR data obtained from the cecal contents. Many metabolites changed after EODF treatment, including acetate, lactate, formate, bile acids, propionate, succinate, cytidine monophosphate (CMP), with noted lower levels of trimethylamine (TMA), uracil, and some amino acids including branch chain amino acids (BCAAs), glycine, tyrosine, histidine, and phenylalanine (Figure 4A,B). Among these molecules, acetate and lactate were both increased after EODF treatment after long-term and short-term EODFs (Figure 4C,D). Consistently, EODF treatment also elevated serum acetate and lactate levels (Figure 4C,D). Shotgun metagenomics sequencing analysis also showed that EODF upregulated the pathway of ‘Pyruvate fermentation to acetate and lactate by Lactobacillus reuteri’ and ‘Pyruvate fermentation to acetate and lactate by unclassified bacteria’ (Figure S7). Intriguingly, recent studies indicate both acetate and lactate are beiging inducers (Hanatani et al., 2016; Kim et al., 2017; Sahuri-Arisoylu et al., 2016). In addition, both BAT and WAT express proton-linked monocarboxylate transporter 1 (MCT1) encoded by Mct1, which drives acetate and lactate transport across the plasma membrane of adipocytes (den Besten et al., 2013; Iwanaga et al., 2009). Given recent evidence that the expression of Mct1 is controlled by physiological stimuli of beiging (Carriere et al., 2014; De Matteis et al., 2013), the selective upregulation of Mct1 was noted in inguinal WAT but not in BAT of both long-term and short-term EODF-treated mice (Figure 4E–G). The induction of Mct1 together with changes in serum acetate and lactate levels was abolished in microbiota-depleted mice and restored in mice transplanted with EODF microbiota (Figure S6H). Taken together, these data revealed that EODF primarily alters the gut microbiota composition to promote the generation of acetate and lactate, and subsequently, to induce inguinal WAT beiging. Moreover, neither thermoneutral condition nor the deficiency of PPARα abolished the effect of EODF on promoting the increase of Mct1 mRNA expression in inguinal WAT and of serum acetate and lactate levels (Figure 2A,I–K), supporting that the effect of EODF are independent of β-AR signaling or PPARα, but associated with gut microbiota-derived metabolites.
Figure 4. Microbiota metabolites underlie the mechanism of EODF-induced beiging.

(A) Orthogonal projection to latent structure-discriminant analysis (OPLS-DA) scores (left) and correlation coefficient-coded loadings plots for the models (right) from NMR spectra of cecal content aqueous extracts from mice after long-term EODF treatment. n= 7–8 mice/group.
(B) OPLS-DA scores (left) and correlation coefficient-coded loadings plots for the models (right) from NMR spectra of cecal content aqueous extracts from mice after short-term EODF treatment. n= 10 mice/group.
(C–D) Cecum and serum acetate (C) and lactate (D) levels from mice after long-term and short-term EODF treatment. n= 7–10 mice/group.
(E, F) mRNA expression of Mct1 in inguinal WAT (E) and BAT (F) from mice after long-term EODF treatment in the fed state. n= 7–8 mice/group.
(G) mRNA expression of Mct1 in inguinal WAT from mice after short-term EODF treatment in the fed state. n= 10 mice/group.
Data are presented as mean ± SEM. Different lowercase letters indicate statistical significance by two-tailed unpaired t-test, a, p < 0.05; b, p < 0.01; and d, p < 0.001 versus AL.
See also Figure S7.
EODF ameliorated metabolic syndrome in obese mice
Given that activation of beige cells can suppress obesity and metabolic disease (Harms and Seale, 2013), the effect of EODF regimen on diet-induced obesity (DIO) mice was explored. Mice were fed a HFD for 3 months and then subjected to the AL or EODF regimens (15 cycles). EODF mice displayed a pronounced weight loss in contrast to their AL counterparts without affecting the cumulative food intake (Figure 5A,B). EODF mice had dramatically lower body weights, which correlated with the number of EODF cycles (Figure 5C). Consistent with the above data that EODF upregulated Glut4 in lean mice (Figure S3), EODF also increased inguinal WAT Glut4 mRNA expression and thus improved insulin sensitivity in DIO mice (Figure 5D,E). Moreover, liver steatosis and injury markers in EODF mice were obviously ameliorated (Figure 5F). EODF resulted in a significant reduction of inguinal fat mass than that of epididymal fat mass (Figure 5G). Thus, EODF could differentially impact visceral and subcutaneous fat depots.
Figure 5. EODF ameliorates metabolic dysfunction in DIO mice.

(A) Representative AL and EODF mouse. Scale bar: 5 mm.
(B) Cumulative food intake.
(C) Body weight.
(D) mRNA expression of thermogenic genes in inguinal WAT in the fed state.
(E) Glucose tolerance test.
(F) Liver function.
Upper left, representative image of livers from AL mouse (left) and EODF mouse (right). Scale bar: 5 mm.
Middle left, liver triglycerides.
Lower left, serum ALT.
Right, representative H&E staining of liver sections from AL (upper) and EODF(lower) mice.
Scale bar: 100 μm.
(G) Fat depot mass.
(H) mRNA expression of thermogenic genes in interscapular BAT in the fed state.
Data are presented as mean ± SEM. n=6 mice/group. Different lowercase letters indicate different statistical significance by two-tailed unpaired t-test, a, p < 0.05; b, p < 0.01; c, p < 0.005; and d, p < 0.001 versus AL.
BAT and inguinal WAT gene expression in DIO mice in response to the EODF regimen displayed a similar trend with those in lean mice. Ucp1 and Pgc1a mRNAs upregulation only occurred in inguinal WAT, but not BAT, of EODF mice (Figure 5D, H). The mRNAs encoding β-AR, and FGF21 signaling-related receptors were not altered (Figure 5D). These results hint that EODF-induced WAT beiging might be involved in its beneficial effects on obesity-associated metabolic syndrome in DIO mice.
Gut microbiota contributes to the beneficial effects of EODF on DIO mice
Gut microbiota plays a critical role in energy metabolism and lipid homeostasis, and germfree or microbiota-depleted rodents have decreased susceptibility to diet-induced obesity and metabolic syndrome (Backhed et al., 2007; Rabot et al., 2010; Suarez-Zamorano et al., 2015). Based on the above findings, EODF treatment could alter the microbiota compositions and prevent HFD-induced obesity and metabolic disorders. To further clarify the role of gut microbiota in mediating the beneficial effects of EODF regimen on metabolic diseases, the effect of EODF in control and microbiota-depleted DIO mice was compared. EODF treatment significantly reduced obesity and hepatic steatosis, and improved insulin sensitivity in control mice, but not in microbiota-depleted mice (Figure 6A–G), indicating that the effects of EODF depends on gut microbiota. To examine whether gut microbiota is sufficient to replicate the effects of EODF, microbiota-depleted DIO mice were transplanted with AL microbiota and EODF microbiota, respectively. Compared with the AL microbiota-transplanted group, EODF microbiota transplantation did mimic all the beneficial effects of EODF treatment on metabolic dysfunctions (Figure 6A–H). Moreover, in line with the above results from lean mice, EODF-induced inguinal WAT beiging only occurred in control DIO mice, but not in their microbiota-depleted counterparts (Figure 7A). EODF microbiota transplantation to DIO mice promoted inguinal WAT Ucp1 mRNA and UCP1 protein expression, increased multilobular adipocytes and enhanced energy expenditure with lower RER (Figure 7B–F). Accordingly, elevated serum acetate and lactate levels and inguinal WAT Mct1 mRNA by EODF treatment were abolished by microbiota depletion but restored by EODF microbiota transplantation (Figure 7A,B,G,H). These findings underscore an important role for gut microbiota in the beneficial effects of EODF on WAT beiging and the subsequent improvements in metabolic diseases.
Figure 6. Gut microbiota mediates the effects of EODF on metabolic syndrome in DIO mice.

(A) Body weight. Before EODF or microbiota transplantation (MT) treatment, all mice were given access to control vehicle (CV) water or water supplemented with an antibiotics cocktail (AB) for 4 weeks. n=6–8 mice/group.
(B) Fat mass. n=6–8 mice/group.
(C) Serum ALT. n=6–8 mice/group.
(D) Liver triglycerides. n=6–8 mice/group.
(E) Representative H & E staining of liver sections. Scale bar: 100 μm.
(F–G) Glucose tolerance test in CV-treated (F) or AB-treated (G) mice. n=6 mice/group.
(H) Glucose tolerance test in MT mice receiving microbiota from AL (AL/MT) or EODF donors (EODF/MT). n= 8 mice/group.
Data are presented as mean ± SEM. Different lowercase letters indicate statistical significance by two-tailed unpaired t-test, a, p < 0.05; b, p < 0.01; c, p < 0.005; and d, p < 0.001. Black letters show the effects of EODF or EODF/TM (EODF versus AL, or EODF/MT versus AL/MT with access to the same water).
Figure 7. Gut microbiota mediates the effects of EODF on inguinal WAT beiging in DIO mice.

(A, B) mRNA expression of thermogenic genes in inguinal WAT in the fed state. All mice were given access to control vehicle (CV) water or water supplemented with an antibiotics cocktail (AB) for 4 weeks, and then treated with AL or EODF (A) or microbiota transplantation (MT, B). n=6–8 mice/group.
(C) Representative H & E staining of inguinal WAT from mice transplanted with EODF microbiota (EODF/MT, right) and AL microbiota (AL/MT, left). Scale bar: 100 μm.
(D) Representative UCP1 immunohistochemical staining of inguinal WAT sections from EODF/MT (right) and AL/MT (left) mice. Scale bar: 100 μm.
(E, F) Daily total energy expenditure (E) and respiratory exchange ratio (F) of AL/MT and EODF/MT mice. n=6 mice/group.
(G, H) Serum acetate (G) and lactate (H) of DIO mice after EODF or MT treatment. Before EODF or MT treatment, all mice were given access to CV or AB water for 4 weeks. n=6–8 mice/group.
Data are presented as mean ± SEM. Different lowercase letters indicate statistical significance by two-way ANOVA with Sidak multiple comparisons (A) or two-tailed unpaired t-test (B, E–H), a, p < 0.05; c, p < 0.005; and d, p < 0.001. Black letters show the effects of EODF or EODF/MT (EODF versus AL, or EODF/MT versus AL/MT drunk with the same water), red letters the effects of microbiota depletion (AB versus CV within the same feeding regimen).
DISCUSSION
In this study, EODF was found to substantially induce beiging in subcutaneous inguinal WAT. Although many agents and treatments were reported to induce browning (Bonet et al., 2013; Jiang et al., 2015; Wu et al., 2013), it is unclear how these approaches can translate to clinically-relevant therapies for human metabolic disease (Nedergaard and Cannon, 2014). In contrast, intermittent fasting (including EODF) has been practiced in humans, especially in certain religious groups (Patterson et al., 2015), for centuries, and has proven to benefit body composition and health (Eshghinia and Mohammadzadeh, 2013; Lopez-Bueno et al., 2014; Patterson et al., 2015). To date, few studies have looked at whether this regimen can induce WAT beiging. Most fasting-related studies have focused on BAT but not subcutaneous WAT and found that fasting both suppresses BAT UCP1 expression and norepinephrine-induced thermogenesis (Desautels and Dulos, 1988; Hayashi and Nagasaka, 1983; Sivitz et al., 1999). In support of these finding, results from the current study identified lower Ucp1 and Adrb3 mRNA expression in BAT of EODF mice. However, this is not the case in subcutaneous WAT, as revealed in the current study; UCP1 expression was dramatically upregulated after intermittent fasting.
A striking finding from this study is that EODF selectively activates beige but not brown adipocytes. Cold acclimation was originally found to increase the number of brown adipocytes in the parametrical fat pad in mice (Young et al., 1984). Since that finding, more than a hundred alternate treatments have been shown to activate both brown and beige adipose (Bonet et al., 2013; Wu et al., 2013). Brown adipocyte activation by cold exposure or β-AR agonists is clinically non-feasible, and adult human BAT is largely composed of beige-like adipocytes (Shinoda et al., 2015). Therefore, understanding the underlying mechanisms driving the selective beiging of certain white depots during EODF could reveal new therapeutic targets for the prevention and treatment of metabolic disease, which might provide alternative pharmaceutical options for those who cannot sustain intermittent fasting for long periods of time.
Implicit in the present findings is that gut microbiota mediates the mechanism of EODF-induced beiging. Despite the many proposed mechanisms for adipose browning, β-AR signaling is still the prototypical pathway and currently the most intensely studied (Robidoux et al., 2004; Susulic et al., 1995). While BAT activation mainly depends on the β-AR signaling, the browning of subcutaneous WAT under certain conditions might be independent of β-AR signaling (Ye et al., 2013). Consistently, EODF only activated subcutaneous WAT, but not BAT, and the mechanism for EODF-induced beiging might be independent of the β-AR signaling. Recent studies have shown interactions between the host and gut microbiota affect many aspects of energy metabolism (Takeda, 2016). The microbiome influences cold-induced adipose beiging and modulates metabolic syndrome and other diseases (Chevalier et al., 2015; Holmes et al., 2012; Suarez-Zamorano et al., 2015). Intriguingly, EODF alters gut microbe composition in a similar way as a previous report that supports a causal role of microbiota in WAT beiging (Chevalier et al., 2015). Transplantation of EODF microbiota to microbiota-depleted mice promoted beiging of inguinal WAT, while EODF cannot induce beiging in the absence of gut microbiota, suggesting that gut flora is required for EODF-induced WAT beiging. It should be noted that microbiota-depleted mice were established by antibiotics treatment in the current study. We cannot exclude the possibility that some metabolic changes may due to the absorbed fraction of antibiotics.
Another important finding from the present study is that EODF causes dramatic weight loss and attenuates metabolic dysfunction in mice by directly activating beige cells through shaping gut microbiota. A recent report revealed that restricting feeding periods prevents HFD-induced weight gain and metabolic syndrome without reducing total caloric intake, and these effects were attributed to alterations in circadian rhythms (Hatori et al., 2012). The present work revealed that EODF treatment also does not affect cumulative food intake, thus demonstrating that weight loss may result from increased energy expenditure. Conversely, EODF treatment did not appear to affect circadian rhythms, as rectal temperature profiles and metabolic curves in EODF animals paralleled those of the AL control groups. Therefore, the mechanism for EODF-induced weight loss does not appear to be the result of circadian perturbation. On the other hand, the prominent function of activated beige cells is to promote thermogenesis and suppresses obesity (Ishibashi and Seale, 2010; Shabalina et al., 2013; Wu et al., 2012). The present study reveals pronounced beiging of inguinal WAT, and the mechanism for this EODF-induced improvement in metabolic syndrome could be, at least in part, attributed to increased thermogenesis as a result of WAT beiging. Moreover, consistent with an important role for gut microbiota in inducing beiging, EODF microbiota transplantation can reproduce the effects of EODF regimen, and EODF fails to further improve obesity-related diseases in microbiota-depleted mice.
In summary, the present work uncovered novel perspectives on beige-fat development in the inguinal WAT. EODF was shown to selectively activate beige fat probably by re-shaping the gut microbiota leading to increased beiging stimuli acetate and lactate. EODF also dramatically ameliorated metabolic syndrome in a mouse model of obesity. This alternative beige fat activation by EODF offers new insights into the microbiota-beige fat axis and provides a novel therapeutic approach for the treatment of obesity-related metabolic disorders.
STAR METHODS
Detailed methods are provided in the online version of this paper and include the following:
KEY RESOURCES TABLE
| REAGENT or RESOURCE | SOURCE | IDENTIFIER |
|---|---|---|
| Antibodies | ||
| rabbit polyclonal anti-UCP1 | Abcam | Cat# ab10983; RRID: AB_2241462 |
| Bacterial and Virus Strains | ||
| Biological Samples | ||
| Chemicals, Peptides, and Recombinant Proteins | ||
| bacitracin | Sigma-Aldrich | Cat# B0125; CAS: 1405-87-4 |
| gentamycin | Sigma-Aldrich | Cat# G1914; CAS: 1405-41-0 |
| ciprofloxacin | Sigma-Aldrich | Cat# 17850; CAS: 85721-33-1 |
| neomycin | Sigma-Aldrich | Cat# N6386; CAS: 1405-10-3 |
| penicillin | Sigma-Aldrich | Cat# A70909; CAS: 551-16-6 |
| metronidazole | Sigma-Aldrich | Cat# M1547; CAS: 443-48-1 |
| ceftazidime | Sigma-Aldrich | Cat# C3809; CAS: 120618-65-7 |
| streptomycin | Sigma-Aldrich | Cat# 46754; CAS: 3810-74-0 |
| vancomycin | Sigma-Aldrich | Cat# v2002; CAS: 1404-93-9 |
| Normal rabbit IgG | Santa cruz | Cat#SC-2027 |
| Critical Commercial Assays | ||
| ALT assay kit | Catachem Inc | Cat# V165-12 |
| Mouse FGF21 ELISA Kit | R&D Systems | Cat# MF2100 |
| Wako Clinical Diagnostics kits | Wako Life Sciences, Inc | Cat# 994-02891/992-02892; Cat# 990-02991/998-02992; Cat# 464-01601 |
| E.Z.N.A.® Stool DNA Kit | OMEGA bio-tek | Cat# D4015-02 |
| Deposited Data | ||
| 16S rRNA sequencing data | SRA | accession number # PRJNA398633 |
| Experimental Models: Cell Lines | ||
| Experimental Models: Organisms/Strains | ||
| Mouse: C57BL/6 | Charles River Laboratories | Strain Code: 027 |
| Mouse: Ppara wild-type (Ppara+/+): C57BL/6 | (Lee et al., 1995) | N/A |
| Mouse: Ppara-null (Ppara−/−): C57BL/6 | (Lee et al., 1995) | N/A |
| Mouse: Ppara floxed (Pparafl/fl): C57BL/6 | Brocker et al., 2017 | N/A |
| Oligonucleotides | ||
| Primers for qPCR, see Table S1 | This paper | N/A |
| Recombinant DNA | ||
| Software and Algorithms | ||
| GraphPad Prism 7.0 | http://www.graphpad.com/ | N/A |
| SIMCA-P+ software 13.0 | http://umetrics.com/ | N/A |
| MATLAB | The Mathworks Inc | N/A |
| MATLAB Script and Data | R script and data for key statistical results | Available upon request to the Lead Contact. |
| Other | ||
CONTACT FOR REAGENT AND RESOURCE SHARING
Further information and requests for resources and reagents should be directed to and will be fulfilled by the Lead Contact, Frank J. Gonzalez (gonzalef@mail.nih.gov), following an approved Material Transfer Agreement between the National Cancer Institute and the receiving institution.
EXPERIMENTAL MODEL DETAILS
Animals
All mouse studies were approved by the NCI Animal Care and Use Committee and performed in accordance with the Institute of Laboratory Animal Resources guidelines. Six-week-old male C57BL/6N mice were purchased from Charles River Laboratories. The Ppara wild-type (Ppara+/+) and conventional Ppara-null (Ppara−/−) mice on a pure C57BL/6N background used in this study were described previously (Lee et al., 1995). Mice were housed in a temperature (22°C)- and light-controlled vivarium with free access to water and standard rodent chow food or high fat diet (HFD) (S3282 from Bio-Serv). All experiments were started with 7- to 8-week-old mice.
METHOD DETAILS
EODF treatment
Mice were randomly grouped to ad libitum (AL) group and every other day fasting (EODF) group. All mice were co-housed (2 mice per cage) on chow diet or single housed on HFD for 2 weeks prior to study initiation to allow for acclimation to the animal facility and were then placed on chow diet or HFD. Under the chow diet, the AL group mice were allowed unrestricted access to food, while EODF groups were fed with alternating 24 h periods (15 cycles for long-term study and 3 cycles for short-term study) of free access to food followed by 24 h fasting. Under the HFD, mice were allowed unrestricted access to HFD for 3 months to induce an obese phenotype then randomly separated into AL and EODF groups and subjected to the AL or EODF feeding regimen (15 cycles). For EODF at thermoneutrality, mice were acclimatized to thermoneutrality (30°C) for 1 day and then treated either AL or EODF over the entire period at thermoneutrality (30°C) condition. Body weight was measured daily. Food intake was calculated daily quantifying the weight of the remaining food. Data were normalized to the body weight of the mice.
Gut microbiota transplantation
Microbiota transplantation were done according to a previous study (Chevalier et al., 2015). In brief, fresh antibiotics (1 mg/ml bacitracin, 170 mg/ml gentamycin, 125 mg/ml ciprofloxacin, 100 mg/ml neomycin, 100 U/ml penicillin, 100 mg/ml metronidazole, 100 mg/ml ceftazidime, 50 mg/ml streptomycin and 50 mg/ml vancomycin, Sigma) were added into the drinking water of mice, and changed once a week. After 4 weeks of antibiotics treatment, the antibiotics-containing water was replaced with the regular water. The microbiota-depleted mice were co-housing with AL or EODF donor animals on the fed day and kept in the donors’ cages on the fasted day for four days, and then transplanted with AL or EODF microbiota by gavaging with 20 mg fresh feces from donors re-suspended in 400 μl sterile anaerobic PBS. Following transplantation, the mice were co-housed with AL or EODF donor animals on the fed day and kept in the donors’ cages on the fasted day for another 10 days. Then, animals were euthanized and tissues collected.
Gut microbiota profiling
Bacteria from cecal contents were extracted with the E.Z.N.A stool DNA kit (OMEGA bio-tek) according to the protocol provided. Extracted DNA was measured by Nanodrop and aliquots were taken to provide a final concentration of 20 ng/μl for each DNA sample. PCR analysis was performed on the aliquoted DNA using the V4-V4 primer set. PCR mixtures were initially heated to 94°C for 3 min, followed by 20 cycles of 94°C for 15 s, 55°C for 45 s, and 72°C for 60 s. Reactions were completed at 72°C for 8 minutes. The PCR products were analyzed by running 5 μl of the product on a 1% agarose gel and found to average of 350 base pairs. PCR products were sent to the Penn State Genomics Core Facility (University Park, PA) for library preparation. Paired end sequencing was performed on the Illumina Miseq platform, and the sequencing results sent back for analysis. 16S rRNA gene amplicon sequence results were analyzed using the MOTHUR platform (Kozich et al., 2013) and aligned to SILVA and Green Genes databases separately. Analysis to the SILVA database provided data for GUnifrac analysis. A phylogenic tree and Operation Taxonomic Unit (OTU) table were obtained from the Mothur Bayesian classifier (Kozich et al., 2013) and uploaded to R studio for GUnifrac analysis (Chen et al., 2012). After Green Genes alignment, a .biom file was created and uploaded onto the Huttenhower galaxy page. PICRUSt analysis was done on the .biom file resulting in a pathway abundance file (Langille et al., 2013). LEfSe (Segata et al., 2011) was used to obtain statistically significant and biologically relevant pathways from pathway abundance file.
Cecal NMR metabolomics
The cecal content samples for NMR was prepared as previously described (Tian et al., 2012). 1H NMR spectra were recorded at 298 K on a Bruker Avance III 600 MHz spectrometer equipped with an inverse cryogenic probe (Bruker Biospin, Germany). NMR spectra of all the cecal content samples were acquired for each employing the first increment of NOESY pulse sequence (NOESYPR1D) with the recycle delay (RD) of 2 s and mixing time (tm) of 100 ms. The 90° pulse length was adjusted to about 10 μs for each sample and 64 transients were collected into 32 k data points for each spectrum with spectral width of 20 ppm. The chemical shift of 1H NMR spectra were referenced to TSP at δ 0.00. Each bucketed region (0.004 ppm) was then normalized to the total sum of the spectral integrals prior to statistical data analysis. Orthogonal projection to latent structure-discriminant analysis (OPLS-DA) were carried out using the SIMCA-P+ software (Version 13.0, Umetrics, Sweden). Back-transformed loadings from the OPLS-DA models were performed with color-coded correlation coefficient for variables, using an in-house developed script for MATLAB (The Mathworks Inc., Natwick, MA). The metabolites were assigned based on the published data and confirmed with a series of 2D NMR experiments (Tian et al., 2012). The relative contents of lactate at δ 1.33 and acetate at δ 1.92 were calculated against the total sum of the spectral integrals.
Gut bacteria metagenomic assay
Bacteria from cecal contents were extracted with the E.Z.N.A stool DNA kit (OMEGA bio-tek) according to the protocol provided by the manufacturer. Bacterial extracts were measured with nanodrop and raw bacterial isolation samples were transferred to the Pennsylvania State University Genomics Core Facility for Illumina Hiseq shotgun metagenomic sequencing (150x150 paired end). The TruSeq DNA PCR free kit was used to prepare libraries for metagenomic analysis. The Humann2 (Abubucker et al., 2012) pipeline was used for functional pathway discovery on the samples. This pipeline uses the MetaPlAn 2 (Truong et al., 2015) software to assign taxonomic information to the Hiseq reads being sequenced. Assigned reads were piped into Bowtie2 (Langmead and Salzberg, 2012) which provided functional information to the taxonomic assigned reads with the ChocoPhlAn database. Unassigned reads were piped into DIAMOND which converts the DNA reads into protein sequences and aligns them to a protein database to obtain functional information (Buchfink et al., 2015). Results from DIAMOND and results from Bowtie 2 are piped into the core algorithms of Humann2 which results in a gene families file, a pathway coverage file, and a pathway abundance file. Pathways with coverage below 30% were be removed from further analysis. LEfSE (Segata et al., 2011) was be used to obtain biological relevance and statistical significance from the functional information. A student’s t test was be used concordantly to obtain significance.
Serum lactate and acetate determination
Gas chromatography–mass spectrometry (GC–MS) analysis was performed with an Agilent 6890N gas chromatograph coupled to an Agilent 5973 mass-selective detector (Agilent Technologies, Santa, CA). Data processing were conducted with Agilent mass hunter work station software (Agilent Technologies). For lactate, serum was prepared and analyzed as previously described by GC–MS (Patel et al., 2017). For acetate quantification, serum was spiked with 2-butynioc acid (internal standard, 10 μM) in acetonitrile. The samples were centrifuged at 20,000g for 10 min at 4°C and the supernatants were dried in a SpeedVac concentrator at room temperature. The residue was dissolved in methanol : H2O (80:20, v/v, pH 2–3) and injected into the GC–MS.
Body composition and indirect calorimetry
Body fat and lean mass of non-anesthetized live mice were determined using an EchoMRI 3-in-1 mouse scanner (EchoMRI, Houston, TX) following manufacturer’s protocol. Indirect calorimetry was performed on mice after 14 cycles of EODF treatment using a 12-chamber Environment Controlled CLAMS (Columbus Instruments, Columbus, OH) with one mouse/chamber as previously described (Abreu-Vieira et al., 2015). After 48-h acclimatization, mice were monitored for 24 h at feeding state and then 20 h at fasting state for recording data. During testing, water was provided ad libitum. Locomotor activity was determined at the same time as energy expenditure was measured using infrared beam interruption.
Glucose tolerance test
Mice were fasted for 6 h, and fasted glucose was measured using a Glucometer (Bayer, Pittsburgh, PA) by tail bleeds. Then mice were intraperitoneally injected with 2 g glucose/kg of body weight, and blood glucose was measured at intervals of 20 min for 2 hrs.
Lipid analysis
For analysis of liver lipid content, 20 mg of frozen liver was homogenized by Tissuelyser-96 (Shanghai Jingxin Co. Ltd, Shanghai, China) in 400 μl of 50 mM Tris with 5% Triton-X 100, and then the samples were heated to 80–100 °C and cooled to room temperature (repeated twice). After centrifugation supernatants were diluted 10 fold and quantified using Wako Clinical Diagnostics kits (Wako USA, Richmond, VA).
Serum aminotransferase assay
Serum alanine aminotransferase (ALT) were assessed in a 96-well microplate using a commercial ALT assay kit (Catachem, Bridgeport, CT), and monitored at 340 nm for 10 min with a microplate reader (BioAssay Systems, Harvard, CA).
Serum FGF21 assay
Serum fibroblast growth factor 21 (FGF21) were assessed in a 96-well microplate using a mouse/rat FGF21 quantikine ELISA kit (R&D Systems), and read at 450 nm with a microplate reader.
Real-time PCR
Total RNA was extracted from frozen tissues using TRIzol reagent according to the manufacturer’s instructions. The purity and concentration of the total RNA were determined by a NanoDrop spectrophotometer (ND-1000, Thermo Fisher). Fifty ng of total RNA was reverse transcribed using cDNA Synthesis SuperMix (Biotool.com). Real-time PCR was carried out in an ABI 7900HT Fast Real-Time PCR System (AB Applied Biosystems, Warrington, UK) with SYBR Green PCR master mix (AB Applied Biosystems) and gene-specific primers. The sequence and Genbank accession number for the forward and reverse primers used to quantify mRNA were listed in the Supplementary table 1. The following conditions were used for real-time PCR: 95°C for 10min, then 95°C for 15 sec and 60°C for 1 min in 40 cycles. The 2−Δ ΔCT method was used to analyze the relative changes in gene expression normalized against 18S rRNA expression.
H&E and immunohistochemistry staining
All tissues were fixed in 4% paraformaldehyde for 24 h at room temperature, dehydrated and embedded into paraffin. Then tissues were sectioned into thick slices (4 μm) and stained with hematoxyline and eosin (H&E). For immunohistochemistry, slides were at first rinsed with 0.05 % Triton-X 100 in PBS, and non-specific binding sites were blocked using 1% bovine serum albumin (BSA) in PBS containing 0.05% Tween 20. Epitope retrieval was carried out using autoclave (15 min in citrate buffer, pH 6.0). After cooling to room temperature, the slides were incubated overnight at 4°C with rabbit polyclonal a nti-UCP1 primary antibody (ab10983; Abcam) diluted 1:500 in PBS containing 1% BSA. The slides were rinsed in distilled water, followed by treating with HRP-conjugated goat anti-rabbit IgG using the ABC method with a commercially available kit (Vector Laboratories, Burlingame, CA) according to the manufacturer’s instruction. Immunovisualization was carried out with 3, 3′-diaminobenzidine (DAB) as substrate (Sigma), and counterstained with hematoxylin. Slide digital images were collected at 10–40× magnification with a KEYENCE BZ-X710 Fluorescence Microscope (Keyence Inc., Itasca, IL). Images shown are representative results of at least three biological replicates.
QUANTIFICATION AND STATISTICAL ANALYSIS
Statistical analysis
All results are expressed as means ± SEM. Computations assumed that all groups were samples from populations with the same scatter. The investigators involved in this study were not completely blinded during sample collection or data analysis in the animal experiments. Outliers were identified by outlier analysis using the ROUT method (Prism 7.0 software, GraphPad Software, San Diego, CA) and excluded from statistical analyses. Significance was determined by (multiple) two-tailed unpaired t-test, one-way ANOVA with Bonferroni posttest, or two-way ANOVA with Sidak multiple comparisons using Prism 7.0 software. A P value of <0.05 was considered significant.
DATA AND SOFTWARE AVAILABILITY
MATLAB Script and Data
The MATLAB script and associated data (which were used to make the back-transformed loading graphs in Figure 4A,B) will be provided upon request to the Lead Contact.
Supplementary Material
HIGHLIGHTS.
EODF is a novel strategy for beige adipose development.
EODF selectively induces WAT beiging by reshaping gut microbiota.
EODF reverses high-fat diet-induced obesity and associated metabolic disorders.
The microbiota-fat axis orchestrates EODF-induced metabolic improvement.
Acknowledgments
We thank Linda G. Byrd for technical assistance with the mouse studies. Thanks to Dongxue Sun, Jiang Yue, Jie Zhao, Lei Chen, Qiao Wang, Qiong Wang, Qiu Wang, Weiwei Liu, Xiaoxia Gao, Xianqiong Gong, Yoshinori Takizawa, Youbo Zhang, and Yuhong Luo for help with the mouse studies. This work was funded by the National Cancer Institute Intramural Research Program, the National Institutes of Environmental Health Sciences (ES022186, to A.D. P.), the National Natural Science Funds of China (31271257, 9164910027, 81403007), the Science and Technology Project of Hunan Province (2013FJ2001), and the Cooperative Innovation Center of Engineering and New Products for Developmental Biology of Hunan Province (20134486). G.L. was supported by the fellowship from the Chinese Scholarship Council (201406725005). The funding sponsors had no role in the design, in the collection, analysis, and interpretation of data, in the writing of the manuscript, and in the decision to submit the manuscript for publication.
Footnotes
AUTHOR CONTRIBUTIONS
G.L., C.X., S.L., R.N., Y.T., C.N.B., D.P., Y.M., T.Y., L.L., K.W.K, and O.G. performed the research and analyzed the data. G.L., C.X., R.X., O.G. A.D.P. and F.J.G. designed and supervised the research. G.L., C.X., and F.J.G. wrote the manuscript.
Publisher's Disclaimer: This is a PDF file of an unedited manuscript that has been accepted for publication. As a service to our customers we are providing this early version of the manuscript. The manuscript will undergo copyediting, typesetting, and review of the resulting proof before it is published in its final citable form. Please note that during the production process errors may be discovered which could affect the content, and all legal disclaimers that apply to the journal pertain.
References
- Abreu-Vieira G, Xiao C, Gavrilova O, Reitman ML. Integration of body temperature into the analysis of energy expenditure in the mouse. Mol Metab. 2015;4:461–470. doi: 10.1016/j.molmet.2015.03.001. [DOI] [PMC free article] [PubMed] [Google Scholar]
- Abubucker S, Segata N, Goll J, Schubert AM, Izard J, Cantarel BL, Rodriguez-Mueller B, Zucker J, Thiagarajan M, Henrissat B, et al. Metabolic reconstruction for metagenomic data and its application to the human microbiome. PLoS Comput Biol. 2012;8:e1002358. doi: 10.1371/journal.pcbi.1002358. [DOI] [PMC free article] [PubMed] [Google Scholar]
- Backhed F, Manchester JK, Semenkovich CF, Gordon JI. Mechanisms underlying the resistance to diet-induced obesity in germ-free mice. Proc Natl Acad Sci U S A. 2007;104:979–984. doi: 10.1073/pnas.0605374104. [DOI] [PMC free article] [PubMed] [Google Scholar]
- Bonet ML, Oliver P, Palou A. Pharmacological and nutritional agents promoting browning of white adipose tissue. Biochim Biophys Acta. 2013;1831:969–985. doi: 10.1016/j.bbalip.2012.12.002. [DOI] [PubMed] [Google Scholar]
- Buchfink B, Xie C, Huson DH. Fast and sensitive protein alignment using DIAMOND. Nat Methods. 2015;12:59–60. doi: 10.1038/nmeth.3176. [DOI] [PubMed] [Google Scholar]
- Cannon B, Nedergaard J. Nonshivering thermogenesis and its adequate measurement in metabolic studies. J Exp Biol. 2011;214:242–253. doi: 10.1242/jeb.050989. [DOI] [PubMed] [Google Scholar]
- Carriere A, Jeanson Y, Berger-Muller S, Andre M, Chenouard V, Arnaud E, Barreau C, Walther R, Galinier A, Wdziekonski B, et al. Browning of white adipose cells by intermediate metabolites: an adaptive mechanism to alleviate redox pressure. Diabetes. 2014;63:3253–3265. doi: 10.2337/db13-1885. [DOI] [PubMed] [Google Scholar]
- Chen J, Bittinger K, Charlson ES, Hoffmann C, Lewis J, Wu GD, Collman RG, Bushman FD, Li H. Associating microbiome composition with environmental covariates using generalized UniFrac distances. Bioinformatics. 2012;28:2106–2113. doi: 10.1093/bioinformatics/bts342. [DOI] [PMC free article] [PubMed] [Google Scholar]
- Chevalier C, Stojanovic O, Colin DJ, Suarez-Zamorano N, Tarallo V, Veyrat-Durebex C, Rigo D, Fabbiano S, Stevanovic A, Hagemann S, et al. Gut Microbiota Orchestrates Energy Homeostasis during Cold. Cell. 2015;163:1360–1374. doi: 10.1016/j.cell.2015.11.004. [DOI] [PubMed] [Google Scholar]
- Cypess AM, Weiner LS, Roberts-Toler C, Franquet Elia E, Kessler SH, Kahn PA, English J, Chatman K, Trauger SA, Doria A, et al. Activation of human brown adipose tissue by a beta3-adrenergic receptor agonist. Cell Metab. 2015;21:33–38. doi: 10.1016/j.cmet.2014.12.009. [DOI] [PMC free article] [PubMed] [Google Scholar]
- De Matteis R, Lucertini F, Guescini M, Polidori E, Zeppa S, Stocchi V, Cinti S, Cuppini R. Exercise as a new physiological stimulus for brown adipose tissue activity. Nutr Metab Cardiovasc Dis. 2013;23:582–590. doi: 10.1016/j.numecd.2012.01.013. [DOI] [PubMed] [Google Scholar]
- den Besten G, van Eunen K, Groen AK, Venema K, Reijngoud DJ, Bakker BM. The role of short-chain fatty acids in the interplay between diet, gut microbiota, and host energy metabolism. J Lipid Res. 2013;54:2325–2340. doi: 10.1194/jlr.R036012. [DOI] [PMC free article] [PubMed] [Google Scholar]
- Desautels M, Dulos RA. Effects of repeated cycles of fasting-refeeding on brown adipose tissue composition in mice. Am J Physiol. 1988;255:E120–128. doi: 10.1152/ajpendo.1988.255.2.E120. [DOI] [PubMed] [Google Scholar]
- Dutchak PA, Katafuchi T, Bookout AL, Choi JH, Yu RT, Mangelsdorf DJ, Kliewer SA. Fibroblast growth factor-21 regulates PPARgamma activity and the antidiabetic actions of thiazolidinediones. Cell. 2012;148:556–567. doi: 10.1016/j.cell.2011.11.062. [DOI] [PMC free article] [PubMed] [Google Scholar]
- Eshghinia S, Mohammadzadeh F. The effects of modified alternate-day fasting diet on weight loss and CAD risk factors in overweight and obese women. J Diabetes Metab Disord. 2013;12:4. doi: 10.1186/2251-6581-12-4. [DOI] [PMC free article] [PubMed] [Google Scholar]
- Fontana L, Partridge L. Promoting health and longevity through diet: from model organisms to humans. Cell. 2015;161:106–118. doi: 10.1016/j.cell.2015.02.020. [DOI] [PMC free article] [PubMed] [Google Scholar]
- Hanatani S, Motoshima H, Takaki Y, Kawasaki S, Igata M, Matsumura T, Kondo T, Senokuchi T, Ishii N, Kawashima J, et al. Acetate alters expression of genes involved in beige adipogenesis in 3T3-L1 cells and obese KK-Ay mice. J Clin Biochem Nutr. 2016;59:207–214. doi: 10.3164/jcbn.16-23. [DOI] [PMC free article] [PubMed] [Google Scholar]
- Harms M, Seale P. Brown and beige fat: development, function and therapeutic potential. Nat Med. 2013;19:1252–1263. doi: 10.1038/nm.3361. [DOI] [PubMed] [Google Scholar]
- Hatori M, Vollmers C, Zarrinpar A, DiTacchio L, Bushong EA, Gill S, Leblanc M, Chaix A, Joens M, Fitzpatrick JA, et al. Time-restricted feeding without reducing caloric intake prevents metabolic diseases in mice fed a high-fat diet. Cell Metab. 2012;15:848–860. doi: 10.1016/j.cmet.2012.04.019. [DOI] [PMC free article] [PubMed] [Google Scholar]
- Hayashi M, Nagasaka T. Suppression of norepinephrine-induced thermogenesis in brown adipose tissue by fasting. Am J Physiol. 1983;245:E582–586. doi: 10.1152/ajpendo.1983.245.6.E582. [DOI] [PubMed] [Google Scholar]
- Hill JO, Wyatt HR, Peters JC. Energy balance and obesity. Circulation. 2012;126:126–132. doi: 10.1161/CIRCULATIONAHA.111.087213. [DOI] [PMC free article] [PubMed] [Google Scholar]
- Holmes E, Li JV, Marchesi JR, Nicholson JK. Gut microbiota composition and activity in relation to host metabolic phenotype and disease risk. Cell Metab. 2012;16:559–564. doi: 10.1016/j.cmet.2012.10.007. [DOI] [PubMed] [Google Scholar]
- Hossain P, Kawar B, El Nahas M. Obesity and diabetes in the developing world--a growing challenge. N Engl J Med. 2007;356:213–215. doi: 10.1056/NEJMp068177. [DOI] [PubMed] [Google Scholar]
- Inagaki T, Dutchak P, Zhao G, Ding X, Gautron L, Parameswara V, Li Y, Goetz R, Mohammadi M, Esser V, et al. Endocrine regulation of the fasting response by PPARalpha-mediated induction of fibroblast growth factor 21. Cell Metab. 2007;5:415–425. doi: 10.1016/j.cmet.2007.05.003. [DOI] [PubMed] [Google Scholar]
- Ishibashi J, Seale P. Medicine. Beige can be slimming. Science. 2010;328:1113–1114. doi: 10.1126/science.1190816. [DOI] [PMC free article] [PubMed] [Google Scholar]
- Iwanaga T, Kuchiiwa T, Saito M. Histochemical demonstration of monocarboxylate transporters in mouse brown adipose tissue. Biomed Res. 2009;30:217–225. doi: 10.2220/biomedres.30.217. [DOI] [PubMed] [Google Scholar]
- Jiang C, Xie C, Lv Y, Li J, Krausz KW, Shi J, Brocker CN, Desai D, Amin SG, Bisson WH, et al. Intestine-selective farnesoid X receptor inhibition improves obesity-related metabolic dysfunction. Nat Commun. 2015;6:10166. doi: 10.1038/ncomms10166. [DOI] [PMC free article] [PubMed] [Google Scholar]
- Kajimura S, Spiegelman BM, Seale P. Brown and Beige Fat: Physiological Roles beyond Heat Generation. Cell Metab. 2015;22:546–559. doi: 10.1016/j.cmet.2015.09.007. [DOI] [PMC free article] [PubMed] [Google Scholar]
- Kim N, Nam M, Kang MS, Lee JO, Lee YW, Hwang GS, Kim HS. Piperine regulates UCP1 through the AMPK pathway by generating intracellular lactate production in muscle cells. Sci Rep. 2017;7:41066. doi: 10.1038/srep41066. [DOI] [PMC free article] [PubMed] [Google Scholar]
- Knehans AW, Romsos DR. Norepinephrine turnover in obese (ob/ob) mice: effects of age, fasting, and acute cold. Am J Physiol. 1983;244:E567–574. doi: 10.1152/ajpendo.1983.244.6.E567. [DOI] [PubMed] [Google Scholar]
- Kozich JJ, Westcott SL, Baxter NT, Highlander SK, Schloss PD. Development of a dual-index sequencing strategy and curation pipeline for analyzing amplicon sequence data on the MiSeq Illumina sequencing platform. Appl Environ Microbiol. 2013;79:5112–5120. doi: 10.1128/AEM.01043-13. [DOI] [PMC free article] [PubMed] [Google Scholar]
- Langille MG, Zaneveld J, Caporaso JG, McDonald D, Knights D, Reyes JA, Clemente JC, Burkepile DE, Vega Thurber RL, Knight R, et al. Predictive functional profiling of microbial communities using 16S rRNA marker gene sequences. Nat Biotechnol. 2013;31:814–821. doi: 10.1038/nbt.2676. [DOI] [PMC free article] [PubMed] [Google Scholar]
- Langmead B, Salzberg SL. Fast gapped-read alignment with Bowtie 2. Nat Methods. 2012;9:357–359. doi: 10.1038/nmeth.1923. [DOI] [PMC free article] [PubMed] [Google Scholar]
- Lee SS, Pineau T, Drago J, Lee EJ, Owens JW, Kroetz DL, Fernandez-Salguero PM, Westphal H, Gonzalez FJ. Targeted disruption of the alpha isoform of the peroxisome proliferator-activated receptor gene in mice results in abolishment of the pleiotropic effects of peroxisome proliferators. Mol Cell Biol. 1995;15:3012–3022. doi: 10.1128/mcb.15.6.3012. [DOI] [PMC free article] [PubMed] [Google Scholar]
- Longo VD, Mattson MP. Fasting: molecular mechanisms and clinical applications. Cell Metab. 2014;19:181–192. doi: 10.1016/j.cmet.2013.12.008. [DOI] [PMC free article] [PubMed] [Google Scholar]
- Lopez-Bueno M, Gonzalez-Jimenez E, Navarro-Prado S, Montero-Alonso MA, Schmidt-RioValle J. Influence of age and religious fasting on the body composition of Muslim women living in a westernized context. Nutr Hosp. 2014;31:1067–1073. doi: 10.3305/nh.2015.31.3.8278. [DOI] [PubMed] [Google Scholar]
- Markan KR, Naber MC, Ameka MK, Anderegg MD, Mangelsdorf DJ, Kliewer SA, Mohammadi M, Potthoff MJ. Circulating FGF21 is liver derived and enhances glucose uptake during refeeding and overfeeding. Diabetes. 2014;63:4057–4063. doi: 10.2337/db14-0595. [DOI] [PMC free article] [PubMed] [Google Scholar]
- Mestdagh R, Dumas ME, Rezzi S, Kochhar S, Holmes E, Claus SP, Nicholson JK. Gut microbiota modulate the metabolism of brown adipose tissue in mice. J Proteome Res. 2012;11:620–630. doi: 10.1021/pr200938v. [DOI] [PubMed] [Google Scholar]
- Montagner A, Polizzi A, Fouche E, Ducheix S, Lippi Y, Lasserre F, Barquissau V, Regnier M, Lukowicz C, Benhamed F, et al. Liver PPARalpha is crucial for whole-body fatty acid homeostasis and is protective against NAFLD. Gut. 2016;65:1202–1214. doi: 10.1136/gutjnl-2015-310798. [DOI] [PMC free article] [PubMed] [Google Scholar]
- Mund RA, Frishman WH. Brown adipose tissue thermogenesis: beta3-adrenoreceptors as a potential target for the treatment of obesity in humans. Cardiol Rev. 2013;21:265–269. doi: 10.1097/CRD.0b013e31829cabff. [DOI] [PubMed] [Google Scholar]
- Nedergaard J, Cannon B. The browning of white adipose tissue: some burning issues. Cell Metab. 2014;20:396–407. doi: 10.1016/j.cmet.2014.07.005. [DOI] [PubMed] [Google Scholar]
- Nicholson JK, Holmes E, Kinross J, Burcelin R, Gibson G, Jia W, Pettersson S. Host-gut microbiota metabolic interactions. Science. 2012;336:1262–1267. doi: 10.1126/science.1223813. [DOI] [PubMed] [Google Scholar]
- Patel DP, Krausz KW, Xie C, Beyoglu D, Gonzalez FJ, Idle JR. Metabolic profiling by gas chromatography-mass spectrometry of energy metabolism in high-fat diet-fed obese mice. PLoS One. 2017;12:e0177953. doi: 10.1371/journal.pone.0177953. [DOI] [PMC free article] [PubMed] [Google Scholar]
- Patterson RE, Laughlin GA, LaCroix AZ, Hartman SJ, Natarajan L, Senger CM, Martinez ME, Villasenor A, Sears DD, Marinac CR, et al. Intermittent Fasting and Human Metabolic Health. J Acad Nutr Diet. 2015;115:1203–1212. doi: 10.1016/j.jand.2015.02.018. [DOI] [PMC free article] [PubMed] [Google Scholar]
- Rabot S, Membrez M, Bruneau A, Gerard P, Harach T, Moser M, Raymond F, Mansourian R, Chou CJ. Germ-free C57BL/6J mice are resistant to high-fat-diet-induced insulin resistance and have altered cholesterol metabolism. FASEB J. 2010;24:4948–4959. doi: 10.1096/fj.10-164921. [DOI] [PubMed] [Google Scholar]
- Robidoux J, Martin TL, Collins S. Beta-adrenergic receptors and regulation of energy expenditure: a family affair. Annu Rev Pharmacol Toxicol. 2004;44:297–323. doi: 10.1146/annurev.pharmtox.44.101802.121659. [DOI] [PubMed] [Google Scholar]
- Rooks MG, Garrett WS. Gut microbiota, metabolites and host immunity. Nat Rev Immunol. 2016;16:341–352. doi: 10.1038/nri.2016.42. [DOI] [PMC free article] [PubMed] [Google Scholar]
- Sahuri-Arisoylu M, Brody LP, Parkinson JR, Parkes H, Navaratnam N, Miller AD, Thomas EL, Frost G, Bell JD. Reprogramming of hepatic fat accumulation and ‘browning’ of adipose tissue by the short-chain fatty acid acetate. Int J Obes (Lond) 2016;40:955–963. doi: 10.1038/ijo.2016.23. [DOI] [PubMed] [Google Scholar]
- Secor SM, Carey HV. Integrative Physiology of Fasting. Compr Physiol. 2016;6:773–825. doi: 10.1002/cphy.c150013. [DOI] [PubMed] [Google Scholar]
- Segata N, Izard J, Waldron L, Gevers D, Miropolsky L, Garrett WS, Huttenhower C. Metagenomic biomarker discovery and explanation. Genome Biol. 2011;12:R60. doi: 10.1186/gb-2011-12-6-r60. [DOI] [PMC free article] [PubMed] [Google Scholar]
- Shabalina IG, Petrovic N, de Jong JM, Kalinovich AV, Cannon B, Nedergaard J. UCP1 in brite/beige adipose tissue mitochondria is functionally thermogenic. Cell Rep. 2013;5:1196–1203. doi: 10.1016/j.celrep.2013.10.044. [DOI] [PubMed] [Google Scholar]
- Shinoda K, Luijten IH, Hasegawa Y, Hong H, Sonne SB, Kim M, Xue R, Chondronikola M, Cypess AM, Tseng YH, et al. Genetic and functional characterization of clonally derived adult human brown adipocytes. Nat Med. 2015;21:389–394. doi: 10.1038/nm.3819. [DOI] [PMC free article] [PubMed] [Google Scholar]
- Sivitz WI, Fink BD, Donohoue PA. Fasting and leptin modulate adipose and muscle uncoupling protein: divergent effects between messenger ribonucleic acid and protein expression. Endocrinology. 1999;140:1511–1519. doi: 10.1210/endo.140.4.6668. [DOI] [PubMed] [Google Scholar]
- Spiegelman BM, Flier JS. Obesity and the regulation of energy balance. Cell. 2001;104:531–543. doi: 10.1016/s0092-8674(01)00240-9. [DOI] [PubMed] [Google Scholar]
- Suarez-Zamorano N, Fabbiano S, Chevalier C, Stojanovic O, Colin DJ, Stevanovic A, Veyrat-Durebex C, Tarallo V, Rigo D, Germain S, et al. Microbiota depletion promotes browning of white adipose tissue and reduces obesity. Nat Med. 2015;21:1497–1501. doi: 10.1038/nm.3994. [DOI] [PMC free article] [PubMed] [Google Scholar]
- Susulic VS, Frederich RC, Lawitts J, Tozzo E, Kahn BB, Harper ME, Himms-Hagen J, Flier JS, Lowell BB. Targeted disruption of the beta 3-adrenergic receptor gene. J Biol Chem. 1995;270:29483–29492. doi: 10.1074/jbc.270.49.29483. [DOI] [PubMed] [Google Scholar]
- Takeda K. Metabolic bridge between microbiota and humans. Nat Rev Immunol. 2016;16:206. doi: 10.1038/nri.2016.18. [DOI] [PubMed] [Google Scholar]
- Thaiss CA, Zeevi D, Levy M, Zilberman-Schapira G, Suez J, Tengeler AC, Abramson L, Katz MN, Korem T, Zmora N, et al. Transkingdom control of microbiota diurnal oscillations promotes metabolic homeostasis. Cell. 2014;159:514–529. doi: 10.1016/j.cell.2014.09.048. [DOI] [PubMed] [Google Scholar]
- Tian Y, Zhang L, Wang Y, Tang H. Age-related topographical metabolic signatures for the rat gastrointestinal contents. J Proteome Res. 2012;11:1397–1411. doi: 10.1021/pr2011507. [DOI] [PubMed] [Google Scholar]
- Truong DT, Franzosa EA, Tickle TL, Scholz M, Weingart G, Pasolli E, Tett A, Huttenhower C, Segata N. MetaPhlAn2 for enhanced metagenomic taxonomic profiling. Nat Methods. 2015;12:902–903. doi: 10.1038/nmeth.3589. [DOI] [PubMed] [Google Scholar]
- Wu J, Bostrom P, Sparks LM, Ye L, Choi JH, Giang AH, Khandekar M, Virtanen KA, Nuutila P, Schaart G, et al. Beige adipocytes are a distinct type of thermogenic fat cell in mouse and human. Cell. 2012;150:366–376. doi: 10.1016/j.cell.2012.05.016. [DOI] [PMC free article] [PubMed] [Google Scholar]
- Wu J, Cohen P, Spiegelman BM. Adaptive thermogenesis in adipocytes: is beige the new brown? Genes Dev. 2013;27:234–250. doi: 10.1101/gad.211649.112. [DOI] [PMC free article] [PubMed] [Google Scholar]
- Ye L, Wu J, Cohen P, Kazak L, Khandekar MJ, Jedrychowski MP, Zeng X, Gygi SP, Spiegelman BM. Fat cells directly sense temperature to activate thermogenesis. Proc Natl Acad Sci U S A. 2013;110:12480–12485. doi: 10.1073/pnas.1310261110. [DOI] [PMC free article] [PubMed] [Google Scholar]
- Young P, Arch JR, Ashwell M. Brown adipose tissue in the parametrial fat pad of the mouse. FEBS Lett. 1984;167:10–14. doi: 10.1016/0014-5793(84)80822-4. [DOI] [PubMed] [Google Scholar]
- Zietak M, Kovatcheva-Datchary P, Markiewicz LH, Stahlman M, Kozak LP, Backhed F. Altered Microbiota Contributes to Reduced Diet-Induced Obesity upon Cold Exposure. Cell Metab. 2016;23:1216–1223. doi: 10.1016/j.cmet.2016.05.001. [DOI] [PMC free article] [PubMed] [Google Scholar]
Associated Data
This section collects any data citations, data availability statements, or supplementary materials included in this article.