Abstract
The separation of nanoscale particles based on their differences in size is an essential technique to the nanoscience and nanotechnology community. Here, nanoparticles are successfully separated in a continuous flow by using tilted-angle standing surface acoustic waves. The acoustic field deflects nanoparticles based on volume, and the fractionation of nanoparticles is optimized by tuning the cutoff parameters. The continuous separation of nanoparticlesis demonstrated with a ≈90% recovery rate. The acoustic nanoparticle separation method is versatile, non-invasive, and simple.
1. Introduction
Nanoparticles are central to numerous applications in nanotechnology,[1,2] including cancer diagnosis and therapy,[3–9] targeted drug delivery,[10–12] sensing and detection,[13–15] in vivo imaging,[16] molecular engineering,[17,18] catalysis,[19–21] photonics,[22,23] and battery.[24,25] Researchers have shown that the functions and toxicities of nanoparticles are often size-dependent.[26–36] Although significant work has been conducted on the synthesis of various nanoparticles, the broad size distributions of synthesized nanoparticles make them less effective in applications which demand a specific size of nanoparticles.[37–40]
In the past two decades, several nanoparticle separation techniques have been developed. Each technique has its advantages and disadvantages. Density gradient centrifugation allows for postsynthesis purification.[41,42] However, with nanoscale objects, the gravitational energy is of the same order as the thermal energy, and the centrifugation parameters are highly stringent, thus the gradient medium must be created very carefully. Furthermore, the centrifugation-based separation is time-consuming; it takes several hours to several days for one batch. Another nanoparticle separation method is chromatography, which separates nanoparticles with distinct sizes through elution.[43,44] This process is effective, but due to its low throughput, it is mainly used as an analytic tool. Filtration can also be used for the purification of nanoparticles,[45–49] but the blocking and adhesion of nanoparticles on the membrane surface and pore walls limits the lifetime of the filtration device and reduces the yield. In addition to these aforementioned methods, there are also a multitude of nanoparticle separation methods that rely on electromagnetic mechanisms, such as electrophoresis,[50–52] dielectrophoresis,[53,54] and magnetic manipulation.[55] These methods have a high accuracy, but depend on the charge or magnetic properties rather than size of the nanoparticles for proper separation.
Opposing the above-mentioned, batch-based methods, continuous field flow fractionation (FFF) based methods allow for convenient automation and integration with other on-chip units. Very often it also has better separation throughput.[56–58] For example, Narayanan et al. developed an electric field-induced flow fraction device, which separated 108 and 220 nm amino-coated particles.[56] Jiang et al. reported continuous separation of magnetic nanoparticles into two fractions at a cutoff diameter of 660 nm using a magnetic separation method.[57] However, similar to the previously mentioned, electromagnet-based methods, electric or magnetic field-based FFF is limited to specific nanoparticles since it requires a difference in either charge or magnetic properties of nanoparticles.
Recently, acoustic-based particle separation has drawn significant attention because it is cost-effective, label-free, and noncontact.[59–63] Thus far most acoustic-based particle manipulation methods are limited to particles in the micrometer scale.[59–68] In this work, we present acoustic-based nanoparticle separation in a continuous flow. Our approach adopts a tilted-angle standing surface acoustic wave (taSSAW) configuration,[59] which previously was used to separate circulating tumor cells and other microscale objects. The taSSAW configuration allows the separation distance to be several times larger than the wavelength of acoustic waves and thus significantly improves the performance of acoustic separation. Through optimizing the input frequency, transducer design, and channel configuration, we have achieved acoustic separation of 500 nm polystyrene particles from 240 nm particles. This acoustic-based nanoparticle separation is simple, versatile, and sensitive. Furthermore, it is label-free and noninvasive, so it is particularly suitable for many applications in biology and medicine, such as the isolation of extracellular vesicles and enzyme aggregates.
2. Results and Discussions
2.1. Mechanism of Acoustic Based Nanoparticle Separation
Two tilted-angle interdigital transducers (IDTs) deposited on a LiNbO3 substrate generate identical, opposing, surface acoustic waves (SAWs). Due to the interference between the two travelling SAWs, taSSAW is created and a periodic distribution of wave nodes and antinodes that are tilted with respect to the direction of flow in the channel is created. The angle between IDTs and the microfluidic channel is 15°. The standing waves cause periodic pressure fluctuations in the liquid within the microchannel. These fluctuations generate an acoustic radiation force (Fr) that pushes particles toward the pressure nodes:
| (1) |
| (2) |
In Equation (1), p0, Vp, λ, k, x, ρp, ρf, βp, and βf are acoustic pressure, volume of the particle, wavelength, wave number, distance from a pressure node, density of the particle, density of the fluid, compressibility of the particle, and compressibility of the fluid, respectively. Equation (2) is the expression for the acoustic contrast factor ϕ, which determines whether the particle moves toward pressure nodes or antinodes in the SSAW field: the particle will move toward pressure nodes when ϕ > 0 and pressure antinodes when ϕ < 0. The particle motion is impeded by the Stokes drag force (Fd)
| (3) |
where η, Rp, up, and uf are the viscosity of the fluid, radius of the particle, velocity of the particle, and velocity of the fluid, respectively. When particles flow through the acoustic field, they are deflected by the acoustic radiation force, which causes the particle stream to translate toward the tilted direction (as shown in Figure 1).
Figure 1.
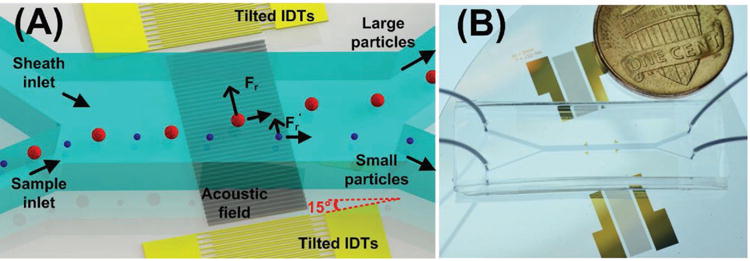
A) Schematic and B) photograph of the acoustic-based nanoparticle separation device.
According to Equation (1), the higher frequency SAW will generate a larger radiation force. In order to deflect particles with diameters smaller than 1 μm, we decrease the wavelength of the SAWs to 120 μm, which corresponds to a resonance frequency of 33.13 MHz. Additionally, a unidirectional IDT pattern is used to further increase the acoustic pressure within the active region. The detailed design of the unidirectional IDT is shown in Figure S1 in the Supporting Information.
Figure 2A shows a simulated particle tracing within the taSSAW field. The 100 and 500 nm polystyrene particles enter the channel at the same initial position and the same velocity in the lateral direction. Within the channel, pressure nodes and antinodes are established at an angle to the fluid flow direction (Figure 2B). Particles flowing through the acoustic field will move across multiple pairs of pressure nodes and antinodes, subject to the acoustic force and the Stokes drag force. Each pair of pressure node and antinode induces slightly different lateral trajectories for the two sizes of particles. By moving through the repeated acoustic field, the differences in lateral trajectory are amplified, translating the particles up to tens of times the acoustic wavelength. Figure 2C shows streams of 500 nm polystyrene particles when the acoustic field is activated. The periodic deflection of 500 nm particles matches with simulation in Figure 2A. The acoustic field induced by taSSAW generates a much larger deflection for the 500 nm particles. The motion of the 100 nm particles is dominated by the Stokes drag force, and the acoustic radiation force is insufficient to move them significantly in the lateral direction. Equation (1) provides the theoretical framework for this increase in radiative force (and subsequent motion) due to the linear relationship between volume and net force. Figure S2 in the Supporting Information shows the trajectories of particles with different size when subjected to the same amplitude of acoustic energy density. The difference in the lateral displacement of particles with different volumes enables size-based separation.
Figure 2.
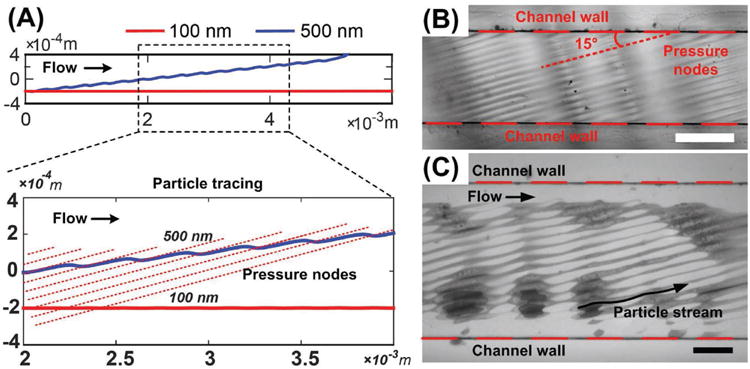
Mechanism of the acoustic-based nanoparticle separation device. A) Simulated particle tracing shows that 500 nm particles are pushed periodically by acoustic radiation force when they pass through the array of pressure nodes, while 100 nm particles are not. B) Distribution of pressure nodes in the channel. The mixing of the two liquids (water and ethanol) manifests the pressure node distribution. Scale bar: 500 μm. C) 500 nm particle stream is deflected by taSSAW acoustic field. Scale bar: 200 μm.
2.2. Deflection of Particles by Acoustic Field
Our method fractionates sub-micrometer particles by varying the deflection of particles of different sizes. With a constant power input, as the size of the particle increases, the overall displacement of particle stream increases. Thus, larger particles are filtered further from the original stream, small particles are moved a shorter distance, and both sets are collected from the corresponding outlets. In our experiments, we explored the removal rate and recovery rate of particles with varied size (Figure 3). The input power was fixed at 27 dBm; the flow rates of sample and sheath flow were 5 and 10 μL min−1, respectively. Particles of diameters 900, 600, 220, and 110 nm were sampled, with the latter two being labeled with fluorescence. Figure 3A shows the bright-field and fluorescent images at the outlet region. The expected result was that at the particular power and frequency we used, the 900 and 600 nm particles would be forced by the acoustic field to outlet A, while the smaller 220 and 110 nm particles would remain close to the original stream and be collected at outlet B.
Figure 3.
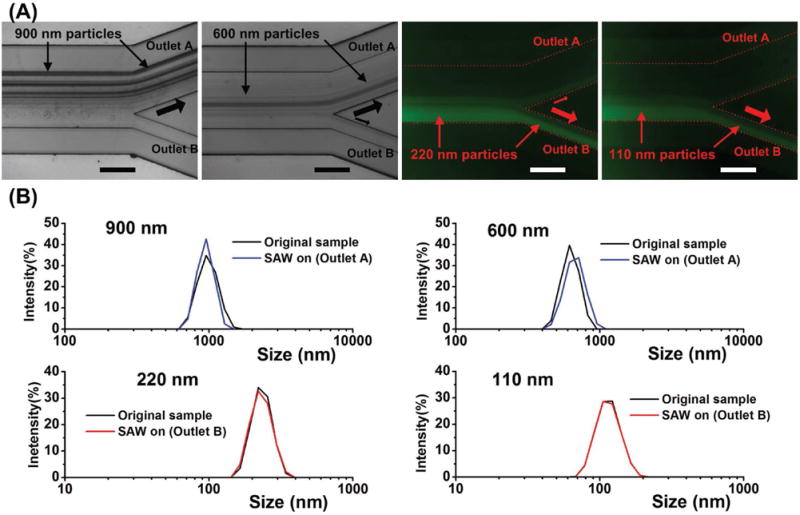
The taSSAW acoustic field functions as a size-based filter. A) Images at the outlet region show that 900 and 600 nm particles were pushed to outlet A, while 220 and 110 nm particles remain on the path to outlet B. B) Characterization of postfiltration samples from outlet A for 900 and 600 nm particles and from outlet B for 220 and 110 nm particles. The size distribution curve was obtained with a Malvern Zetasizer. The y axis is the intensity of signals measured by dynamic light scattering (DLS).
We collected 20 μL samples from either outlet A or B when the SAWs were active. The sample was measured with the Malvern Zetasizer Nano ZSP (Malvern Instruments Ltd, UK), which is based on a dynamic light scattering (DLS) method, to find the size distributions and counting rates. The original sample with the same volume was also measured and used as a control. Figure 3B shows the size distributions of the original sample and the SAW-on sample. The ordinate represents the signal intensity recorded by photon detectors using the DLS method. Table 1 shows the corresponding removal rate or recovery rate. The removal rate is calculated by dividing the counting rate of the sample from outlet A by the counting rate of the original sample. The recovery rate is equal to the counting rate of sample from outlet B divided by the counting rate of the original sample. The data, presented as mean and standard error, was acquired from three individual experiments with the Malvern Zetasizer. For 900 and 600 nm particles, most particles were filtered by the acoustic field, with removal rates of 96.6% and 80.4%, respectively. On the other hand, particles smaller than 220 nm were rarely deflected by the tilted acoustic field, and the recovery rates for 220 and 110 nm particles were 85.6% and 90.7%, respectively.
Table 1.
Removal rate or recovery rate for particles of various sizes.
| Particle size | 900 nm | 600 nm | 220 nm | 110 nm |
|---|---|---|---|---|
| Removal rate (%) | 96.6 | 80.4 | – | – |
| Recovery rate (%) | – | – | 85.6 | 90.7 |
We further tested the required deflection power for particles with different volume. Particles with diameters of 900, 700, 500, 350, and 220 nm were passed through the taSSAW device at flow rate 4 μL min−1. The sheath flow was 12 μL min−1. By adjusting the input power of the radio frequency signal, the particles were successfully deflected by the acoustic field. The minimum power required to deflect particles based on their size was measured and recorded in Figure 4. As the diameter of particles decreased a higher power was needed to deflect said particle. For 900 nm particles, the Vpeak of input RF sine waves was ≈25 V and the power was ≈27 dBm. For 220 nm particles, the input power was more than doubled to ≈31.5 dBm in order to deflect majority of the particles. Thus, by tuning the input power of radio frequency signals, we can tailor our devices for different applications in which nanoparticles with different sizes are involved.
Figure 4.
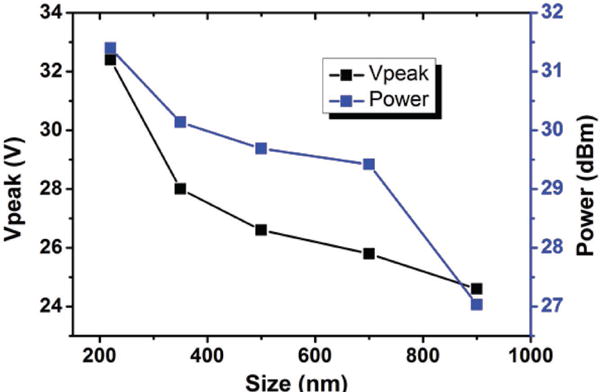
The required input power as a function of particle diameter. The y axis represents the voltage (in terms of Vpeak) as well as the power of radio frequency sine waves.
2.3. Acoustic Separation of Nanoparticles
We have demonstrated that the taSSAW device enables size-based nanoparticle filtration, but to further study the capacity of the taSSAW device, we fine-tuned the input power and flow rate to separate 500 and 110 nm polystyrene particles. The mixture of 500 and 110 nm particles (labeled with green fluorescence) flowed through the device and was fractionated to different outlets. Bright-field and fluorescent images were recorded at the outlet region to manifest the separation performance. Figure 5A shows the bright-field and fluorescent images at varied flow rates. The sample flow rate increased from 3 to 9 μL min−1. At the same time, the flow rate of sheath flow increased from 11 to 20 μL min−1. Generally, the deflection for 500 nm particles induced by the acoustic field decreased as the flow rate increased. When the sample flow rate was 3 μL min−1, the majority of 500 nm particles were pushed away from the original stream and separated from the 110 nm particles. The device was still effective when the flow rate was increased to 9 μL min−1, although a small fraction of 500 nm particles was observed in outlet B. Figure 5B shows the images in the acoustically active region. The 500 nm particles were deflected periodically by the acoustic field, and filtered out from the original stream. On the other hand, though the distribution of pressure nodes affected the flow stream, the 110 nm particles were not deflected sufficiently far (Videos S1 and S2, Supporting Information).
Figure 5.
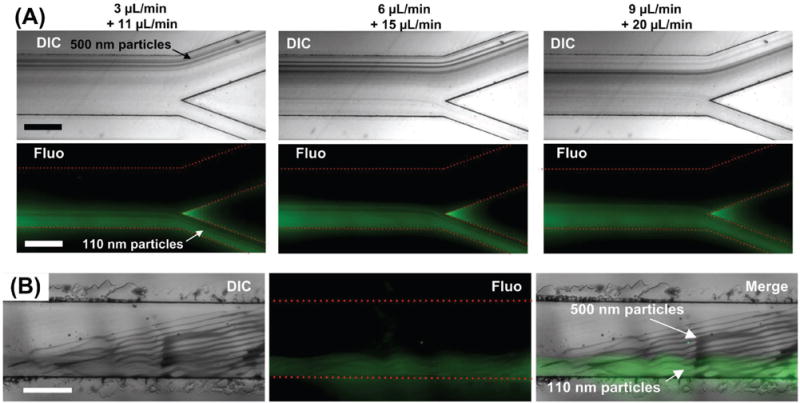
Acoustic separation of 500 and 110 nm particles. A) The separation maintained high efficiency as the throughput increased. 3 + 11 μL min−1: the flow rates of the sample and the sheath flow were 3 and 11 μL min−1, respectively. B) Bright-field and fluorescent images at the acoustic active region. The flow rates of the sample and the sheath flow were 4 and 12 μL min−1, respectively. Scale bar: 500 μm.
2.4. Characterization of Separation Performance
We further explored the performance of acoustic nanoparticle separation by using scanning electron microscopy (SEM) and the Malvern Zetasizer. The mixtures of 500 and 110 nm particles were processed by the acoustic nanoparticle separation device. The flow rate was set to 4 μL min−1 for the sample and 12 μL min−1 for the sheath flow. The sample subject to acoustic power was collected from the outlet. 20 μL samples were collected and diluted to 1 mL. The diluted sample was dropped and wiped on a glass slide coated with a thin gold layer. The liquid droplet was dried by spinning the glass slide at 800 rpm. The glass slide was observed under an SEM microscopy. The results are shown in Figure 6.
Figure 6.
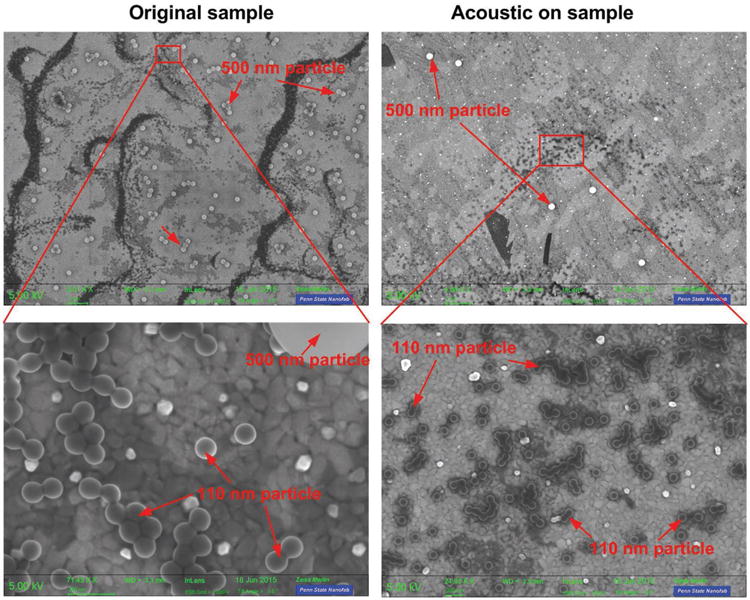
SEM images of the original sample (the mixture of 500 and 110 nm particles) and the acoustic-on sample (collected from the device when the acoustic power was on).
In the original sample, the ratio between 500 nm particles and 110 nm particles was about 1:30. From the SEM images, a large number of 500 nm particles were observed. After separation, the number of 500 nm particles decreased dramatically. The results (Figure 6) indicate that 500 and 110 nm particles were effectively separated by the acoustic field. Most of the 500 nm particles were pushed to the waste outlet, and the purified 110 nm sample was obtained from the sample outlet.
We also conducted acoustic separation for other nanoparticle mixtures. Intensity comparisons were made between the original sample and the separated sample. The results are shown as Figure 7. Separation testing was conducted for mixtures of 110 and 900 nm particles, 240 and 900 nm, 240 and 700 nm, and 240 and 500 nm. The abscissa represents size distribution, and the ordinate is the signal intensity at the corresponding size range. The signal intensity was determined by the number of particles. It can be seen that each of the original samples contains two distinct (yet rounded) peaks at the respective constituent particle sizes. Due to the discrete size distribution, the digital light scattering technique which is used in the Malvern Zetasizer has pitfalls in terms of peak resolution.[69] On the other hand, the sample processed by our acoustic nanoparticle separation device only exhibited one peak in the size domain, and the resolution of this peak was more accurate than the original sample. The results demonstrate that the larger nanoparticles were filtered by the acoustic nanoparticle separation device, producing a purified sample with only small particles.
Figure 7.
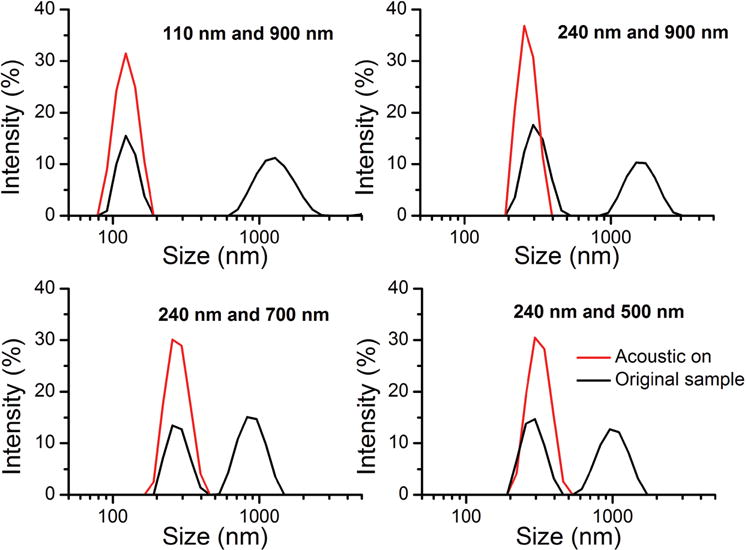
The size distributions of samples before (black lines) and after (red lines) acoustic separation. Samples were tested with the Malvern Zetasizer, which employs digital light scattering (DLS). The ordinate represents the signal intensity, and the abscissa is size distribution. The acoustic-based nanoparticle separation technique filters larger nanoparticles and yields a purified sample, which exhibited only one peak in size distribution.
3. Conclusion
We demonstrate that nanoparticles of varying sizes can be effectively and continuously separated by acoustic waves. The acoustic-based nanoparticle fractionation method presented here provides a unique opportunity to separate virtually all kinds of nanoparticles, regardless of their charge and polarity properties and medium conditions. Furthermore, this method is noncontact, noninvasive, and label-free. This characteristic is particularly important for biological and biomedical applications in which the ability to preserve the integrity of bio-nanoparticles (such as extracellular vesicles, protein aggregates, bacteria, and virus) is important. Finally, the acoustic-based nanoparticle separation device is compact and inexpensive, and it can be conveniently integrated with other lab-on-a-chip units to enable a fully integrated nanoparticle separation and analysis system. With its advantages in versatility, biocompatibility, efficiency, sensitivity, and simplicity, the acoustic-based nanoparticle separation method presented here is a promising tool for many applications in biology, chemistry, engineering, physics, and medicine.
4. Experimental Section
Device Fabrication
In this study, the Y + 128° X-propagation lithium niobate (LiNbO3) was used for piezoelectric substrates. The IDT design was patterned by photolithography. After that, a thin layer of Cr (thickness: 50 Å) was deposited as an adhesive layer, followed by a 500 Å gold layer as electrodes. The deposition was conducted with an e-beam evaporator (Semicore Corp). The metal layer was removed with photoresist, and IDTs were formed by a lift-off process. A set of IDTs consisted of 80 pairs of unidirectional electrodes of feature size 10 μm. The wavelength was 120 μm at a resonance frequency of 33.13 MHz.
The polydimethylsiloxane (PDMS) channel was fabricated by a standard soft lithography process. A thin layer of SU8 100 photoresist (MicroChem, Newton, MA) was spin-coated and patterned by ultraviolet exposure on a 4 in. silicon wafer. PDMS base and curing agent (10:1) were mixed and poured on the SU8 mold. After baking at 65 °C for 30 min, the PDMS channel was peeled off from the mold and bonded on the LiNbO3 substrate. Before bonding, the surface of the LiNbO3 substrate and the PDMS channel was treated with oxygen plasma. The height and width of the PDMS microfluidic channel were 100 and 800 μm, respectively.
Experimental Setup
Polystyrene particles (Bangs Laboratories, USA) were suspended in water as a sample. The diameter of particles used in this study included 900, 700, 600, 500, 240, 220, and 110 nm. The 220 and 110 nm particles were labeled with dragon green fluorescent carboxyl (P(S/V-COOH), (480, 520), Bangs Laboratories, USA). Syringe pumps (NeMESYS, Cetoni GmbH, Germany) injected the sample and withdrew the waste. The experiments were conducted on the stage of an upright microscope (Olympus, Japan). A Peltier cooler was placed under the microfluidic device to keep the temperature at ≈25 °C. A charge-coupled device (CCD) camera recorded the nanoparticle separation process. The acoustic wave was excited by applying radio frequency signals to the IDTs. Signals were formed with a generator (E4422B Agilent, USA) and an amplifier (Amplifier Research, USA).
The sample was collected from either outlet when the acoustic wave was on. 20 μL of sample was diluted to 1 mL with deionized water and was transferred to cuvettes. After that, the sample was tested with the Malvern Zetasizer (Malvern Instruments, UK). The size distribution and the counting rate of particles were obtained. During tests, the temperature was kept at 25 °C. The particle removal rate was calculated by dividing the number of particles collected from waste outlet by the number of particles in the original sample. The particle recovery rate was calculated by dividing the number of particles collected from sample outlet by the number of particles in the original sample.
Supplementary Material
Acknowledgments
The authors acknowledge support from the National Institutes of Health (R01 HD086325) and the National Science Foundation (IDBR-1455658 and IIP-1534645). Components of this work were conducted at the Penn State node of the NSF-funded National Nanotechnology Infrastructure Network.
Footnotes
Supporting Information
Supporting Information is available from the Wiley Online Library or from the author.
Contributor Information
Mengxi Wu, Department of Engineering Science and Mechanics, The Pennsylvania State University, State College, PA 16802, USA.
Zhangming Mao, Department of Engineering Science and Mechanics, The Pennsylvania State University, State College, PA 16802, USA.
Kejie Chen, Department of Engineering Science and Mechanics, The Pennsylvania State University, State College, PA 16802, USA.
Hunter Bachman, Department of Mechanical Engineering and Materials Science, Duke University, Durham, NC 27708, USA.
Dr. Yuchao Chen, Department of Engineering Science and Mechanics, The Pennsylvania State University, State College, PA 16802, USA
Joseph Rufo, Department of Engineering Science and Mechanics, The Pennsylvania State University, State College, PA 16802, USA.
Liqiang Ren, Department of Engineering Science and Mechanics, The Pennsylvania State University, State College, PA 16802, USA.
Dr. Peng Li, Department of Engineering Science and Mechanics, The Pennsylvania State University, State College, PA 16802, USA
Lin Wang, Ascent Bio-Nano Technologies Inc., Research Triangle Park, NC 27709, USA.
Prof. Tony Jun Huang, Department of Mechanical Engineering and Materials Science, Duke University, Durham, NC 27708, USA
References
- 1.Bhushan B. Springer Handbook of Nanotechnology. Springer Science & Business Media; Berlin/Heidelberg, Germany: 2010. [Google Scholar]
- 2.Nogi K, Naito M, Yokoyama T. Nanoparticle Technology Handbook. Elsevier; Amsterdam, Nertherlands: 2012. [Google Scholar]
- 3.Bertrand N, Wu J, Xu X, Kamaly N, Farokhzad OC. Adv Drug Delivery Rev. 2014;66:2. doi: 10.1016/j.addr.2013.11.009. [DOI] [PMC free article] [PubMed] [Google Scholar]
- 4.Ferrari M. Nat Rev Cancer. 2005;5:161. doi: 10.1038/nrc1566. [DOI] [PubMed] [Google Scholar]
- 5.Siddiqui IA, Adhami VM, Chamcheu JC, Mukhtar H. Int J Nanomed. 2012;7:591. doi: 10.2147/IJN.S26026. [DOI] [PMC free article] [PubMed] [Google Scholar]
- 6.Davis ME, Shin DM. Nat Rev Drug Discovery. 2008;7:771. doi: 10.1038/nrd2614. [DOI] [PubMed] [Google Scholar]
- 7.Brannon-Peppas L, Blanchette JO. Adv Drug Delivery Rev. 2012;64:206. doi: 10.1016/j.addr.2004.02.014. [DOI] [PubMed] [Google Scholar]
- 8.Kircher MF, De La Zerda A, Jokerst JV, Zavaleta CL, Kempen PJ, Mittra E, Pitter K, Huang R, Campos C, Habte F, Sinclair R. Nat Med. 2012;18:829. doi: 10.1038/nm.2721. [DOI] [PMC free article] [PubMed] [Google Scholar]
- 9.Kanapathipillai M, Brock A, Ingber DE. Adv Drug Delivery Rev. 2014;79:107. doi: 10.1016/j.addr.2014.05.005. [DOI] [PubMed] [Google Scholar]
- 10.Farokhzad OC, Langer R. ACS Nano. 2009;3:16. doi: 10.1021/nn900002m. [DOI] [PubMed] [Google Scholar]
- 11.Gou M, Qu X, Zhu W, Xiang M, Yang J, Zhang K, Wei Y, Chen S. Nat Commun. 2014;5:3774. doi: 10.1038/ncomms4774. [DOI] [PMC free article] [PubMed] [Google Scholar]
- 12.Manzoor AA, Lindner LH, Landon CD, Park JY, Simnick AJ, Dreher MR, Das S, Hanna G, Park W, Chilkoti A, Koning GA. Cancer Res. 2012;72:5566. doi: 10.1158/0008-5472.CAN-12-1683. [DOI] [PMC free article] [PubMed] [Google Scholar]
- 13.Park SJ, Taton TA, Mirkin CA. Science. 2002;295:1503. doi: 10.1126/science.1067003. [DOI] [PubMed] [Google Scholar]
- 14.Wei Q, McLeod E, Qi H, Wan Z, Sun R, Ozcan A. Sci Rep. 2013;3:1699. doi: 10.1038/srep01699. [DOI] [PMC free article] [PubMed] [Google Scholar]
- 15.Goddard G, Brown LO, Habbersett R, Brady CI, Martin JC, Graves SW, Freyer JP, Doorn SK. J Am Chem Soc. 2010;132:6081. doi: 10.1021/ja909850s. [DOI] [PMC free article] [PubMed] [Google Scholar]
- 16.Hainfeld JF, Smilowitz HM, O’Connor MJ, Dilmanian FA, Slatkin DN. Nanomedicine. 2013;8:1601. doi: 10.2217/nnm.12.165. [DOI] [PMC free article] [PubMed] [Google Scholar]
- 17.Macfarlane RJ, Lee B, Jones MR, Harris N, Schatz GC, Mirkin CA. Science. 2011;334:204. doi: 10.1126/science.1210493. [DOI] [PubMed] [Google Scholar]
- 18.Mahmoudi M, Lynch I, Ejtehadi MR, Monopoli MP, Bombelli FB, Laurent S. Chem Rev. 2011;111:5610. doi: 10.1021/cr100440g. [DOI] [PubMed] [Google Scholar]
- 19.Guo S, Zhang S, Sun S. Angew Chem Int Ed. 2013;52:8526. doi: 10.1002/anie.201207186. [DOI] [PubMed] [Google Scholar]
- 20.Clavero C. Nat Photonics. 2014;8:95. [Google Scholar]
- 21.Chung HT, Won JH, Zelenay P. Nat Commun. 2013;4:1922. doi: 10.1038/ncomms2944. [DOI] [PMC free article] [PubMed] [Google Scholar]
- 22.Marinica DC, Kazansky AK, Nordlander P, Aizpurua J, Borisov AG. Nano Lett. 2012;12:1333. doi: 10.1021/nl300269c. [DOI] [PubMed] [Google Scholar]
- 23.Höppener C, Lapin ZJ, Bharadwaj P, Novotny L. Phys Rev Lett. 2012;109:017402. doi: 10.1103/PhysRevLett.109.017402. [DOI] [PubMed] [Google Scholar]
- 24.Ji L, Tan Z, Kuykendall TR, Aloni S, Xun S, Lin E, Battaglia V, Zhang Y. Phys Chem Chem Phys. 2011;13:7170. doi: 10.1039/c1cp20455f. [DOI] [PubMed] [Google Scholar]
- 25.Ryou MH, Kim J, Lee I, Kim S, Jeong YK, Hong S, Ryu JH, Kim TS, Park JK, Lee H, Choi JW. Adv Mater. 2013;25:1571. doi: 10.1002/adma.201203981. [DOI] [PubMed] [Google Scholar]
- 26.Jiang W, Kim BY, Rutka JT, Chan WC. Nat Nanotechnol. 2008;3:145. doi: 10.1038/nnano.2008.30. [DOI] [PubMed] [Google Scholar]
- 27.Lundqvist M, Stigler J, Elia G, Lynch I, Cedervall T, Dawson KA. Proc Natl Acad Sci USA. 2008;105:14265. doi: 10.1073/pnas.0805135105. [DOI] [PMC free article] [PubMed] [Google Scholar]
- 28.Albanese A, Tang PS, Chan WC. Ann Rev Biomed Eng. 2012;14:1. doi: 10.1146/annurev-bioeng-071811-150124. [DOI] [PubMed] [Google Scholar]
- 29.Walkey CD, Olsen JB, Guo H, Emili A, Chan WC. J Am Chem Soc. 2012;134:2139. doi: 10.1021/ja2084338. [DOI] [PubMed] [Google Scholar]
- 30.Tenzer S, Docter D, Rosfa S, Wlodarski A, Kuharev J, Rekik A, Knauer SK, Bantz C, Nawroth T, Bier C, Sirirattanapan J. ACS Nano. 2011;5:7155. doi: 10.1021/nn201950e. [DOI] [PubMed] [Google Scholar]
- 31.Chithrani BD, Ghazani AA, Chan WC. Nano Lett. 2006;6:662. doi: 10.1021/nl052396o. [DOI] [PubMed] [Google Scholar]
- 32.Vertegel AA, Siegel RW, Dordick JS. Langmuir. 2014;20:6800. doi: 10.1021/la0497200. [DOI] [PubMed] [Google Scholar]
- 33.Sykes EA, Chen J, Zheng G, Chan WC. ACS Nano. 2014;8:5696. doi: 10.1021/nn500299p. [DOI] [PubMed] [Google Scholar]
- 34.Pan Y, Neuss S, Leifert A, Fischler M, Wen F, Simon U, Schmid G, Brandau W, Jahnen-Dechent W. Small. 2007;3:1941. doi: 10.1002/smll.200700378. [DOI] [PubMed] [Google Scholar]
- 35.Nair S, Sasidharan A, Rani VD, Menon D, Nair S, Manzoor K, Raina S. J Mater Sci: Mater Med. 2009;20:235. doi: 10.1007/s10856-008-3548-5. [DOI] [PubMed] [Google Scholar]
- 36.Jiang J, Oberdörster G, Biswas P. J Nanopart Res. 2009;11:77. [Google Scholar]
- 37.Zhao P, Li N, Astruc D. Coord Chem Rev. 2013;257:638. [Google Scholar]
- 38.Zubarev ER. Nat Nanotechnol. 2013;8:396. doi: 10.1038/nnano.2013.109. [DOI] [PubMed] [Google Scholar]
- 39.Horikoshi S, Serpone N. Microwaves in Nanoparticle Synthesis: Fundamentals and Applications. John Wiley & Sons; Hoboken, NJ: 2013. [Google Scholar]
- 40.Shchukin DG, Sukhorukov GB. Adv Mater. 2004;16:671. [Google Scholar]
- 41.Sun X, Tabakman SM, Seo WS, Zhang L, Zhang G, Sherlock S, Bai L, Dai H. Angew Chem Int Ed. 2009;48:939. doi: 10.1002/anie.200805047. [DOI] [PMC free article] [PubMed] [Google Scholar]
- 42.Bai L, Ma X, Liu J, Sun X, Zhao D, Evans DG. J Am Chem Soc. 2010;132:2333. doi: 10.1021/ja908971d. [DOI] [PubMed] [Google Scholar]
- 43.Liu FK, Wei GT. Chromatographia. 2004;59:115. [Google Scholar]
- 44.Shen Y, Gee MY, Tan R, Pellechia PJ, Greytak AB. Chem Mater. 2013;25:2838. [Google Scholar]
- 45.Sweeney SF, Woehrle GH, Hutchison JE. J Am Chem Soc. 2006;128:3190. doi: 10.1021/ja0558241. [DOI] [PubMed] [Google Scholar]
- 46.Palencia M, Rivas BL, Valle H. J Membr Sci. 2014;455:7. [Google Scholar]
- 47.Xie QL, Liu J, Xu XX, Han GB, Xia HP, He XM. Sep Purif Technol. 2009;66:148. [Google Scholar]
- 48.Gaborski TR, Snyder JL, Striemer CC, Fang DZ, Hoffman M, Fauchet PM, McGrath JL. ACS Nano. 2010;4:6973. doi: 10.1021/nn102064c. [DOI] [PMC free article] [PubMed] [Google Scholar]
- 49.Mekawy MM, Yamaguchi A, El-Safty SA, Itoh T, Teramae N. J Colloid Interface Sci. 2011;355:348. doi: 10.1016/j.jcis.2010.11.056. [DOI] [PubMed] [Google Scholar]
- 50.Xu X, Caswell KK, Tucker E, Kabisatpathy S, Brodhacker KL, Scrivens WA. J Chromatogr A. 2007;1167:35. doi: 10.1016/j.chroma.2007.07.056. [DOI] [PubMed] [Google Scholar]
- 51.Hanauer M, Pierrat S, Zins I, Lotz A, Sönnichsen C. Nano Lett. 2007;7:2881. doi: 10.1021/nl071615y. [DOI] [PubMed] [Google Scholar]
- 52.Surugau N, Urban PL. J Sep Sci. 2009;32:1889. doi: 10.1002/jssc.200900071. [DOI] [PubMed] [Google Scholar]
- 53.Green NG, Morgan H. J Phys D: Appl Phys. 1997;30:L41. [Google Scholar]
- 54.Morgan H, Hughes MP, Green NG. Biophys J. 1999;77:516. doi: 10.1016/S0006-3495(99)76908-0. [DOI] [PMC free article] [PubMed] [Google Scholar]
- 55.Yavuz CT, Mayo JT, William WY, Prakash A, Falkner JC, Yean S, Cong L, Shipley HJ, Kan A, Tomson M, Natelson D. Science. 2006;314:964. doi: 10.1126/science.1131475. [DOI] [PubMed] [Google Scholar]
- 56.Narayanan N, Saldanha A, Gale BK. Lab Chip. 2006;6:105. doi: 10.1039/b504936a. [DOI] [PubMed] [Google Scholar]
- 57.Jiang Y, Miller ME, Hansen ME, Myers MN, Williams PS. J Magn Magn Mater. 1999;194:53. [Google Scholar]
- 58.Huang LR, Cox EC, Austin RH, Sturm JC. Science. 2004;304:987. doi: 10.1126/science.1094567. [DOI] [PubMed] [Google Scholar]
- 59.Ding X, Peng Z, Lin SCS, Geri M, Li S, Li P, Chen Y, Dao M, Suresh S, Huang TJ. Proc Natl Acad Sci USA. 2014;111:12992. doi: 10.1073/pnas.1413325111. [DOI] [PMC free article] [PubMed] [Google Scholar]
- 60.Li P, Mao Z, Peng Z, Zhou L, Chen Y, Huang PH, Truica CL, Drabick JJ, El-Deiry WS, Dao M, Suresh S, Huang TJ. Proc Natl Acad Sci USA. 2015;112:4970. doi: 10.1073/pnas.1504484112. [DOI] [PMC free article] [PubMed] [Google Scholar]
- 61.Chen Y, Wu M, Ren L, Liu J, Whitley PH, Wang L, Huang TJ. Lab Chip. 2016;16:3466. doi: 10.1039/c6lc00682e. [DOI] [PMC free article] [PubMed] [Google Scholar]
- 62.Behrens J, Langelier S, Rezk AR, Lindner G, Yeo LY, Friend JR. Lab Chip. 2015;15:43. doi: 10.1039/c4lc00704b. [DOI] [PubMed] [Google Scholar]
- 63.Yeo LY, Friend JR. Ann Rev Fluid Mech. 2014;46:379. [Google Scholar]
- 64.Petersson F, Åberg L, Swärd-Nilsson AM, Laurell T. Anal Chem. 2007;79:5117. doi: 10.1021/ac070444e. [DOI] [PubMed] [Google Scholar]
- 65.Dykes J, Lenshof A, Åstrand-Grundström B, Laurell T, Scheding S. PLoS One. 2011;6:e23074. doi: 10.1371/journal.pone.0023074. [DOI] [PMC free article] [PubMed] [Google Scholar]
- 66.Chen K, Wu M, Guo F, Li P, Chan CY, Mao Z, Li S, Ren L, Zhang R, Huang TJ. Lab Chip. 2016;16:2636. doi: 10.1039/c6lc00444j. [DOI] [PMC free article] [PubMed] [Google Scholar]
- 67.Lee K, Shao H, Weissleder R, Lee H. ACS Nano. 2015;9:2321. doi: 10.1021/nn506538f. [DOI] [PMC free article] [PubMed] [Google Scholar]
- 68.Rogers PR, Friend JR, Yeo LY. Lab Chip. 2010;10:2979. doi: 10.1039/c004822d. [DOI] [PubMed] [Google Scholar]
- 69.Filipe V, Hawe A, Jiskoot W. Pharm Res. 2010;27:796. doi: 10.1007/s11095-010-0073-2. [DOI] [PMC free article] [PubMed] [Google Scholar]
Associated Data
This section collects any data citations, data availability statements, or supplementary materials included in this article.


