Abstract
We develop efficient numerical methods for fractional order PDEs, and employ them to investigate viscoelastic constitutive laws for arterial wall mechanics. Recent simulations using one-dimensional models [1] have indicated that fractional order models may offer a more powerful alternative for modeling the arterial wall response, exhibiting reduced sensitivity to parametric uncertainties compared with the integer-calculus-based models. Here, we study three-dimensional (3D) fractional PDEs that naturally model the continuous relaxation properties of soft tissue, and for the first time employ them to simulate flow structure interactions for patient-specific brain aneurysms. To deal with the high memory requirements and in order to accelerate the numerical evaluation of hereditary integrals, we employ a fast convolution method [2] that reduces the memory cost to O(log(N)) and the computational complexity to O(N log(N)). Furthermore, we combine the fast convolution with high-order backward differentiation to achieve third-order time integration accuracy. We confirm that in 3D viscoelastic simulations, the integer order models strongly depends on the relaxation parameters, while the fractional order models are less sensitive. As an application to long-time simulations in complex geometries, we also apply the method to modeling fluid–structure interaction of a 3D patient-specific compliant cerebral artery with an aneurysm. Taken together, our findings demonstrate that fractional calculus can be employed effectively in modeling complex behavior of materials in realistic 3D time-dependent problems if properly designed efficient algorithms are employed to overcome the extra memory requirements and computational complexity associated with the non-local character of fractional derivatives.
Keywords: Fast convolution method, Fractional differential equations, Fluid–structure interaction, Spectral element method, Patient-specific vasculature, Brain aneurysm
1. Introduction
The arterial wall is a heterogeneous soft tissue with complex biomechanical properties, which may vary over space and the temporal states of deformation. Typically, integer-order differential equations are used to model the stress-strain relations for arterial walls [3–5]. A family of integer-order models can be derived using Fung’s theory of quasilinear viscoelasticity [3], and one of its simplest examples is the Kelvin–Zener (Standard Linear Solid or SLS) model [6]. The SLS model accounts for creep, hysteresis and stress relaxation phenomena, and it can be described as a parallel combination of a spring with a spring and a dashpot in series. In the one-dimensional (1D) SLS model, the axial stress σ(t) is related to strain ε(t) as:
| (1.1) |
where E is the Young modulus of the wall, and τσ, τε are the relaxation parameters. Here we note that when τσ = τε, the purely elastic model is retrieved. In [4,5], healthy central systemic arteries in the human were simulated with 1D integer-order viscoelastic models, and compared with measured data. However, although the integer-order model can capture the time-dependent response of the arterial wall, in [7] it was reported that this model’s viscoelastic response is very sensitive to the relaxation parameters. In arterial simulations, these relaxation parameters vary significantly among patients and anatomic locations, which makes the estimation of these parameters a challenging task and hinders the use of the integer order model. Therefore, in [7–10] fractional time derivatives [11–13] are introduced to describe the layered structure of arterial walls and capture the continuous relaxation spectrum of soft tissue. In this new model, the arteries’ non-local behavior in time is highlighted, i.e., the current behavior of the arterial wall has a strong dependence on its deformation history. To be specific, in the 1D case the integer-order SLS model (1.1) has been generalized by employing the so-called spring-pot element, which interpolates between the purely viscous and elastic behaviors, and can be interpreted as a parallel combination of a spring with a spring in series with a spring-pot. The constitutive law becomes
| (1.2) |
Here we use the Riemann–Liouville definition for the fractional derivative of order α (0 ≤ α < 1)
| (1.3) |
which is a non-local operator that depends on the history of function f (t). The Γ function is defined as . To investigate the interaction of this 1D model with blood flow, one-dimensional FSI arterial models were studied numerically in [1], and the simulation results indicated that the fractional order models are less sensitive to the material parameters employed compared with the integer-order-based models.
The 1D model is relatively simple but it fails to provide shear stress distributions, which strongly depend on the viscoelastic properties of the arterial wall. More importantly, it cannot represent the patient-specific geometries which are clinically important in the diagnosis and treatment of several vascular diseases [14]. Therefore, 3D studies are required. To this end, 3D fluid–structure interaction simulations have served as an effective tool in studying hemodynamics [15–24]. However, to the authors’ best knowledge, no work has been done on the 3D study of fractional-order models for arterial walls.
To numerically discretize the fractional derivatives, the Grüwald–Letnikov formula [12] has been widely employed. However, upon integration to N time steps, these algorithms consume at least O(N2) operations and O(N) memory due to the history effect of fractional derivatives, which hinders the application of these methods in large-scale 3D numerical simulations. To approximate the time-fractional derivatives and hence to obtain the solution of fractional-order PDEs, various algorithms have been proposed in the last 15 years. In [25,26], the decaying of the convolution kernel was exploited and the use of nested meshes was proposed, which requires O(log(N)) memory. Alternatively, instead of truncating the convolution kernel, in [27] the time-fractional derivative is discretized by means of a fractional backward differentiation formula which truncates the Taylor expansion. Exploiting the Laplace transform for the convolution kernel in [28], an algorithm was proposed based on the quadrature rule. This algorithm requires O(m) storage where m is the number of quadrature points. A similar approach was considered in the fast convolution method [2,29], where the authors considered a contour integral representation of the convolution kernel, with the resulted algorithm requiring O(log(N)) memory. To achieve a higher-order accuracy, the fast methods was further extended into the Runge–Kutta method, by calculating multiple increments at each time step [30–32].
In this paper, we introduce fractional-order viscoelasticity in complicated arterial geometries, such as patient-specific aneurysms, and for the first time apply it to 3D fluid–structure interactions simulations. To overcome the excessive memory and computational requirements, we develop and implement efficient and accurate numerical schemes for solving fractional-order PDEs by combining the spectral element method [33–35] for spatial discretization with the multi-patch fast convolution method of [2,29] for the time-fractional derivatives. The fast convolution method of [2,29] achieves at most second-order accuracy in time regardless of the time integration algorithm being used, because of the linear interpolation employed. In [31] the convolution integration was approximated by the Runge–Kutta method hence achieving higher-order convergence rates. Here, we make use of the derivative estimations calculated in the high-order BDF methods, and propose a multi-step fast convolution method by constructing high-order interpolation. This method does not degrade the time convergence rate while estimating the convolution integrations, but instead achieves high-order accuracy.
The paper is organized as follows. In section 2 we first describe the governing fractional-order differential equations (section 2.1) and two discretization methods for the fractional-order derivative in section 2.2. In section 2.2.2, we derive a new fast convolution method and demonstrate its numerical performance in two numerical examples in sections 3.1–3.2 highlighting the convergence rate in time and its computational efficiency. In section 3.3 we apply the fractional-order arterial wall model in fluid–structure interaction simulations for a straight idealized arterial geometry, and investigate the sensitivities of the wall model on its relaxation parameters as well as on the fractional order. In 3.4 we employ a fractional-order model to study the long-term deformation of a patient-specific cerebral aneurysm sac. Finally, we summarize in section 4 the main findings of this study.
2. Mathematical formulation
In this section, we consider the solid problem in Lagrangian coordinates X, and derive the formulation for the displacement field η(X, t) in a three-dimensional object occupying the domain Ωs ⊂ R3 with boundary ∂Ωs = ∂ΩsD ∪ ∂ΩsN. Here Dirichlet type boundary conditions are prescribed on ∂ΩsD, Neumann type boundary conditions (traction) on ∂ΩsN, and Ωs stands for the initial configuration of the object.
2.1. Fractional-order model
The 1D fractional-order model described in (1.2) can be generalized into the 3D case:
| (2.1) |
where S is the second Piola–Kirchhoff stress tensor, α is the fractional order, and τσ, τε are the relaxation parameters. Here we focus on the linear elastic model with infinitesimal deformations for simplicity, and the same methodology can also be applied on nonlinear materials if we take S0 as the stress tensor for hyperelastic materials and employ a Newton–Raphson procedure at each time step (more details can be found in [35]). The stress tensor S0 is then given by
where is the strain tensor, and μ, λ are the shear and Lame modulus, respectively. The fractional-order model (2.1) now becomes
| (2.2) |
Here we assume that both the stress tensor S(t) and the strain tensor E(t) are continuously differentiable, and the object is at a static equilibrium when t ≤ 0, i.e., S(t) and E(t) vanish before t = 0. Then we can set the lower limit of the fractional derivative (1.3) to be a = 0. Consequently, as α approaches 1, the model (2.1) converges to the integer-order SLS model
Next we derive a formulation for computing the displacement field η(X). The equation describing the deformation can be expressed as follows:
| (2.3) |
with the external traction load Sns = T applied at ∂ΩsN and the static initial deformation η(X, t = 0) = 0 in Ωs. In the above equations, ns, f and ρs are the normal vector pointing outward from the structure domain, the body load on the structure, and the structure density, respectively. With test functions v, the deformation of this object is governed by the following weak formulation:
| (2.4) |
where the displacement field η(X, t) ∈ U(t) = {w(X, t) ∈ [H1(Ωs)]3|w(X, t) = ηD(X, t) on ∂ΩsD}, and U0 = {w(X) ∈ [H1(Ωs)]3|w(X) = 0 on ∂ΩsD}.
With the above weak formulation, the structure problem is then solved by employing a continuous Galerkin formulation with Jacobi polynomials as trial and test functions. All models are implemented in our parallel spectral element method code, StressNEKTAR [34,35], which can deal with different types of 3D elements in space, including hexahedrons, prisms, tetrahedrons and pyramids. To be specific, we employ the high-order hierarchical shape functions as defined in [35] to discretize in space. On each element we expand the displacement η = (η1, η2, η3) and the test function v = (v1, v2, v3):
| (2.5) |
where Ne is the total number of shape functions for displacement on this element, ϕp (X) are the shape functions, and η̂ip, v̂ip are the expansion coefficients. We then have the local vector of unknown expansion coefficients for displacement on each element
| (2.6) |
with length 3Ne. Here the coefficient vector is organized in a such a way that the three displacement components corresponding to a particular mode are adjacent, so as to have smaller bandwidth for the coefficient matrix [34]. Since the interior modes are coupled with the boundary modes of the same element only, while assembling the local vector (2.6) into the global vector U, we arrange the modes following the “vertex-edge-face-interior” sequence as in [33]. With expression (2.5), one can then also obtain the global vector of the external forces F, the mass matrix M, and the stiffness matrix K for stress tensor S0. On each element Ωe, the local vector of the external forces is a vector of length 3Ne, with components
| (2.7) |
where (Te)i and (fe)i are the components of the external traction and body forces applied on this element, respectively. Based on (2.7), the global vector of the external forces F is then organized in the same ordering of indices as U. Correspondingly, on each element we have a 3Ne ×3Ne local mass matrix, which is organized as a matrix of Ne × Ne blocks, with each block being a 3 × 3 submatrix:
| (2.8) |
Here I is the 3 × 3 identity matrix. Similarly, on each element we can organize the 3Ne ×3Ne stiffness matrix for the stress tensor S0 into Ne × Ne blocks, with each 3 × 3 submatrix being
| (2.9) |
where . With the local mass matrix (2.8) and the local stiffness matrix (2.9), one can then assemble the global mass matrix M and the global stiffness matrix K, respectively. For more details, we refer the interested readers to [36].
To discretize the second order time derivative , two types of methods are implemented in StressNEKTAR: the Newmark scheme and a three-step backward differentiation formula (BDF) [37]. They can be defined by different expressions for the displacement and velocity at the next time step. Let n denote the index of the time step, in the Newmark scheme, based on the current displacement ηn, previous time step displacement ηn−1, velocity η̇n−1 and acceleration η̈n−1, we can approximate the acceleration and velocity at the n-th step as:
| (2.10a) |
| (2.10b) |
where we have used “·” to denote the temporal derivatives and Δt is the time step size. Depending on the requirements of accuracy and stability, different values can be set to the parameters (θ1, θ2). In the following, we use the parameters (θ1, θ2) = (0.5, 0.25).
In the three-step BDF scheme, the acceleration and velocity approximations are also expressed based on the current information (ηn, η̇n) and previous time steps results (ηn−i, η̇n−i ) as:
| (2.11a) |
| (2.11b) |
Here Ai, Bi, Ci and Di (i = 1, 2) are related following the rule
| (2.12a) |
| (2.12b) |
and (θ1, θ2) are also decided based on considerations of stability and dissipation. When taking (θ1, θ2) = (0, 0), the three-step BDF scheme reaches its highest accuracy, i.e., the third-order convergence in time. In the numerical examples we will also test the case with (θ1, θ2) = (5/3, 5/3) because of its enhanced stability [37]. This pair of parameters corresponds to a three-step second-order scheme.
2.2. Discretization methods for fractional derivative
2.2.1. Grüwald–Letnikov formula
While considering the temporal discretization for fractional derivative, based on the assumption that S(t) and E(t) are both continuously differentiable, the Riemann–Liouville fractional derivative (1.3) is equivalent to the Grüwald–Letnikov fractional derivative [12]
| (2.13) |
This fact enables a popular way of discretizing the fractional derivative, i.e., the Grüwald–Letnikov formula which is of first order accuracy in time:
| (2.14) |
with
| (2.15) |
Substituting (2.14) into (2.1), at the n-th time step we obtain that
| (2.16) |
which yields
| (2.17) |
Therefore, the weak formulation (2.4) can be rewritten as
| (2.18) |
One can now approximate the acceleration at the n-th time step, with either the Newmark scheme (2.10) or the three-step backward differentiation formula (BDF) (2.11). Let n denote the index of the time step, in the Newmark scheme we obtain the temporal discretized formulation:
| (2.19) |
We then obtain a linear system for the coefficient vector U:
| (2.20) |
where the internal load vector Gn is also organized in the same ordering of indices as U, with the element-wise component as
Similarly, in the three-step BDF scheme we obtain the temporal discretized formulation:
| (2.21) |
where Ai, Bi, Ci and Di (i = 1, 2) are defined as in (2.12). It can therefore also be formulated into the vector form:
| (2.22) |
The internal load vector components are
| (2.23) |
In each time step, we can then calculate and store the memory load as
| (2.24) |
Assembling the above element-wise components into the global vector, it yields the recursive formulation for
| (2.25) |
Starting from the static equilibrium, we solve the system with Newmark scheme (2.20) for the first two steps and with BDF scheme (2.22) for the rest steps, following the algorithm:
-
Set
for the n-th time step, do
Go to time step n +1.
Because the Grüwald–Letnikov formula (2.14) introduces an O(Δt) error, the above Grüwald–Letnikov algorithm should be of first accuracy in time. Regarding the efficiency, at the n-th time step, for evaluating and storing the accumulated term in memory load HISn it requires O(n) operations. With N = T/Δt numbers of total time steps, this Grüwald–Letnikov formula consumes O(N2) operations and O(N) memory in evaluating the accumulated right-hand-side from deformation history.
2.2.2. Fast convolution method
The Grüwald–Letnikov formula is limited by its first-order accuracy and the computational bottleneck of O(N2) operations and O(N) memory in evaluating HIS, especially in long-term time integration as in the FSI problems of interest here. To improve both the accuracy as well as the efficiency, we now convert equation (2.1) to the convolution form. Applying the Laplace transform ℒ to (2.1), we have
| (2.28) |
which yields
| (2.29) |
Then taking the inverse Laplace transform, we get the relation between S(t) and S0(t)
| (2.30) |
where
and Eβ1,β2 (t) is the two parameter Mittag–Leffler function [12], which can be seen as the fractional generalization of the exponential. By substituting the relaxation form of constitutive law (2.30) and discretizing in space, we obtain the discretized form
| (2.31) |
The Mittag–Leffler function exhibits a much faster decay than the exponential function for small time t. On the other hand, when t→∞, this function has a heavy tail and its decay is only algebraic. Therefore, although we may directly calculate the Mittag–Leffler function to compute the convolution integral in (2.31), such heavy tail behavior would prohibit us from alleviating the computational complexity.
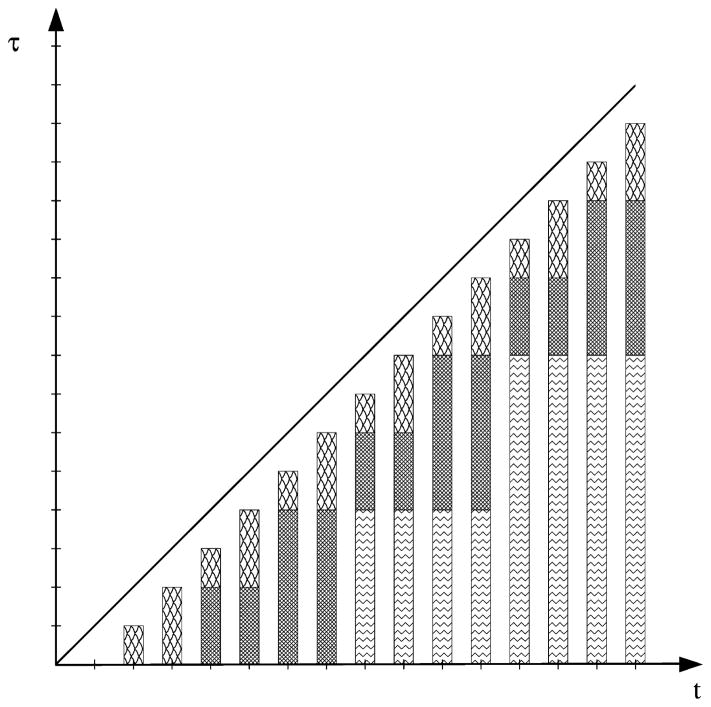
The methods introduced in [2,29] provide an effective alternative to evaluate such convolution integrals. As illustrated in Fig. 1, the idea is to decompose the integral range with base 2:
| (2.32) |
where m1 = [log2(n)], m2 = [log2(n − 2m1)], etc. For example, when n = 7, the integral can be divided into 3 parts
Fig. 1.
Decomposition for integral ranges (a, b) in the fast convolution method of [29].
when n = 8, we have 4 parts
To approximate the l-th part of the convolution integral, we apply the trapezoidal rule to a parametrization of the contour integral for the inverse Laplace transform:
| (2.33) |
where the complex contour Γl is chosen to be the Talbot contour [38,39], and and are the weights and quadrature points on each Talbot contour:
The function ω̄l(κ) is chosen such that the singularities of ℒ(I)(s) lie in the contour [29]. Note that the Talbot contours can vary step by step if an adaptive algorithm [2] is employed. However, in the current method, we generate the quadrature points for all O(log N) numbers of Talbot contours before the first time step (pre-processing cost only). While computing the last part of the convolution integral in (2.32), we improve the linear approximation proposed in [29] by making a full use of the velocity U̇n−1 and acceleration Ün−1 information approximated following the Newmark scheme (2.10) or the three-step BDF scheme (2.11):
| (2.34) |
which introduces an O(Δt4) error. Here the integrals can be calculated a priori as the inverse Laplace transforms
and the weights as well as the quadrature points correspond to the Talbot contour chosen for t = Δt. For the rest of the convolution integrals in (2.32), we can approximate them on the corresponding Talbot contour Γl
| (2.35) |
where the inner integral can be updated recursively by solving
| (2.36) |
In each time step, to integrate for we update recursively after obtaining the approximated displacement Un, velocity U̇n and acceleration Ün:
| (2.37) |
Therefore, time derivatives obtained from the Newmark scheme (2.10) or the three-step BDF scheme (2.11), improve the piecewise linear interpolant used in [29] which introduces an O(Δt2) error. Higher-order interpolation of U(r) in (2.37) is more effective in long-term computation because it only gives O(Δt4) error at each time step which yields an O(Δt3) error accumulatively. This accuracy could be further improved by using higher-order BDF schemes. Since the Talbot contours are fixed, the computational cost in our algorithm for approximating the convolution integrals (2.32) is:
O(N log N) multiplications,
O(log N) evaluations of the Laplace transform ℒ(I)(s),
-
O(log N) active memory.
where N is the total number of time-history steps.
Combining (2.34) and (2.35), we can rewrite (2.38)
| (2.38) |
which yields the following fast convolution algorithm:
- Set
-
for the n-th time step, do
Go to time step n +1.
The estimated integrals in (2.34) and (2.35) introduce an O(Δt4) error each, which accumulatively give an O(Δt3) error from the fast convolution method. Therefore, while using the fast convolution method, the fractional derivative estimation would only bring an error which is smaller than the errors from the Newmark scheme (2.10) and the three-step BDF scheme (2.11). Regarding the efficiency, with N = T/Δt numbers of total time steps, this resultant algorithm requires O(N log N) operations and O(log N) memory.
2.3. Fluid–structure interaction
In the arterial simulations, we use the partitioned fluid–structure interaction approach to study the blood flow and arterial wall physics numerically. We employ the fractional order model for the structure part in order to investigate the performance of the viscoelastic models in simulating the arterial wall motion. At the fluid structure interface, the Neumann boundary condition
| (2.41) |
is applied to ensure the continuity of normal stresses, where p, u, ς, ρf and nf are the fluid pressure, velocity, viscosity, density and the normal vector of fluid subdomain pointing outward on the interface, respectively. The fluid part is assumed to be incompressible and Newtonian, hence, it can be described by the incompressible Navier–Stokes equation in the arbitrary Lagrangian–Eulerian (ALE) framework,
| (2.42a) |
| (2.42b) |
combined with the initial condition
| (2.43) |
and the Dirichlet boundary conditions on the interface, i.e.,
| (2.44) |
which enforces the continuity of velocities. Here, w stands for the mesh velocity. On the fluid side the parallel Navier–Stokes solver NEKTAR [33] is employed, which is based on unstructured spectral elements (polymorphic shapes) and corresponding Jacobi polynomial expansions as trail and test basis in the mixed Galerkin formulation.
When the mass ratio between the structure and the fluid parts is around one as in our case, the partitioned fluid–structure solver suffers from the so-called added-mass effect [40,41], which causes divergence of the subiterations. To resolve the added-mass effect which appears in the hemodynamic FSI simulations, we adopt the fictitious mass method with optimal coefficients suggested by the analysis. In these simulations, subiterations are employed on each time step to guarantee continuity at the interface. For more details of our fluid–structure interaction solver, we refer the interested readers to [35].
3. Numerical results
3.1. First convergence test
In this section, we investigate the time accuracy of the Grüwald–Letnikov formula as well as the fast convolution method. We first consider the deformation of a cubic solid occupying the domain 0 ≤ X ≤ 1, 0 ≤ Y ≤ 1 and 0 ≤ Z ≤ 1 discretized by eight hexahedral elements as illustrated in Fig. 2. For the test example, we use two fabricated problems with parameters as listed in Table 1, then compare the simulation results against analytical fabricated solutions. For the material properties, we use Young’s modulus E and the Poisson ratio ν, which are related to the material constants λ and μ in (2.2) by
Fig. 2.
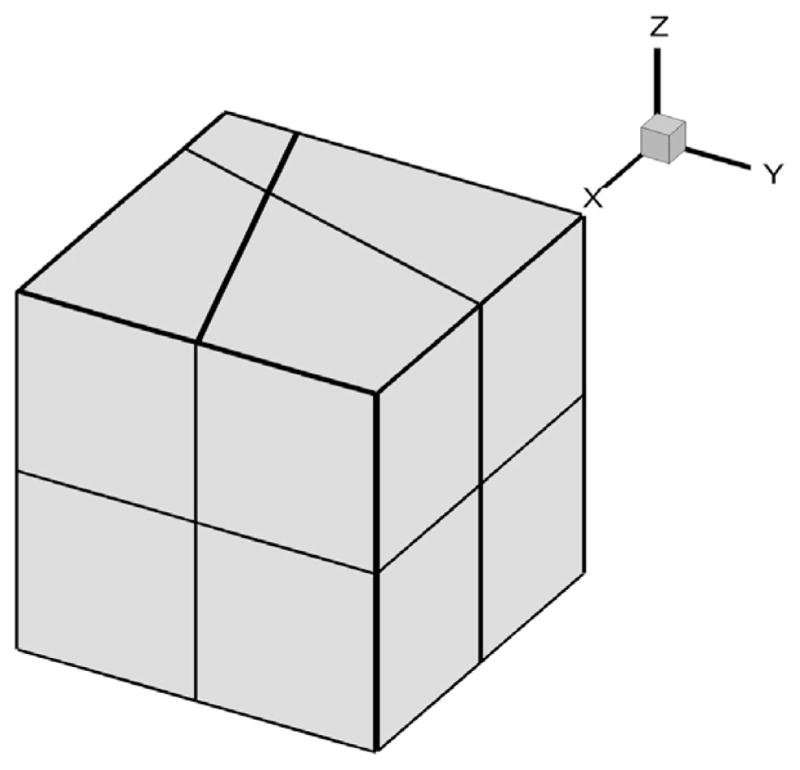
Mesh for the first convergence test.
Table 1.
t-convergence tests for fractional-order SLS model: parameters for cases.
| α | τε | τσ | E | ν | ρs | |
|---|---|---|---|---|---|---|
| FS1 | 0.25 | 0 | 10.5 | 100 | 0.3 | 1000 |
| FS2 | 0.75 | 0 | 10.5 | 100 | 0.3 | 1000 |
| (3.1) |
In cases FS1 and FS2, the face X = 0 is clamped, and a traction force field T = (T1, T2, T3) is applied on the rest of the faces, which is given by
| (3.2) |
where n = (nx, ny, nz) is the outward-pointing unit vector normal to the surface. A body force field f = (f1, f2, f3) is applied on the subject with components:
| (3.3) |
When t = 0, the displacement and velocity fields vanish. This problem has the following analytical solution for the displacement of the object:
| (3.4) |
To study the convergence behavior at time T = 0.4, we vary the time step size Δt from 0.00015625 to 0.02, as in the left plot of Fig. 3. To compare the computational errors with respect to the exact solution, for Δt we calculate the errors in the relative energy norm. Here the relative energy norm is defined as
Fig. 3.
Results from the first convergence test. Left: errors as a function of the time step size. Right: CPU time (Sec) in evaluating the memory effect at the last time step. (For interpretation of the colors in this figure, the reader is referred to the web version of this article.)
| (3.5) |
where
ηa is the analytic solution for displacement, and ηc is the result from computation. Here all the simulations are performed with polynomial order 4 elements. In the left plot of Fig. 3 we plot these errors in logarithmic scale as a function of time step size, which is also in logarithmic scale. Red solid lines show the results from the Grüwald–Letnikov formula, while the results plotted in blue dashed lines are obtained with the fast convolution method, with (θ1, θ2) = (5/3, 5/3), which corresponds to a second-order three-step BDF scheme. Different symbols show the results from different cases. One could observe that for both methods, the numerical errors decrease almost along a straight line as the time step size decreases, indicating a polynomial order convergence rate in time. To be specific, a second-order convergence rate in time is achieved for the proposed fast convolution method, while the Grüwald–Letnikov formula is of first-order convergence.
In the right plot of Fig. 3, we compare the efficiency of the Grüwald–Letnikov formula with that of the fast convolution method for time step numbers N = T/Δt from 1280 to 40960, by showing the CPU time required for evaluating the memory effects at step N. To be specific, for the Grüwald–Letnikov formula, we show the CPU time in calculating the HIS load in (2.25), while for the fast convolution method we calculate the CPU time for approximating the convolution integral . The results are plotted in linear scale as a function of the total number of times, which is in logarithmic scale. The red solid line shows the results from the Grüwald–Letnikov formula while the blue dashed line gives the results from the fast convolution method. We observe that the CPU time required by the fast convolution method is increasing linearly with the increase of time steps, which indicates an O(log(N)) computational cost for calculating the memory effect at each time step. On the other hand, the CPU time for the Grüwald–Letnikov formula is of O(N) and therefore it grows much faster as shown by the red line. Both accuracy and efficiency for the two methods are therefore validated: The Grüwald–Letnikov formula is of first order convergence in time and requires O(N) operations in calculating the memory effect at each time step. The fast convolution method converges with a second-order accuracy in time, and it requires only O(log(N)) operations for evaluating the memory effect at each time step.
To further investigate the high accuracy of the fast convolution method, we now employ a third-order BDF scheme in the case “FS2”. Here we vary the time step size Δt from 0.0125 to 0.2, and integrate until time T = 2.0 for each Δt. The errors in logarithmic scale are plotted in Fig. 4 as a function of time step size, which is also in logarithmic scale. One can see that the fast convolution method with third-order BDF scheme achieves a third-order convergence in time, which verifies our error analysis in Section 2.2.2.
Fig. 4.
Errors as a function of the time step sizes, from the first convergence test while using the third-order three-step BDF scheme.
3.2. Second convergence test
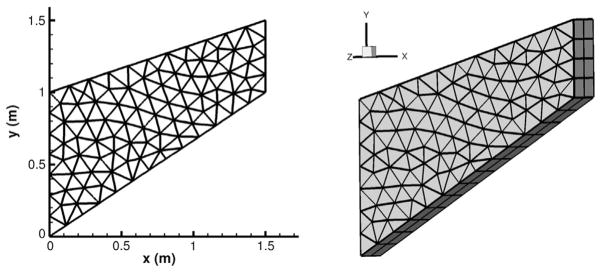
We now consider a simple but realistic example for a two-dimensional structure which has been employed in [42], to show that the model accurately captures the mechanical response and to investigate the accuracy of the fast convolution method when τε ≠ 0. The geometry and mesh are illustrated in Fig. 5: we consider an object with length 1.5 m in the x and y direction, and with a thickness 0.3 m in the z direction. The face x = 0 is clamped, and on x = 1.5 a traction force field is applied following the negative y direction:
| (3.6) |
Fig. 5.
Mesh for the second convergence test.
Here we employ a 3D code to obtain a 2D solution and hence we impose on z = 0 and z = −0.3 periodic boundary conditions, i.e., η|z=0 = η|z=−0.3. We assume no volume load f for this object, and the model parameters are taken as
To compare the viscoelastic behavior of the material, three sets of fractional parameters are considered:
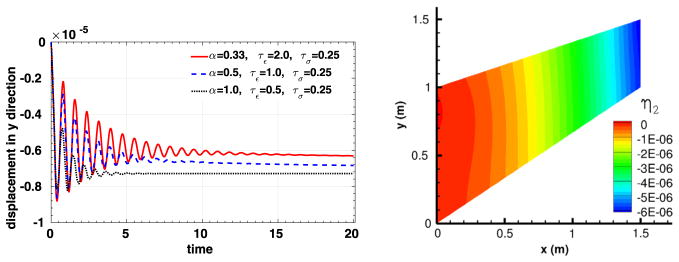
All tests are performed with the fast convolution method using polynomial order 4 elements, and this structure problem is simulated from t = 0 to t = 20. In the right plot of Fig. 6, we show the vertical displacement for the case with the first set of fractional parameter at time 20. The computed vertical displacements at the point (x, y, z) = (1.5, 1.5, 0.0) for different fractional parameters are shown in the left plot of Fig. 6, from which one could notice that smaller fractional order α generally yields less damping, which is consistent with the claims in [42].
Fig. 6.
Simulation results for the second convergence test. Left: time traces of the displacement at the right end of the object (x =1.5). Right: displacement distribution in y direction when α = 0.33, τε = 2.0, τσ = 0.25 and time = 20 (for interpretation of the colors in this figure, the reader is referred to the web version of this article).
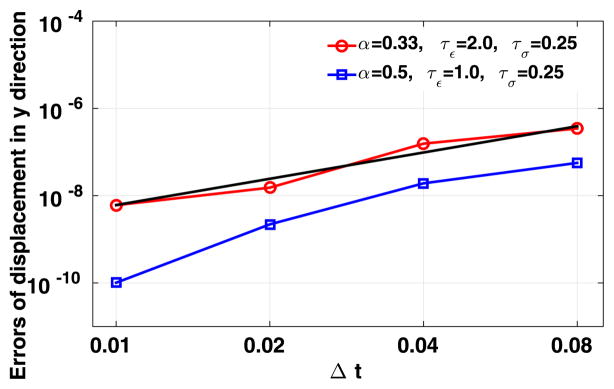
To study the convergence behavior in time, in Fig. 7 we present the errors for displacement at the point (x, y, z) = (1.5, 1.5, 0.0) when taking the first and the second sets of fractional parameters, as a function of the time step size Δt. Due to the lack of an explicit solution, the numerical solutions are compared with the results obtained from polynomial order 6 elements and finer time step size Δt = 0.0001. Both the errors and the time step sizes are in the logarithmic scale. We see that the results from the fast convolution method with second-order BDF scheme are approximately on a straight line with the time step size decreasing. To be specific, a second-order convergence rate in time is obtained when α = 0.33, and when α = 0.5 we can see that the method converges slightly faster than second order in time.
Fig. 7.
Results from the second convergence test: errors of the fast convolution method as a function of the time step size. The reference solution is obtained from a higher resolution simulation.
3.3. Fluid–structure interaction: blood flow in a compliant artery
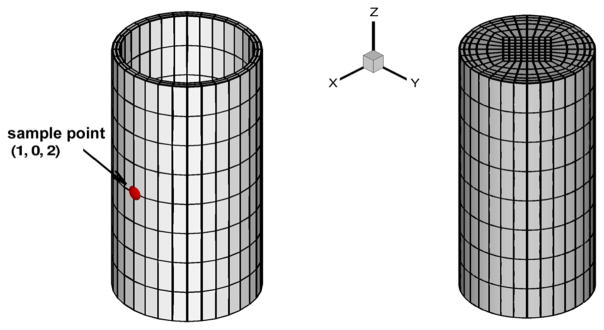
We now consider a straight tube with pulsatile inflow as an idealization of arterial flow-structure interactions, and investigate the performance of fractional order wall models with different parameterizations. To further assess the need for 3D simulations, the simulation results are compared with those obtained from 1D models in [1]. The fluid subdomain is taken as a cylinder with radius 1 mm and length 4 mm, and the structure subdomain is the thin-layered arterial wall with a thickness 0.105 mm, which covers the fluid subdomain uniformly. The computational mesh for both subdomains is illustrated in Fig. 8. In all tests we take the fluid density as ρf = 1060 kg/m3, and the structure density ρs = 1.2ρf. On the fluid solver, a Womersley velocity profile with 8 Fourier coefficients is imposed at the inlet boundary, while at the outlet the pressure p̄ is flow-dependent and is determined from the flow rate Q (t), given the resistant R, and the capacitance C as [43]
Fig. 8.
Meshes for blood flow in an artery. Left: structure mesh; right: fluid mesh.
| (3.7) |
Here we take R = 2.8 × 10³ dyn · s/cm5 and C = 3.4 × 10⁻⁷ cm5/dyn for all tests in this section, and the arterial outlet is assumed to be undeformed when the outlet pressure p̄ (t) reaches its lowest point at t = 0.0151 s. At the inlet we clamp the arterial wall, while a no-traction load is applied at the external surface as well as at the outlet. All the other physical and numerical parameters are summarized in Table 2, and all results shown here are generated using spectral elements of polynomial order 3.
Table 2.
Parameters used in the idealized artery model simulations.
| Parameter | Value |
|---|---|
| Young’s Modulus 0.3 | Mpa |
| Poisson ratio | 0.3 |
| Blood density | 1.06 g/cm3 |
| Wall thickness | 0.0105 cm |
| Inlet radius | 0.1 cm |
| Kinematic viscosity | 3.8×10⁻² cm2/s |
| Average flow rate | 20 ml/min |
| Time step size | 9.4×10⁻⁵ s |
| Polynomial order | 3 |
| Fictitious mass coefficient | 2.16 |
3.3.1. Comparison between different models
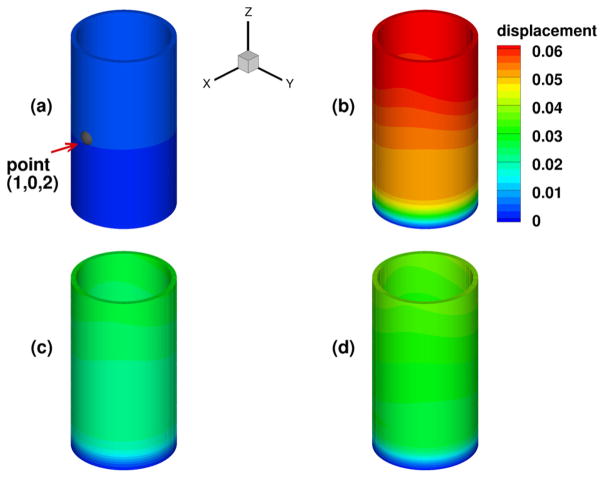
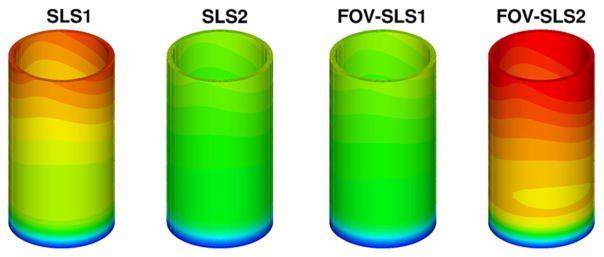
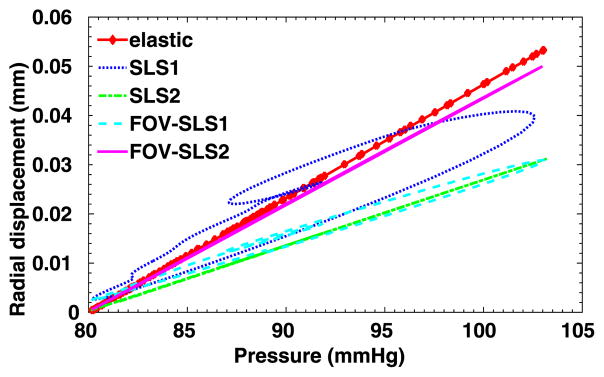
We have considered a purely elastic model for the arterial wall, and in Fig. 9 we show the distribution of structural displacements at four time instants: t = 2T, and , where T is a cardiac cycle. Similarly as in [1], four viscoelastic models are studied for the arterial wall. In Table 3 we summarize the viscoelastic parameters employed in these models, and we compare the results against simulation results from the pure elastic model. In Fig. 10 we present the displacement distributions from the pure elastic wall model at the systolic peak , and compare with the results from the integer-order/fractional-order viscoelastic wall models. We observe that at the systolic peak, the radial deformations in all models reach the maximum. On the other hand, in the viscoelastic models the viscous dissipation decreases the deformation to different extent: the FOV-SLS2 case gives results which are the closest to that from the pure elastic model, and in cases SLS2 and FOV-SLS1 the new models greatly decrease the predicted deformation. To see the temporal changes of arterial wall deformation more clearly, we present in Fig. 11 the time traces for displacement at a sample point (1, 0, 2), with the pressure-radial displacement hysteresis loop shown in Fig. 12. Note that in the left plot of Fig. 11, the black solid lines mark four time instants in the cardiac cycle, which correspond to the time instants for the displacement magnitudes shown in Fig. 9. We see that although the elastic response dominates in all models, the varying viscoelastic parameters result a significant change in displacement magnitudes. Among all models, the SLS2 and FOV-SLS1 models produce relatively stiffer responses, and therefore predict much smaller arterial wall deformations. Moreover, it is shown in Fig. 12 that the viscoelastic dissipation can be clearly observed from SLS1 model, but not that much from the SLS2 model. This finding highlights that the integer order SLS model is very sensitive to the relaxation parameters. On the other hand, although the fractional order model appears to be overall less sensitive to the parameters, an increased sensitivity is observed when we switch from 1D to 3D simulations. Comparing the two fractional order model cases FOV-SLS1 and FOV-SLS2, the maximum radial displacement varies by 50%, which is opposite to the observations in [1], where these two models predicted very close results. This discrepancy motivates the investigation presented in the next section that aims to identify whether the increased sensitivity is due to the relaxation parameters τε and τσ, or the fractional order α.
Fig. 9.
Displacements (in millimeters) for the pure elastic model in the idealized artery simulations: at t = 2T (upper left), (upper right), (lower left), (lower right). (For interpretation of the colors in this figure, the reader is referred to the web version of this article.)
Table 3.
Parameters employed in fractional-order SLS models for the idealized artery simulations.
| α | τε (s) | τσ (s) | |
|---|---|---|---|
| SLS1 | N/A | 0.05 | 0.025 |
| SLS2 | N/A | 29.3 | 16.9 |
| FOV-SLS1 | 0.29 | 1.84 | 0.076 |
| FOV-SLS2 | 0.20 | 11.74 | 7.61 |
Fig. 10.
Displacements (in millimeters) for the viscoelastic models in the idealized artery simulations at systolic peak . From left to right are obtained with: model SLS1; model SLS2; model FOV-SLS1 and model FOV-SLS2. (For interpretation of the colors in this figure, the reader is referred to the web version of this article.)
Fig. 11.
Time traces at point (1, 0, 2) in the idealized artery simulations, from varying viscoelastic models. Left: radial displacement; right: axial displacement.
Fig. 12.
Pressure-radial displacement hysteresis loop at point (1, 0, 2) in the idealized artery simulations, from varying viscoelastic models.
3.3.2. Sensitivity to viscoelastic coefficients
To further evaluate the sensitivity of the 3D viscoelastic arterial wall models, we study the behavior of fractional order arterial wall models by varying the viscoelastic parameters α, τε and τσ. We first vary the fractional order α between 0 ≤ α ≤ 1 while keeping the same relaxation times of SLS1 model: τε = 0.050 s, τε = 0.025 s. The displacement time traces at the middle of the tube are compared in Fig. 13, for α = 0.0, 0.2, 0.4 and 1.0. Note that for α = 0 the pure elastic model is recovered, while α = 1.0 yields the solution of the integer-order SLS1 model. Although the displacement time trace results in Fig. 13 do not vary much, from the pressure-radial displacement hysteresis loop in Fig. 14 we can see that when α increases the viscous dissipation becomes more important. This is consistent with the discussions in [1], except that comparing with the 1D cases, varying the fractional order α in the 3D cases changes more in both the displacement traces and the hysteresis loops. Next, now we investigate how sensitive the solution is to the choice of relaxation parameters τε and τσ. In Figs. 15–16, we present results for fixed α = 0.2 with various relaxation time parameters, and the solutions for α = 1.0 are displayed in Figs. 17–18. When α = 1.0, a more noticeable viscous response can be observed, and the arterial wall deformation is more sensitive to the relaxation spectrum used. This means that when the fractional order α is relatively small, the effect of the fractional order SLS model (2.1) has low sensitivity on the relaxation parameters. Therefore, it overcomes the uncertainty for using the integer order SLS model in simulating arterial networks, where α is typically less than 0.3, since we can only hope to get accurate estimates of τε and τσ at limited anatomic locations. In fact, we have also numerically verified that as the fractional order α approaches 1, the simulation results from the fractional-order model converges to the results from the integer order SLS model, and therefore increasingly more sensitive to the parameters (also shown in [1]).
Fig. 13.
Time traces at point (1, 0, 2) in the idealized artery simulations, from fixed τε = 0.05, τσ = 0.025 and varying α. Left: radial displacement; right: axial displacement.
Fig. 14.
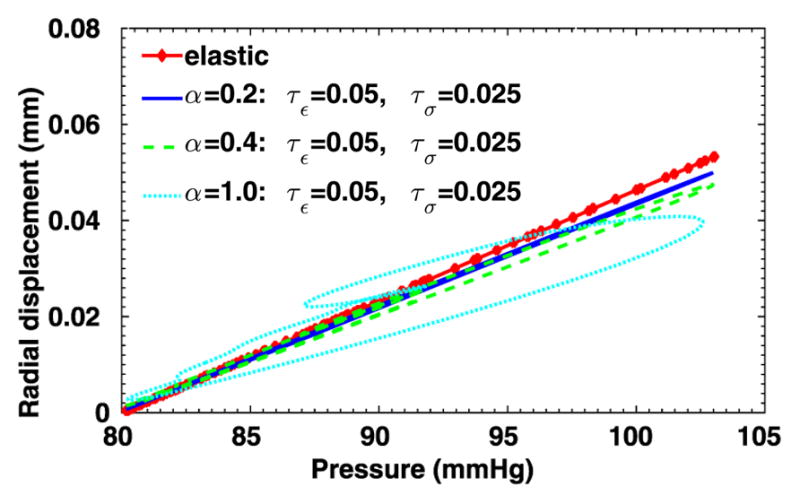
Pressure-radial displacement hysteresis loops at point (1, 0, 2) in the idealized artery simulations, from fixed τε = 0.05, τσ = 0.025 and varying α.
Fig. 15.
Time traces at point (1, 0, 2) in the idealized artery simulations, from fixed α = 0.2 and varying relaxation parameters. Left: radial displacement; right: axial displacement.
Fig. 16.
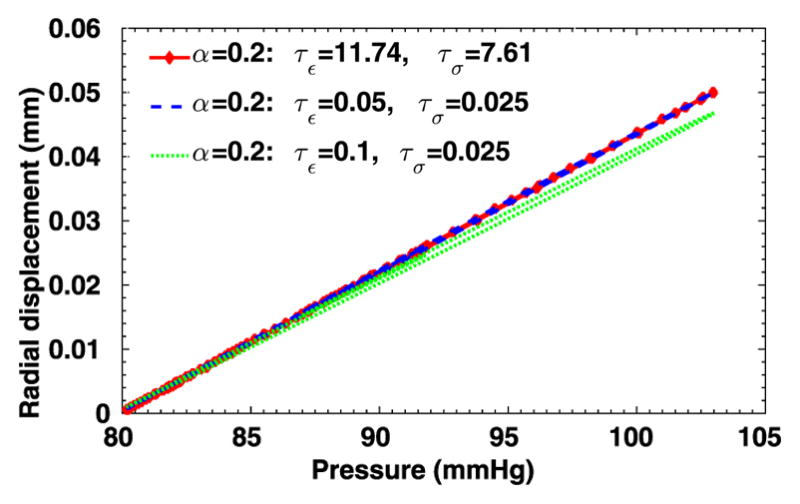
Pressure-radial displacement hysteresis loops at point (1, 0, 2) in the idealized artery simulations, from fixed α = 0.2 and varying relaxation parameters.
Fig. 17.
Time traces at point (1, 0, 2) in the idealized artery simulations, from fixed α = 1.0 and varying relaxation parameters. Left: radial displacement; right: axial displacement.
Fig. 18.
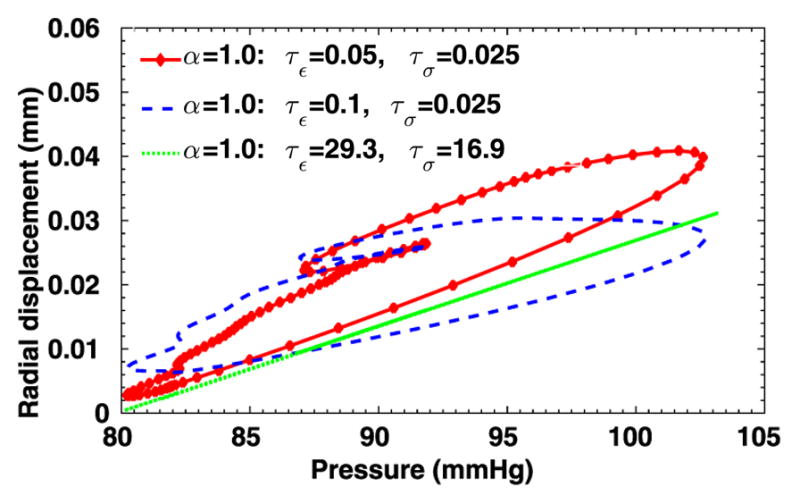
Pressure-radial displacement hysteresis loops at point (1, 0, 2) in the idealized artery simulations, from fixed α = 1.0 and varying relaxation parameters.
3.3.3. Comparison between 1D and 3D simulations
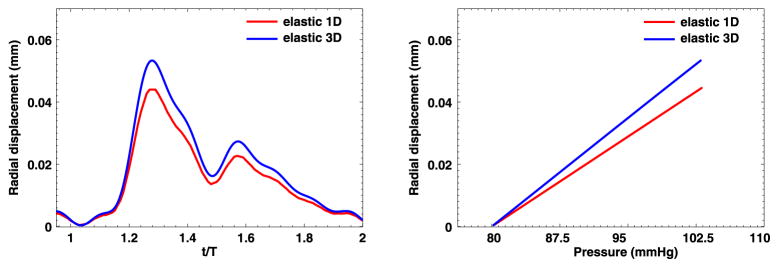
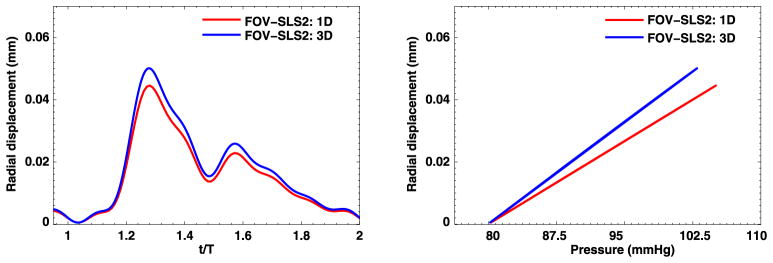
The above findings reveal differences between 1D and 3D simulations, i.e., the 3D solutions seem more sensitive to the fractional order α. Now we compare the 1D and 3D computed solutions in terms of radial displacement and the pressure waveform at the middle point of the artery (with the coordinate (1, 0, 2)). In Figs. 19–20 we present the results from the pure elastic model and one of the fractional-order viscoelastic models. Generally, the 1D models provide good prediction on the trend of radial displacement/pressure time traces for this simple tube-shape geometry. However, when accurate predictions are needed, the 1D simulations tend to underestimate the arterial wall deformations by as large as 20%. Therefore, to get more reliable predictions and to enable the possibility of simulating on complicated geometries, the 3D models are recommended.
Fig. 19.
1D–3D comparison at point (1, 0, 2) in the idealized artery simulations, from pure elastic model. Left: radial displacement time trace; Right: pressure-radial displacement hysteresis loop. (For interpretation of the colors in this figure, the reader is referred to the web version of this article.)
Fig. 20.
1D–3D comparison at point (1, 0, 2) in the idealized artery simulations, from FOV-SLS2 model. Left: radial displacement time trace; Right: pressure-radial displacement hysteresis loop. (For interpretation of the colors in this figure, the reader is referred to the web version of this article.)
3.4. Fluid–structure interaction: patient-specific aneurysm
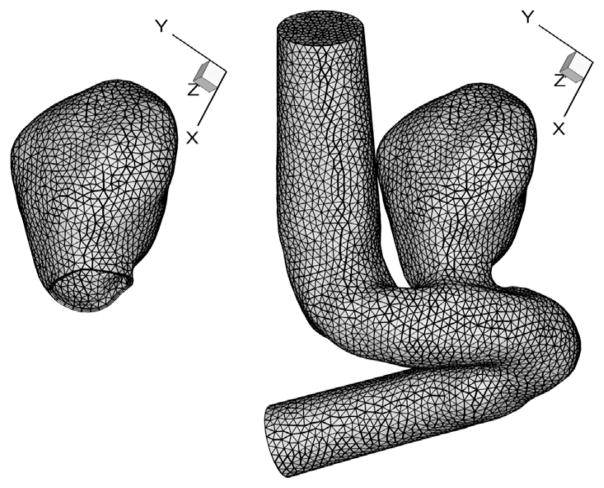
The authors in [7–10,44] have demonstrated that fractional orders would be able to properly predict the different mechanical behavior of the smooth muscle cell activities. Since the smooth muscle decrease plays a crucial role in the change of cerebral aneurysm walls [45–48], in this section we investigate the fractional order models on a patient-specific aneurysm geometry [24,43]. This aneurysm is located at the eye level, in the cavernous segment of the right internal carotid artery. We perform our simulations on the meshes as shown in Fig. 21, where the fluid subdomain has finer elements near the vessel wall to resolve the boundary layers, and the solid subdomain is composed of two layers of prismatic elements on the vessel wall. A Womersley velocity profile with 8 harmonics is imposed at the inlet boundary of the fluid solver, and a zero Neumann boundary condition for velocity is employed at the outlet. The outlet pressure p̄ is determined by (3.7), with proper resistant and capacitance coefficients. The arterial outlet is assumed to be undeformed when the outlet pressure p̄ (t) reaches its lowest point at t = 0.0571 s. We start the FSI simulations from the resultant flow field of rigid wall simulations on the fluid subdomain (where we set t = 0 as the starting time of FSI). The structure is considered undeformed at t = 0. To integrate in time, we employed the second-order splitting scheme for the fluid solver. On the structure side, the fast convolution method introduced in 2.2.2 is used, with fictitious mass method [24,43] applied to stabilize the FSI partitioned procedure. All the simulations are done with the physical and numerical parameters summarized in Table 4.
Fig. 21.
Meshes for patient-specific aneurysm model. Left: structure mesh (with 5628 prismatic elements); right: fluid mesh (with 58939 tetrahedral elements).
Table 4.
Parameters used in the patient-specific aneurysm simulations with fractional order models.
| Parameter | Value |
|---|---|
| Young’s Modulus | 3 Mpa |
| Poisson ratio | 0.3 |
| Blood density | 1.06 g/cm3 |
| Arterial wall density | 2.12 g/cm3 |
| Wall thickness | 0.01 cm |
| Inlet radius | 0.224 cm |
| Kinematic viscosity | 3.8×10⁻² cm2/s |
| Womersley Number | 4.2 |
| Average flow rate | 70 ml/min |
| Time step size | 6.3×10⁻⁴ s |
| Mass damping parameter | 0 s−1 |
| Stiffness damping parameter | 0 s |
| Resistant parameter | 7.844×10² dyn · s/cm5 |
| Capacitance parameter | 7.285×10⁻⁵ cm5/dyn |
| Polynomial order | 2 |
| Fictitious mass coefficient | 2.08 |
3.4.1. Comparison between different models
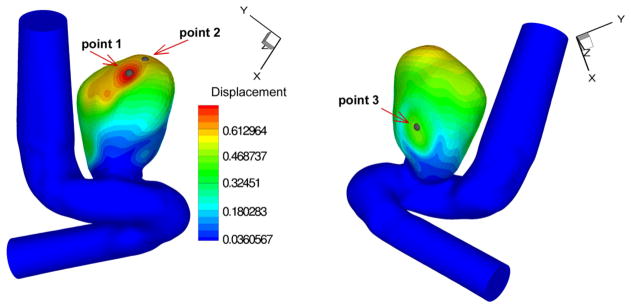
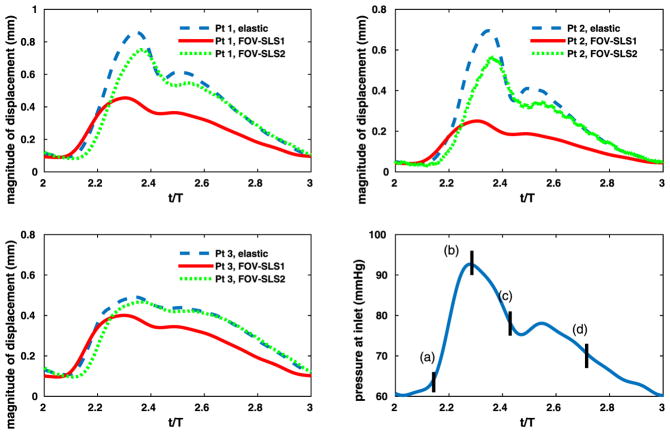
To compare the computed evolution of the aneurysm deformation from different models, we first display the displacement time traces of three points on the interface. The locations of these points are shown in Fig. 22. The computed inlet pressure and the time traces for displacements at these three points are shown in Fig. 23, for the pure elastic model, the FOV-SLS1 and the FOV-SLS2 models. Similar to what we have observed in section 3.3, the FOV-SLS1 model predicts a much smaller deformation compared with that from the other two models, which results in a larger blood pressure drop in each cardiac cycle. A minor phase shift could be observed while comparing the location of the maximum displacement for each model: while the maximum displacements were achieved after the systolic peak in all cases, the case using the FOV-SLS1 model reaches its maximum deformation firstly, then the case using the elastic arterial wall model, and finally the case with the FOV-SLS2 model. To investigate the displacement distribution on the whole aneurysm, we take four time instants in a cardiac cycle: (as marked by black solid lines in the inlet pressure plot of Fig. 23), and display their corresponding displacement amplitudes from the pure elastic, FOV-SLS1 and FOV-SLS2 arterial wall models in Figs. 24, 25 and 26, respectively. It can be observed that although the displacement magnitudes vary for different arterial wall models, the displacement magnitude distribution pattern does not change much.
Fig. 22.
Positions of the history points in patient-specific aneurysm test I at t = 3T/7. (For interpretation of the colors in this figure, the reader is referred to the web version of this article.)
Fig. 23.
Time traces in patient-specific aneurysm with viscoelastic arterial wall models. Upper left, upper right, bottom left: displacement profiles for corresponding points; bottom right: pressure imposed at the inlet.
Fig. 24.
Displacements (in mm) for patient-specific aneurysm with pure elastic arterial wall model, at (upper left), (upper right), (bottom left) and (bottom right). (For interpretation of the colors in this figure, the reader is referred to the web version of this article.)
Fig. 25.
Displacements (in mm) for patient-specific aneurysm with FOV-SLS1 model, at (upper left), (upper right), (bottom left) and (bottom right). (For interpretation of the colors in this figure, the reader is referred to the web version of this article.)
Fig. 26.
Displacements (in mm) for patient-specific aneurysm with FOV-SLS2 model, at (upper left), (upper right), (bottom left) and (bottom right). (For interpretation of the colors in this figure, the reader is referred to the web version of this article.)
4. Summary
In this paper, we have developed an accurate and efficient numerical method for the 3D fractional-order standard linear solid (SLS) model (2.1) by combining a fast convolution method with the spectral element discretization based on a general Jacobi polynomial basis that can be used to generate 3D polymorphic high-order elements. To sustain the high-order accuracy of the backward differentiation formula (BDF), we designed a high-order fast convolution method and verified its third-order convergence rate in time using the third-order three-step BDF method on problems with fabricated analytical solutions. The N log(N) operation count was also verified.
In numerical tests, we investigated the ability of fractional-order model to capture the viscoelastic behavior of arterial walls under fluid–structure interactions. On an idealized artery geometry, we compared several models with the same elasticity parameters and different viscoelastic parameters. This comparison study indicates that for the integer-order SLS models, the viscous behavior strongly depends on the relaxation parameters τε and τσ, while the fractional order models are less sensitive. Especially when the fractional order α →0, the viscous response is less pronounced, and the fractional model is tuned by a single parameter, the fractional order α. This finding is overall consistent with what has been observed for 1D models [1], although model parametrization appears to be relatively more sensitive in the 3D setting. As an example of long-term large-scale simulations, we have also investigated the performance of this fractional aneurysm model on a complex patient-specific geometry.
In ongoing work, we are now investigating the proper fractional parameters specifically for the aneurysm sac using patient-specific data. Since the fractional order is related with the loss of smooth muscle cells, this aneurysm-specific model as well as the numerical tools developed here may help to understand the structural integrity of the aneurysm wall, and therefore contribute in studying the subclasses of unruptured aneurysm walls [49,50].
Acknowledgments
We would like to acknowledge support by the Lehigh FRG faculty research grant, the Simons collaboration grant, and the computational resources of CCV at Brown University and the DOE INCITE program. We also acknowledge support from the NSF grant 1620434, the NIH grant 1U01HL116323-01 and the ARO/MURI grant W911NF-15-1-0562.
References
- 1.Perdikaris P, Karniadakis GE. Fractional-order viscoelasticity in one-dimensional blood flow models. Ann Biomed Eng. 2014;42(5):1012–1023. doi: 10.1007/s10439-014-0970-3. [DOI] [PubMed] [Google Scholar]
- 2.López-Fernández M, Lubich C, Schädle A. Adaptive, fast, and oblivious convolution in evolution equations with memory. SIAM J Sci Comput. 2008;30(2):1015–1037. [Google Scholar]
- 3.Fung Y. Biomechanics: Mechanical Properties of Living Tissues. Springer-Verlag; 1993. [Google Scholar]
- 4.Alastruey J, Khir AW, Matthys KS, Segers P, Sherwin SJ, Verdonck PR, Parker KH, Peiró J. Pulse wave propagation in a model human arterial network: assessment of 1-d visco-elastic simulations against in vitro measurements. J Biomech. 2011;44(12):2250–2258. doi: 10.1016/j.jbiomech.2011.05.041. [DOI] [PMC free article] [PubMed] [Google Scholar]
- 5.Reymond P, Bohraus Y, Perren F, Lazeyras F, Stergiopulos N. Validation of a patient-specific one-dimensional model of the systemic arterial tree. Am J Physiol Heart Circ Physiol. 2011;301(3):H1173–H1182. doi: 10.1152/ajpheart.00821.2010. [DOI] [PubMed] [Google Scholar]
- 6.Eringen AC. Mechanics of Continua. Robert E. Krieger Publishing Co; Huntington, NY: 1980. p. 606. [Google Scholar]
- 7.Doehring TC, Freed AD, Carew EO, Vesely I. Fractional order viscoelasticity of the aortic valve cusp: an alternative to quasilinear viscoelasticity. ASME J Biomech Eng. 2005;127(4):700–708. doi: 10.1115/1.1933900. [DOI] [PubMed] [Google Scholar]
- 8.Craiem DO, Armentano RL. A fractional derivative model to describe arterial viscoelasticity. Biorheology. 2007;44(4):251–263. [PubMed] [Google Scholar]
- 9.Craiem DO, Rojo FJ, Atienza JM, Guinea GV, Armentano RL. Fractional calculus applied to model arterial viscoelasticity. Lat Am Appl Res. 2008;38(2):141–145. [Google Scholar]
- 10.Craiem DO, Rojo FJ, Atienza JM, Armentano RL, Guinea GV. Fractional-order viscoelasticity applied to describe uniaxial stress relaxation of human arteries. Phys Med Biol. 2008;53(17):4543. doi: 10.1088/0031-9155/53/17/006. [DOI] [PubMed] [Google Scholar]
- 11.Mainardi F. Fractional Calculus and Waves in Linear Viscoelasticity: An Introduction to Mathematical Models. World Scientific; 2010. [Google Scholar]
- 12.Podlubny I. Fractional Differential Equations, to Methods of Their Solution and Some of Their Applications. Vol. 198. Academic Press; 1998. Fractional Differential Equations: An Introduction to Fractional Derivatives. [Google Scholar]
- 13.Magin RL. Fractional Calculus in Bioengineering. Begell House Publishers Inc; Redding, CT: 2006. [Google Scholar]
- 14.Steinman DA, Hoi Y, et al. Variability of CFD solutions for pressure and flow in a giant aneurysm: the SBC2012 CFD challenge. J Biomech Eng. 2013;135(2):542–554. doi: 10.1115/1.4023382. (authors are ordered alphabetically by first author within the group) [DOI] [PubMed] [Google Scholar]
- 15.Torii R, Oshima M, Kobayashi T, Takagi K, Tezduyar TE. Computer modeling of cardiovascular fluid–structure interactions with the deforming-spatial-domain/stabilized space–time formulation. Comput Methods Appl Mech Eng. 2006;195(13–16):1885–1895. [Google Scholar]
- 16.Tezduyar TE, Takizawa K, Brummer T, Chen PR. Space–time fluid–structure interaction modeling of patient-specific cerebral aneurysms. Int J Numer Methods Biomed Eng. 2011;27(11):1665–1710. [Google Scholar]
- 17.Torii R, Oshima M, Kobayashi T, Takagi K, Tezduyar TE. Influencing factors in image-based fluid–structure interaction computation of cerebral aneurysms. Int J Numer Methods Fluids. 2011;65(1–3):324–340. [Google Scholar]
- 18.Järvinen E, Råback P, Lyly M, Salenius JP. A method for partitioned fluid–structure interaction computation of flow in arteries. Med Eng Phys. 2008;30(7):917–923. doi: 10.1016/j.medengphy.2007.12.008. [DOI] [PubMed] [Google Scholar]
- 19.Crosetto P, Reymond P, Deparis S, Kontaxakis D, Stergiopulos N, Quarteroni A. Fluid–structure interaction simulation of aortic blood flow. Comput Fluids. 2011;43(1):46–57. [Google Scholar]
- 20.Crosetto P, Deparis S, Fourestey G, Quarteroni A. Parallel algorithms for fluid–structure interaction problems in hemodynamics. SIAM J Sci Comput. 2011;33(4):1598–1622. [Google Scholar]
- 21.Nobile F, Vergara C. An effective fluid–structure interaction formulation for vascular dynamics by generalized Robin conditions. SIAM J Sci Comput. 2008;30(2):731–763. [Google Scholar]
- 22.Bazilevs Y, Hsu MC, Zhang Y, Wang W, Liang X, Kvamsdal T, Brekken R, Isaksen JG. A fully-coupled fluid–structure interaction simulation of cerebral aneurysms. Comput Mech. 2010;46(1):3–16. [Google Scholar]
- 23.Hsu MC, Bazilevs Y. Blood vessel tissue prestress modeling for vascular fluid–structure interaction simulation. Finite Elem Anal Des. 2011;47(6):593–599. [Google Scholar]
- 24.Yu Y, Baek H, Karniadakis GE. Generalized fictitious methods for fluidâstructure interactions: analysis and simulations. J Comput Phys. 2013;245:317–346. [Google Scholar]
- 25.Ford NJ, Simpson AC. The numerical solution of fractional differential equations: speed versus accuracy. Numer Algorithms. 2001;26(4):333–346. [Google Scholar]
- 26.Deng W. Short memory principle and a predictor–corrector approach for fractional differential equations. J Comput Appl Math. 2007;206(1):174–188. [Google Scholar]
- 27.Aceto L, Magherini C, Novati P. On the construction and properties of m-step methods for FDEs. SIAM J Sci Comput. 2015;37(2):A653–A675. [Google Scholar]
- 28.Li JR. A fast time stepping method for evaluating fractional integrals. SIAM J Sci Comput. 2010;31(6):4696–4714. [Google Scholar]
- 29.Lubich C, Schädle A. Fast convolution for nonreflecting boundary conditions. SIAM J Sci Comput. 2002;24(1):161–182. [Google Scholar]
- 30.Baffet DH, Hesthaven JS. Tech rep. Society for Industrial and Applied Mathematics; 2015. A Laplace transform based kernel reduction scheme for fractional differential equations. [Google Scholar]
- 31.Schädle A, López-Fernández M, Lubich C. Fast and oblivious convolution quadrature. SIAM J Sci Comput. 2006;28(2):421–438. [Google Scholar]
- 32.López-Fernández M, Palencia C, Schädle A. A spectral order method for inverting sectorial Laplace transforms. SIAM J Numer Anal. 2006;44(3):1332–1350. [Google Scholar]
- 33.Karniadakis GE, Sherwin SJ. Numerical Mathematics and Scientific Computation. 2. Oxford University Press; Oxford: 2005. Spectral/hp Element Methods for Computational Fluid Dynamics. [Google Scholar]
- 34.Dong S, Yosibash Z. A parallel spectral element method for dynamic three-dimensional nonlinear elasticity problems. Comput Struct. 2009;87(1–2):59–72. [Google Scholar]
- 35.Yu Y, Baek H, Bittencourt ML, Karniadakis GE. Mixed spectral/hp element formulation for nonlinear elasticity. Comput Methods Appl Mech Eng. 2012;213–216(0):42–57. [Google Scholar]
- 36.Yu Y, Bittencourt ML, Karniadakis GE. A semi-local spectral/hp element solver for linear elasticity problems. Int J Numer Methods Eng. 2014;100(5):347–373. [Google Scholar]
- 37.Dong S. BDF-like methods for nonlinear dynamic analysis. J Comput Phys. 2010;229(8):3019–3045. [Google Scholar]
- 38.Talbot A. The accurate numerical inversion of Laplace transforms. IMA J Appl Math. 1979;23(1):97–120. [Google Scholar]
- 39.Rizzardi M. A modification of talbot’s method for the simultaneous approximation of several values of the inverse Laplace transform. ACM Trans Math Software (TOMS) 1995;21(4):347–371. [Google Scholar]
- 40.Idelsohn SR, Del Pin F, Rossi R, Oñate E. Fluid–structure interaction problems with strong added-mass effect. Int J Numer Methods Eng. 2009;80(10):1261–1294. [Google Scholar]
- 41.Causin P, Gerbeau JF, Nobile F. Added-mass effect in the design of partitioned algorithms for fluid–structure problems. Comput Methods Appl Mech Eng. 2005;194(42–44):4506–4527. [Google Scholar]
- 42.Larsson S, Saedpanah F. The continuous Galerkin method for an integro-differential equation modeling dynamic fractional order viscoelasticity. IMA J Numer Anal. 2010;30(4):964–986. [Google Scholar]
- 43.Baek H, Karniadakis GE. A convergence study of a new partitioned fluid–structure interaction algorithm based on fictitious mass and damping. J Comput Phys. 2012;231(2):629–652. [Google Scholar]
- 44.Craiem D, Magin RL. Fractional order models of viscoelasticity as an alternative in the analysis of red blood cell (RBC) membrane mechanics. Phys Biol. 2010;7(1):013001. doi: 10.1088/1478-3975/7/1/013001. [DOI] [PMC free article] [PubMed] [Google Scholar]
- 45.Robertson AM, Hill MR, Li D. Modeling of Physiological Flows. Springer; 2012. Structurally motivated damage models for arterial walls. Theory and application; pp. 143–185. [Google Scholar]
- 46.Bank AJ, Kaiser DR, Rajala S, Cheng A. In vivo human brachial artery elastic mechanics effects of smooth muscle relaxation. Circulation. 1999;100(1):41–47. doi: 10.1161/01.cir.100.1.41. [DOI] [PubMed] [Google Scholar]
- 47.Toth M, Nadasy GL, Nyary I, Kerényi T, Orosz Ms, Molnarka G, Monos E. Sterically inhomogenous viscoelastic behavior of human saccular cerebral aneurysms. J Vasc Res. 1998;35(5):345–355. doi: 10.1159/000025604. [DOI] [PubMed] [Google Scholar]
- 48.Sadasivan C, Fiorella DJ, Woo HH, Lieber BB. Physical factors effecting cerebral aneurysm pathophysiology. Ann Biomed Eng. 2013;41(7):1347–1365. doi: 10.1007/s10439-013-0800-z. [DOI] [PMC free article] [PubMed] [Google Scholar]
- 49.Cebral JR, Duan X, Chung BJ, Putman C, Aziz K, Robertson AM. Wall mechanical properties and hemodynamics of unruptured intracranial aneurysms. Am J Neuroradiol. 2015;36(9):1695–1703. doi: 10.3174/ajnr.A4358. [DOI] [PMC free article] [PubMed] [Google Scholar]
- 50.Robertson AM, Duan X, Aziz KM, Hill MR, Watkins SC, Cebral JR. Diversity in the strength and structure of unruptured cerebral aneurysms. Ann Biomed Eng. 2015:1–14. doi: 10.1007/s10439-015-1252-4. [DOI] [PMC free article] [PubMed] [Google Scholar]


