

Abstract
Background
The four-hour target is a key hospital emergency department performance indicator in England and one that drives the physical and organisational design of the ED. Some studies have identified time of presentation as a key factor affecting waiting times. Few studies have investigated other determinants of breaching the four-hour target. Therefore, our objective was to describe patterns of emergency department breaches of the four-hour wait time target and identify patients at highest risk of breaching.
Methods
This was a retrospective cohort study of a large type 1 Emergency department at an NHS teaching hospital in Oxford, England. We analysed anonymised individual level patient data for 378,873 emergency department attendances, representing all attendances between April 2008 and April 2013. We examined patient characteristics and emergency department presentation circumstances associated with the highest likelihood of breaching the four-hour wait time target.
Results
We used 374,459 complete cases for analysis. In total, 8.3% of all patients breached the four-hour wait time target. The main determinants of patients breaching the four-hour wait time target were hour of arrival to the ED, day of the week, patient age, ED referral source, and the types of investigations patients receive (p < 0.01 for all associations). Patients most likely to breach the four-hour target were older, presented at night, presented on Monday, received multiple types of investigation in the emergency department, and were not self-referred (p < 0.01 for all associations). Patients attending from October to February had a higher odds of breaching compared to those attending from March to September (OR 1.63, 95% CI 1.59 to 1.66).
Conclusions
There are a number of independent patient and circumstantial factors associated with the probability of breaching the four-hour ED wait time target including patient age, ED referral source, the types of investigations patients receive, as well as the hour, day, and month of arrival to the ED. Efforts to reduce the number of breaches could explore late-evening/overnight staffing, access to diagnostic tests, rapid discharge facilities, and early assessment and input on diagnostic and management strategies from a senior practitioner.
Keywords: Four-hour target, Emergency department, Accident and emergency, Performance
Background
In the second quarter of the 2016–2017 financial year, the percentage of patients at type 1 emergency departments (consultant led with 24 h resuscitation services) [1] breaching the government’s four-hour wait-time target in England was 9.55%, the second highest since 2003. [2] Since 2010, acute NHS provider trusts have found it increasingly challenging to meet government targets for the percentage of attendances being admitted, discharged, or transferred within four hours of arrival, which was set at 98% between 2005 and 2011, and at 95% from 2011 onwards.
Long ED waiting times are consistently associated with patient dissatisfaction, [3–6] overcrowding and further exacerbations of wait times leading to negative patient outcomes, including leaving without being seen, [7, 8] and adverse clinical outcomes. [9, 10] The four-hour target was first introduced in England in 2005 and subsequent studies have consistently found it to have reduced patient waiting times. Similar wait time targets have been implemented in Australia (4 h) and New Zealand (6 h) with some beneficial effects on patient outcomes. [11, 12] However, there is debate as to whether clinical outcomes in England have been positively affected. [13–19]
Despite controversy regarding its effect on clinical outcomes, the four-hour target is now a key hospital ED performance indicator in England [20] and one that drives the physical and organisational design of EDs. [21–23] However, few studies have investigated the determinants of patients breaching. [24, 25] Therefore, we analysed all emergency department attendances at a large acute NHS teaching hospital in Oxford, England between 2008 and 2013 to describe patterns of emergency department breaches and identify patients at highest risk of breaching. Predicting which patients are most likely to breach the four-hour target may be valuable to plan services appropriately, meet the needs of patients, and comply with wait time targets.
Methods
This was a retrospective cohort study. All ED attendances at a large NHS teaching hospital in Oxford, England were prospectively recorded by ED clinicians and ED administrative staff using FirstNet and Millenium computer systems between April 2008 and April 2013. Anonymised individual level patient data for 378,873 ED attendances were retrospectively extracted, representing all attendances during the time period studied. Available data fields were patient age, time and date of attendance, length of stay in the ED, referral source (categorised into self-referral [walk-in], general practitioner, emergency services [brought in by ambulance], and other), and investigations whilst in the ED. We categorised investigations to determine the number of different types of investigations patients received as opposed to the number of total investigations (i.e. four x-rays = one type of investigation). We also classified the investigation codes into four groups based on their invasiveness and approximate time required to complete the investigation (Table 1). All variables were tabulated and reviewed to ensure the legitimacy of the data points. We conducted a complete case analysis. Patient records with years of age listed above 110 were excluded on the assumption of incorrect data entry (n = 11). 85 records were excluded because the time of discharge decision was incorrect (i.e., before the time of entry into the ED). 4318 records were excluded due to data missing for one or more variables. Sensitivity analysis showed no differences between the characteristics and breach probabilities for these patients and those included in the analysis. We sought an opinion from the joint research office classification group at the University of Oxford and they confirmed that this activity constituted service evaluation. Therefore, no ethics approval was necessary.
Table 1.
Investigation codes and categories
| Category | Investigation code |
|---|---|
| No investigations ordered | no investigations, other investigationsa |
| Point-of-care tests | electrocardiogram, blood gases, pregnancy test, visual (refraction, orthoptic tests, and computerised visual fields), urinalysis |
| Laboratory tests | haematology, blood matching, biochemistry, urine chemistry, histology, clotting, immunological blood tests, cardiac enzyme, toxicology, blood culture, serology, bacteriology |
| Simple imaging | x-ray plain film |
| Complex imaging | computer assisted tomography (CT) scan, ultrasound, magnetic resonance imaging (MRI) |
aUsed by clinical teams as a default code if none of the other investigations listed in Table 1 were undertaken (descibes history taking and examination)
Statistical analyses
Univariate and multivariate regression analyses were conducted using STATA version 11 (College Station, TX: StataCorp LP). We assessed patient characteristics and ED attendance variables as predictors of breaching the four-hour wait limit. Patient age was found to have a curvilinear relationship with breach probability and therefore we used a piecewise linear function (node at age four) to model this variable in regression analysis. Age four was selected as the node because at this age the nature of the correlation with breach probability changed from negative to positive. When analysing seasonality of breaching we classified October–February inclusive as high season given that these months have been shown in national analyses to correspond with increases in demand for hospital services. [26] Results are presented as odds ratios with 95% confidence intervals (CI).
Differences between patients spending less than four hours in the ED and those spending more than four hours were assessed using the Wilcoxon Rank Sum test for data that were not normally distributed. Chi-square tests with bonferroni corrected post-hoc comparisons were conducted on categorical data to identify differences in characteristics of breaching and non-breaching patients. Given the size of the dataset and associated power of analysis we set the level of significance at p < 0.01 to reduce the likelihood of type 1 errors.
Results
Of 378,873 ED attendances, 374,459 had complete data and were analysed (98.8% of all attendances). Attendances to the ED fluctuated by year with the greatest number occurring between April 2011 and April 2012. Table 2 describes the characteristics of people attending the ED. The majority (69.6%) of attendees were under the age of 50. Most patients arrived between the hours of 8:00 and 20:00 (67.0%). Patients were primarily self-referred (43.8%) or referred by emergency medical services (31.2%) to attend the ED. Other sources of referral included general medical practitioner, dental practitioners, dental practices, community dental services, police, work, educational establishments, and local authority social services. The median waiting time for a decision to admit to hospital or discharge or transfer from the ED was 2 h and 59 min (Interquartile range: 1 h 55 m to 3 h 49 m) with 9.2% of all patients breaching the four-hour wait time target. The proportion of patients breaching the target varied significantly by year (p < 0.01) with the lowest percentage occurring in 2008/2009 (3.35%) and the highest percentage in 2011/2012 (15.4%). With regards to investigations completed in the ED, 39.9% of patients had “no investigations ordered” and 34.9% had the combination of “simple imaging, laboratory tests, and point of care tests”.
Table 2.
Patient characteristics
| Characteristics | Percent (n = 374,459) |
|---|---|
| Age at ED arrival | 31 (17, 56)a |
| 0–4 | 11.7 |
| 5–17 | 13.3 |
| 18–30 | 23.7 |
| 31–64 | 32.0 |
| 65–79 | 9.7 |
| 80+ | 9.1 |
| Time of ED Arrival | |
| 08:00 to 19:59 | 67.0 |
| 20:00 to 07:59 | 33.0 |
| Source of Referral | |
| Self-referral | 43.8 |
| Other sourcesb | 56.2 |
| Number of attendances in the previous financial year | 1 (1, 2)a |
| Number of investigation types | 1 (0, 2)a |
| Investigation categories | |
| No investigations orderedc | 39.3 |
| Point of care only | 3.4 |
| Laboratory tests and point of care | 15.2 |
| Simple imaging, laboratory tests, point of care | 34.9 |
| Complex imaging, simple imaging, laboratory tests, point of care | 7.2 |
| Median length of time spent in ED | 2 h 59 m (1 h 55 m, 3 h 49 m)a,c |
| Patients exceeding the four-hour ED wait target | 9.2 |
ED emergency department
aMedian and interquartile range
bOther types of referral include: emergency services, general medical practitioner, dental practitioners, dental practices, community dental services, police, work, educational establishments, and local authority social services
ch = hours, m = minutes
Figure 1 shows the age distribution of ED attendees and the probability of breaching by age. There were a large number of attendances among children ages 0–3 and younger adults ages 17–30. The largest number of breaches occurred among children less than 3 years of age, young adults ages 18–25, and among the elderly ages 75–89 (Fig. 2). Breaches in the first two groups (0–3, 18–25) appear to be driven by overall attendance numbers as the probability of breaching was low, while breaches in the third group (≥75) seem to be driven by a high breach probability, as the actual number of attendances was low in this group.
Fig. 1.
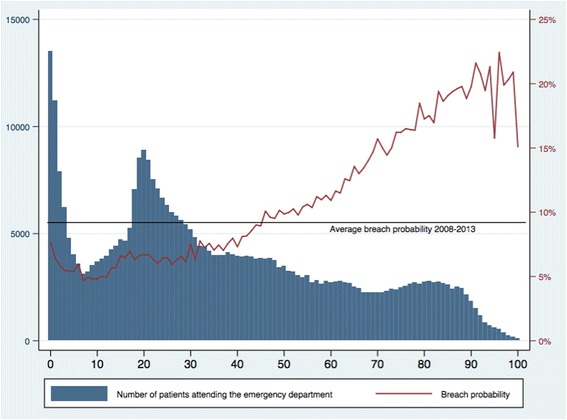
Five-year aggregated data (2008–2013) of emergency department attendances and breach probability by patient age. X-axis: Patient age in single years. Left-hand Y-axis: Number of patients attending the emergency department. Right-hand Y-axis: Probability of breaching the four hour wait target
Fig. 2.
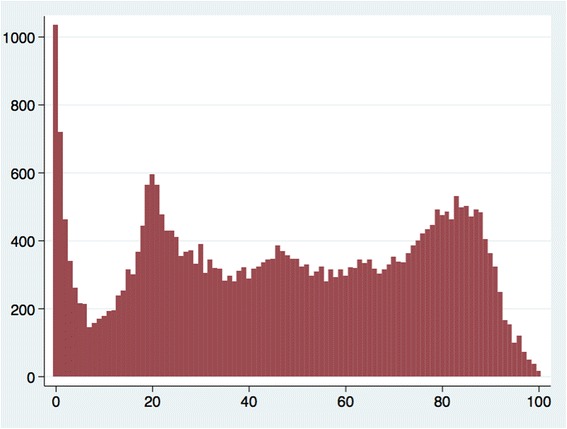
Five-year aggregated data (2008–2013) of the absolute number of emergency department breaches by patient age. X-axis: Patient age in single years. Left-hand Y-axis: Number of patients waiting more than four h in the emergency department
Figure 3 shows the number of patients arriving in ED and the probability of breaching during the day (8:00 to 19:59) and at night (20:00 to 7:59) by age. Although more attendances occurred in the day the probability of breaching was higher for those arriving between 20:00 and 7:59 for all ages compared to day-time attendances. The overall increase in ED breach probability for night-time attendees compared to day-time attendees was 3.6% (p < 0.01).
Fig. 3.
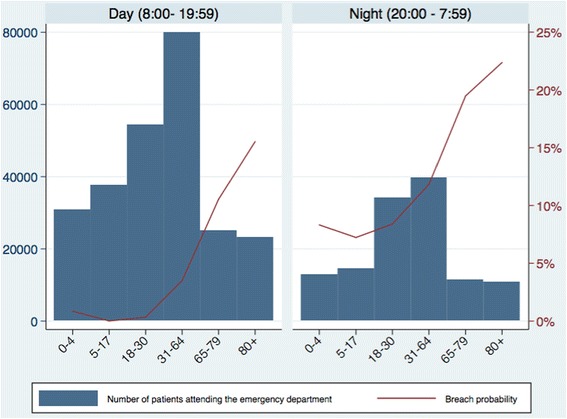
Emergency department attendances and breach probability by age categories in the day and at night. X-axis: Patient age. Left-hand Y-axis: Number of patients attending the emergency department. Right-hand Y-axis: Probability of breaching the four hour wait target
The probability of breaching varied by the day patients attended the ED (Fig. 4). Although most attendances occurred on Saturday, Sunday, and Monday, the greatest probability of breaching was on Monday (10.9%), Tuesday (9.9%), and Wednesday (9.8%) while the lowest probability of breaching was on Saturday (7.8%) and Sunday (8.6%).
Fig. 4.
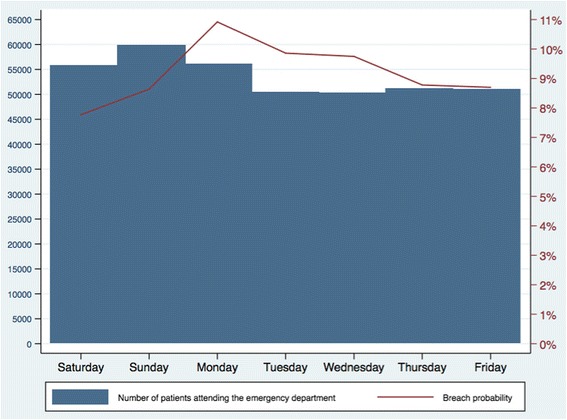
Breach probability by day of arrival to the emergency department. X-axis: Day of the week. Left-hand Y-axis: Number of patients attending the emergency department. Right-hand Y-axis: Probability of breaching the four hour wait target
With regards to the source of referral to the ED, self-referred patients were less likely to breach than patients attending by any other source (5.2% vs. 12.3%, p < 0.001). Sensitivity analysis showed that this pattern was similar across all years (2008–2013).
Figure 5 shows the number of patients receiving different combinations of investigations in the ED and breach probability. Most patients had no investigations ordered or received the combination of simple imaging, laboratory tests, and point-of-care tests. The breach probability was significantly higher for patients receiving investigations (p < 0.001) relative to patients with no investigations ordered.
Fig. 5.
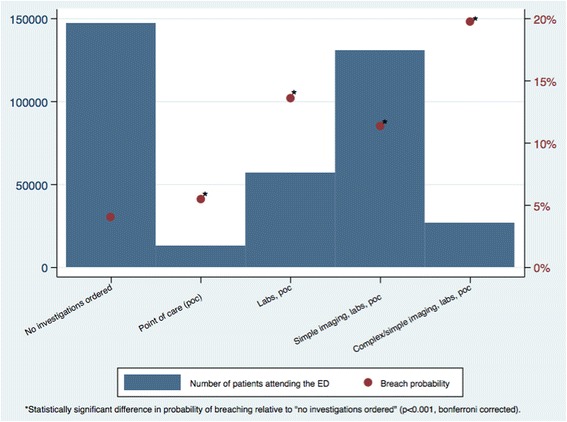
Distribution of investigation categories and the probability of breaching. X-axis: Types of investigations patients received. Left-hand Y-axis: Number of patients attending the emergency department. Right-hand Y-axis: Probability of breaching the four hour wait target
The types of investigations ordered varied by the source of patient referral to the ED. Patients that were self-referred to the ED were less likely to receive multiple types of investigations compared to patients referred to the ED by other sources (p < 0.001). The types of investigations received also varied by patient age (p < 0.001). Older patients appeared to receive more types of investigations compared to younger people.
Table 3 shows adjusted odds ratios from the multivariate logistic regression. All variables were found to have a significant relationship with breaching. Strong independent predictors of waiting more than four hours in the ED included the investigations a patient received, arrival time, day of the week, referral source, and age. Patients with the greatest odds of breaching were: those receiving the most comprehensive combination of investigations (complex imaging, simple imaging, x-ray, laboratory tests, and point-of-care tests) compared to those that had no investigations ordered (OR 4.86, 95% CI 4.63 to 5.10); patients arriving during the night (20:00 to 7:59) compared to day-time (8:00 to 19:59) arrivals (OR 1.50 95% CI 1.47 to 1.54); and patients attending the emergency department on a Monday (compared with Saturday, the day with the lowest odds of breaching, OR 1.50, 95% CI 1.43 to 1.56). With regards to age, a J-shaped relationship was observed with decreasing odds of breaching up to the age of four years (with an average OR 0.84 [95% CI 0.83 to 0.85] for each additional year of age) before the odds of breaching increase with each additional year of age (1.20, 95% CI 1.19 to 1.23).
Table 3.
Results of multivariate logistic regression to predict breaching the four h target
| Variable | Odds ratio with 95% confidence interval | P-Value |
|---|---|---|
| Arrival houra | ||
| 20:00–7:59 | 1.50 (1.47 to 1.54) | <0.001 |
| Day of the weekb | ||
| Monday | 1.50 (1.43 to 1.56) | <0.001 |
| Tuesday | 1.29 (1.24 to 1.35) | <0.001 |
| Wednesday | 1.27 (1.21 to 1.33) | <0.001 |
| Thursday | 1.11 (1.06 to 1.16) | <0.001 |
| Friday | 1.09 (1.04 to 1.14) | <0.001 |
| Sunday | 1.18 (1.13 to 1.23) | <0.001 |
| Age (if younger than 4) | 0.84 (0.83 to 0.85) | <0.001 |
| Age (if 4 or older) | 1.20 (1.19 to 1.23) | <0.001 |
| Self-referralc | 0.59 (0.57 to 0.60) | <0.001 |
| Investigation categoryd | ||
| Point of care | 1.10 (1.01 to 1.19) | <0.001 |
| Labs, point of care | 2.41 (2.32 to 2.51) | <0.001 |
| Simple imaging, labs, point of care | 2.24 (2.16 to 2.51) | <0.001 |
| Complex imaging, simple imaging, laboratory tests, point of care | 4.86 (4.63 to 5.10) | <0.001 |
| Number of attendances in the previous financial year | 1.008 (1.006 to 1.011) | <0.001 |
| Yeare | ||
| 2009 | 1.63 (1.53 to 1.74) | <0.001 |
| 2010 | 2.25 (2.12 to 2.39) | <0.001 |
| 2011 | 4.64 (4.39 to 4.91) | <0.001 |
| 2012 | 4.92 (4.66 to 5.21) | <0.001 |
| 2013 | 4.28 (4.00 to 4.57) | <0.001 |
| Season | ||
| October–February inclusive (high season)f | 1.63 (1.59 to 1.66) | <0.001 |
aCompared to arrival between 8:00–19:59
bThe reference day was Saturday
cCompared to all other types of referral: emergency services, general medical practitioner, dental practitioners, dental practices, community dental services, police, work, educational establishments, and local authority social services
dComparison category is “no investigations ordered”
eThe reference year was 2008
fCompared to ED attendances in March–September inclusive (Low season)
Model metrics: R2 = 12%
Figure 6 shows the number of ED attendances and probability of breaching over time. Season of ED attendance was also significantly associated with breach probability. Patients attending from October to February had a higher odds of breaching compared to those attending from March to September (1.63, 95% CI 1.59 to 1.66). Finally, year had a very strong relationship with breaching. Relative to 2008, attendances during each subsequent year showed an increase in the odds of breaching, with a peak in 2012 (4.92, 95% CI 4.66 to 5.21).
Fig. 6.
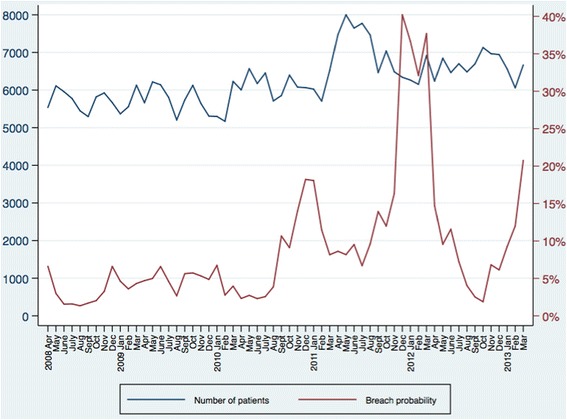
Emergency department attendances and breach probability from 2008 to 2013. X-axis: Year and month. Left-hand Y-axis: Number of patients attending the emergency department. Right-hand Y-axis: Probability of breaching the four hour wait target
Discussion
We analysed over 370,000 emergency department attendances between 2008 and 2013 at a large NHS teaching hospital in Oxford, England. We found the main determinants of patients breaching the four-hour wait time target were hour of arrival to the ED, day of the week, patient age, ED referral source, and the types of investigations patients receive. We also showed a relationship with two macro-level characteristics: the year of attendance and season of attendance, which are highly likely to be markers of variability in congestion within the department.
We found that the patients most likely to breach the four-hour target were older, receiving multiple types of investigation, and not self-referred. These factors all suggest high case complexity. Delays for these patients could be due to challenges in diagnosing and choosing a care plan for complex illness including timely access to imaging and investigations, the availability of senior clinicians with expertise in medicine of older people to assess and treat patients, and the availability of supportive care in the community for patients that may not require hospital bed-based care. These explanations are also likely to explain the significantly higher probability of breaching at night.
A third finding of this study was that breach probability was highest on Mondays, Tuesdays, and Wednesdays. These were not the days of highest volume in the ED however, they did follow the weekend where ED attendance is highest. It is possible that breaches following the weekend are the result of a shortage of inpatient beds or high case complexity from patients who delay seeking care until their registered GP practice is available. [27] High bed occupancy rates, due to delays in transfers of care, have been shown to cause increases in ED wait times as physicians face difficulty admitting to in-patient beds [28]. This phenomenon has been observed in National Studies of A&E performance in England [22].
Our results are similar to those of previous authors [24, 25, 29]. For example, Goodacre et al. conducted a multivariate analysis of routine data collected on 71,000 patients in Sheffield and showed that older age, presentation at night, and presentation on Sunday and Monday were significantly associated with breach probability [24]. The authors concluded that the most important factors affecting waiting times were related to time of presentation.
Our analysis is novel as it has identified the burden of diagnostic testing as an independent predictor of breaching. We have also shown how the relationship between age and breaching differs across the age spectrum, with a large proportion of breaching cases among children and young adults being the result of high volume at a low breach probability, and a large portion of cases among the elderly due to high breach probability despite a low volume.
Our data suggest that policies to reduce the number of breaches could explore overnight staffing on select weekdays, expanding access to imaging and diagnostic tests, improving availability of senior clinicians with expertise in medicine of older people to asses and treat patients, and rapid discharge facilities [30–32]. One strategy shown in observational studies to have some success in reducing ED length of stay is early assessment and input on diagnostic and management strategy from a senior practitioner. Given the burden of diagnostic testing shown in our study, this strategy may be worth exploring in more robust studies.
The major strength of this study is that includes five years of data with nearly 400,000 ED attendances. Limitations include this being a single centre study and the results may have limited generalisability. However, our results are similar to those of previously published research and our findings may be applicable in other academic type 1 emergency departments. Second, this was an analysis of routinely collected data and we did not have access to several important variables that may impact upon breach probability including specific information on disease severity, sex, triage score, discharge disposition, staff training levels (junior vs non junior physicians), social and economic deprivation, and direct measures of department congestion such as bed occupancy, match of supply and demand (e.g., overall ED census to staffing), door to provider time, and inpatient flow (e.g., boarding).
Conclusions
In summary, we have identified a number of factors associated with the probability of breaching the four-hour emergency department wait time target including patient age, ED referral source, the types of investigations patients receive, as well as the hour, day, and month of arrival to the ED. Patients most likely to breach the four-hour target were older, presented at night, presented on Monday, received multiple types of investigation in the ED, and were not self-referred. The results of this study may be used by policy- and decision-makers to identify possible approaches to reducing breaching of the four-hour performance target, including overnight staffing on select weekdays, expertise of clinicians undertaking assessments, expanding access to imaging and diagnostic tests, and rapid discharge facilities.
Acknowledgements
Not applicable.
Funding
This was an unfunded study. Mr. Niklas Bobrovitz is funded by a Clarendon Scholarship, a Goodger and Schorstein Scholarship, and the NIHR School for Primary Care Research. When this work was conducted, Dr. Adam Briggs was at the University of Oxford and funded by a Wellcome Trust Research Training Fellowship (grant number 102730/Z/13/Z). Dr. Daniel Lasserson was funded by the NIHR Oxford Biomedical Research Centre. The opinions expressed in this study are those of the authors and not necessarily those of the NIHR, the Department of Health or the NHS.
Availability of data and materials
The datasets used and/or analysed during the current study are available from the corresponding author on reasonable request. All authors had full access to all of the data (including statistical reports and tables) in the study and can take responsibility for the integrity of the data and the accuracy of the data analysis.
Abbreviations
- A&E
accident and emergency
- CI
confidence interval
- ED
emergency department
- NHS
national health service
- OR
odds ratio
Authors’ contributions
NB, DL, and AB all contributed to the conception and design of the study. NB analysed the data. NB, DL, and AB interpreted the data, drafted the manuscript, critically revised the work, and approved the final version.
Ethics approval and consent to participate
We sought an opinion from the joint research office classification group at the University of Oxford and they confirmed that this activity constituted service evaluation. Therefore, no ethics approval was necessary.
Consent for publication
Not applicable.
Competing interests
The authors declare no competing interests.
Publisher’s Note
Springer Nature remains neutral with regard to jurisdictional claims in published maps and institutional affiliations.
Contributor Information
Niklas Bobrovitz, Email: niklas.bobrovitz@phc.ox.ac.uk.
Daniel S. Lasserson, Email: D.S.Lasserson@bham.ac.uk
Adam D. M. Briggs, Email: adam.briggs@dartmouth.edu
References
- 1.National Health Service England . Accident and emergency department type. 2017. [Google Scholar]
- 2.The King’s Fund. Quarterly Monitoring Report 15 2015.
- 3.Hunt MT, Glucksman ME. A review of 7 years of complaints in an inner-city accident and emergency department. Emerg Med J. 1991;8:17–23. doi: 10.1136/emj.8.1.17. [DOI] [PMC free article] [PubMed] [Google Scholar]
- 4.Trout A, Magnusson AR, Hedges JR. Patient satisfaction investigations and the emergency department: what does the literature say? Acad Emerg Med. 2000;7:695–709. doi: 10.1111/j.1553-2712.2000.tb02050.x. [DOI] [PubMed] [Google Scholar]
- 5.Booth AJ, Harrison CJ, Gardener GJ, Gray AJ. Waiting times and patient satisfaction in the accident and emergency department. Emerg Med J. 1992;9:162–168. doi: 10.1136/emj.9.2.162. [DOI] [PMC free article] [PubMed] [Google Scholar]
- 6.Vezyridis P, Timmons S. National targets, process transformation and local consequences in an NHS emergency department (ED): a qualitative study. BMC Emerg Med. 2014;14:12. doi: 10.1186/1471-227X-14-12. [DOI] [PMC free article] [PubMed] [Google Scholar]
- 7.Hobbs D, Kunzman SC, Tandberg D, Sklar D. Hospital factors associated with emergency center patients leaving without being seen. Am J Emerg Med. 2000;18:767–772. doi: 10.1053/ajem.2000.18075. [DOI] [PubMed] [Google Scholar]
- 8.Fernandes CMB, Price A, Christenson JM. Does reduced length of stay decrease the number of emergency department patients who leave without seeing a physician? J Emerg Med. 1997;15:397–399. doi: 10.1016/S0736-4679(97)00030-9. [DOI] [PubMed] [Google Scholar]
- 9.Guttmann A, Schull MJ, Vermeulen MJ, Stukel TA. Association between waiting times and short term mortality and hospital admission after departure from emergency department: population based cohort study from Ontario, Canada. BMJ. 2011;342:d2983. doi: 10.1136/bmj.d2983. [DOI] [PMC free article] [PubMed] [Google Scholar]
- 10.Sprivulis PC, Da Silva J-A, Jacobs IG, Frazer ARL, Jelinek GA. The association between hospital overcrowding and mortality among patients admitted via western Australian emergency departments. Med J Aust. 2006;184:208–212. doi: 10.5694/j.1326-5377.2006.tb00416.x. [DOI] [PubMed] [Google Scholar]
- 11.Sullivan C, Staib A, Khanna S, Good N, Boyle J, Cattell R, et al. The National Emergency Access Target (NEAT) and the 4-hour rule: time to review the target. Med J Aust. 1016;204:354. doi: 10.5694/mja15.01177. [DOI] [PubMed] [Google Scholar]
- 12.Jones P, Wells S, Harper A, Le Fevre J, Stewart J, Curtis E, et al. Impact of a national time target for ED length of stay on patient outcomes. N Z Med J. 2017;130:15–34. [PubMed] [Google Scholar]
- 13.Jones P, Schimanski K. The four hour target to reduce emergency department “waiting time”: a systematic review of clinical outcomes. Emerg Med Australas. 2010;22:391–398. doi: 10.1111/j.1742-6723.2010.01330.x. [DOI] [PubMed] [Google Scholar]
- 14.Weber EJ, Mason S, Freeman JV, Coster J. Implications of England’s four-hour target for quality of care and resource use in the emergency department. Ann Emerg Med. 2012;60:699–706. doi: 10.1016/j.annemergmed.2012.08.009. [DOI] [PubMed] [Google Scholar]
- 15.Kelman S, Friedman JN. Performance improvement and performance dysfunction: an empirical examination of distortionary impacts of the emergency room wait-time target in the English National Health Service. J Public Adm Res Theory. 2009;19:917–946. doi: 10.1093/jopart/mun028. [DOI] [Google Scholar]
- 16.Freeman JV, Croft S, Cross S, Yap C, Mason S. The impact of the 4 h target on patient care and outcomes in the emergency department: an analysis of hospital incidence data. Emerg Med J. 2010;27:921–927. doi: 10.1136/emj.2009.085431. [DOI] [PubMed] [Google Scholar]
- 17.Mason S, Weber EJ, Coster J, Freeman J, Locker T. Time patients spend in the emergency department: England’s 4-hour rule-a case of hitting the target but missing the point? Ann Emerg Med. 2012;59:341–349. doi: 10.1016/j.annemergmed.2011.08.017. [DOI] [PubMed] [Google Scholar]
- 18.Bevan G. Have targets done more harm than good in the English NHS? No BMJ. 2009;338:a3129. doi: 10.1136/bmj.a3129. [DOI] [PubMed] [Google Scholar]
- 19.Gubb J. Have targets done more harm than good in the English NHS? Yes BMJ. 2009;338:a3130. doi: 10.1136/bmj.a3130. [DOI] [PubMed] [Google Scholar]
- 20.England NHS. A&E attendances and emergency admissions. 2015. [Google Scholar]
- 21.Cooke MW, Wilson S, Pearson S. The effect of a separate stream for minor injuries on accident and emergency department waiting times. Emerg Med J. 2002;19:28–30. doi: 10.1136/emj.19.1.28. [DOI] [PMC free article] [PubMed] [Google Scholar]
- 22.National Audit office . London. 2004. Improving emergency Care in England. [Google Scholar]
- 23.Estates NHS. London. 2005. HBN 22 accident and emergency facilities for adults and children. 2nd edition. [Google Scholar]
- 24.Goodacre S, Webster A. Who waits longest in the emergency department and who leaves without being seen? Emerg Med J. 2005;22:93–96. doi: 10.1136/emj.2003.007690. [DOI] [PMC free article] [PubMed] [Google Scholar]
- 25.Blunt I. London. 2014. Focus on: a&E attendances. Why are patients waiting longer? [Google Scholar]
- 26.National Health Service England. Understanding winter pressures in a&E departments n.d. https://www.england.nhs.uk/wp-content/uploads/2013/11/wint-press-rep.pdf.
- 27.Lasserson DS, Chandratheva A, Giles MF, Mant D, Rothwell PM. Influence of general practice opening hours on delay in seeking medical attention after transient ischaemic attack (TIA) and minor stroke: prospective population based study. BMJ. 2008;337:a1569. doi: 10.1136/bmj.a1569. [DOI] [PMC free article] [PubMed] [Google Scholar]
- 28.Monitor . England. 2015. A&E delays: why did patients wait longer last winter? [Google Scholar]
- 29.Elkum N, Fahim M, Shoukri MA-MA. Which patients wait longer to be seen and when? A waiting time study in the emergency department. East Mediterr Heal J. 2009;15:416–424. [PubMed] [Google Scholar]
- 30.Rogg JG, White BA, Biddinger PD, Chang YBDA. Long-term analysis of physician triage screening in the emergency department. Acad Emerg Med. 2013;20:374–380. doi: 10.1111/acem.12113. [DOI] [PubMed] [Google Scholar]
- 31.Russ S, Jones I, Aronsky D, Dittus RSSC. Placing physician orders at triage: the effect on length of stay. Ann Emerg Med. 2010;56:27–33. doi: 10.1016/j.annemergmed.2010.02.006. [DOI] [PubMed] [Google Scholar]
- 32.White BA, Brown DF, Sinclair J, Chang Y, Carignan S, McIntyre JBP. Supplemented triage and rapid treatment (START) improves performance measures in the emergency department. J Emerg Med. 2012;42:322–328. doi: 10.1016/j.jemermed.2010.04.022. [DOI] [PubMed] [Google Scholar]
Associated Data
This section collects any data citations, data availability statements, or supplementary materials included in this article.
Data Availability Statement
The datasets used and/or analysed during the current study are available from the corresponding author on reasonable request. All authors had full access to all of the data (including statistical reports and tables) in the study and can take responsibility for the integrity of the data and the accuracy of the data analysis.