

Introduction
We identified rare coding variants associated with Alzheimer’s disease (AD) in a 3-stage case-control study of 85,133 subjects. In stage 1, 34,174 samples were genotyped using a whole-exome microarray. In stage 2, we tested associated variants (P<1×10⁻⁴) in 35,962 independent samples using de novo genotyping and imputed genotypes. In stage 3, an additional 14,997 samples were used to test the most significant stage 2 associations (P<5×10⁻⁸) using imputed genotypes. We observed 3 novel genome-wide significant (GWS) AD associated non-synonymous variants; a protective variant in PLCG2 (rs72824905/p.P522R, P=5.38×10⁻¹⁰, OR=0.68, MAFcases=0.0059, MAFcontrols=0.0093), a risk variant in ABI3 (rs616338/p.S209F, P=4.56×10⁻¹⁰, OR=1.43, MAFcases=0.011, MAFcontrols=0.008), and a novel GWS variant in TREM2 (rs143332484/p.R62H, P=1.55×10⁻¹⁴, OR=1.67, MAFcases=0.0143, MAFcontrols=0.0089), a known AD susceptibility gene. These protein-coding changes are in genes highly expressed in microglia and highlight an immune-related protein-protein interaction network enriched for previously identified AD risk genes. These genetic findings provide additional evidence that the microglia-mediated innate immune response contributes directly to AD development.
Late-onset AD (LOAD) has a significant genetic component (h2=58-79%1). Nearly 30 LOAD susceptibility loci2-12 are known, and risk is significantly polygenic13. However, these loci explain only a proportion of disease heritability. Rare variants also contribute to disease risk14-17. Recent sequencing studies identified a number of genes that have rare variants associated with AD9-11,18-24. Our approach to rare-variant discovery is to genotype a large sample with micro-arrays targeting known exome variants with follow-up using genotyping and imputed genotypes in a large independent sample. This is a cost-effective alternative to de novo sequencing25-29.
We applied a 3-stage design (Supplementary Figure 1) using subjects from the International Genomics of Alzheimer’s Project (IGAP)(Table 1, Supplementary Tables 1 & 2). In stage 1, 16,097 LOAD cases and 18,077 cognitively normal elderly controls were genotyped using the Illumina HumanExome microarray. Data from multiple consortia were combined in a single variant meta-analysis (Online Methods) assuming an additive model. In total, 241,551 variants passed quality-control (Supplementary Table 3). Of these 203,902 were polymorphic, 26,947 were common (minor allele frequency (MAF)≥5%), and 176,955 were low frequency or rare (MAF<5%). We analyzed common variants using a logistic regression model in each sample cohort and combined data using METAL30. Rare and low frequency variants were analyzed using the score test and data combined with SeqMeta31 (Supplementary Figure 2).
Table 1.
Summary of the consortium data sets used for stages 1, 2 and stage 3. Data are from the Genetic and Environmental Risk for Alzheimer’s Disease (GERAD)/Defining Genetic, Polygenic and Environmental Risk for Alzheimer’s Disease (PERADES) Consortium, the Alzheimer’s Disease Genetic Consortium (ADGC), the Cohorts for Heart and Aging Research in Genomic Epidemiology (CHARGE) and the European Alzheimer’s disease Initiative (EADI)(Supplement 1).
| Consortium | N Controls | N Cases | N Total | |
|---|---|---|---|---|
| Stage 1 | GERAD/PERADES | 2974 | 6000 | 8974 |
| ADGC | 7002 | 8706 | 15708 | |
| CHARGE | 8101 | 1391 | 9492 | |
| Total | 18077 | 16097 | 34174 | |
|
| ||||
| Stage 2 | GERAD/PERADES genotype | 5049 | 4049 | 9098 |
| CHARGE-genotype | 1839 | 1434 | 3273 | |
| CHARGE-in silico | 3246 | 722 | 3968 | |
| EADI-genotype | 11787 | 7836 | 19623 | |
| Total | 21921 | 14041 | 35962 | |
|
| ||||
| Stage 3 | ADGC-in silico | 8345 | 6652 | 14997 |
|
| ||||
| Stage 1 + 2 + 3 | ||||
| Total | 48402 | 37022 | 85133 | |
We reviewed cluster plots for variants showing association (P<1×10⁻⁴) and identified 43 candidate variants (Supplementary Table 4) exclusive of known risk loci (Supplementary Table 5). Stage 2 tested these for association in 14,041 LOAD cases and 21,921 controls, using de novo and imputation derived genotypes (Online Methods). We carried forward single nucleotide variants (SNVs) with GWS associations and consistent directions of effect to stage 3 where genotypes for 6,652 independent cases and 8,345 controls were imputed using the Haplotype Reference Consortium resource32,33 (Online Methods, Supplementary Table 6).
We identified four rare coding variants with GWS association signals with LOAD (P<5×10⁻⁸)(Table 2, Supplementary Tables 7 & 8). The first is a missense variant p.P522R (P=5.38×10⁻¹⁰, OR=0.68) in Phospholipase C Gamma 2 (PLCG2)(Table 2, Figure 1a, Supplementary Table 9, Supplementary Figure 3). This variant is associated with decreased risk of LOAD, showing a MAF of 0.0059 in cases and 0.0093 in controls. The reference allele (p.P522) is conserved across several species (Supplementary Figure 4). Gene-wide analysis showed nominal evidence for association at P=1.52×10⁻⁴ (Supplementary Tables 10 & 11) and we found no other independent association at this gene (Supplementary Figure 5).
Table 2.
Summary of stage 1, 2, 3 and combined meta-analysis results for SNVs at P<5×10⁻⁸. Data includes p-values, odds ratios (OR), minor allele frequency (MAF) in cases and controls and number of subjects included in each analytical stage. For OR 95% confidence intervals see Supplementary Table 7.
| SNV | rs75932628 | rs143332484 | rs72824905 | rs616338 |
|---|---|---|---|---|
| Chr | 6 | 6 | 16 | 17 |
| Position | 41129252 | 41129207 | 81942028 | 47297297 |
| Protein Variation | R47H | R62H | P522R | S209F |
| Gene | TREM2 | TREM2 | PLCG2 | ABI3 |
| Effect Allele | T | T | G | T |
|
| ||||
|
Stage 1
| ||||
| P | 3.02E-12 | 3.48E-09 | 1.19E-05 | 2.16E-05 |
| OR | 2.46 | 1.58 | 0.65 | 1.42 |
| MAF Cases | 0.003 | 0.015 | 0.006 | 0.013 |
| MAF Controls | 0.001 | 0.010 | 0.011 | 0.010 |
| N | 30018 | 33786 | 33786 | 33786 |
|
| ||||
|
Stage 2
| ||||
| P | 4.38E-08 | 3.66E-07 | 1.35E-04 | 8.37E-05 |
| OR | 2.37 | 3.97 | 0.70 | 1.41 |
| MAF Cases | 0.004 | 0.014 | 0.006 | 0.010 |
| MAF Controls | 0.002 | 0.006 | 0.008 | 0.008 |
| N | 35831 | 3968 | 35831 | 35831 |
|
| ||||
|
Stage 3
| ||||
| P | 1.23E-06 | 2.45E-03 | 2.48E-02 | 1.75E-02 |
| OR | 2.58 | 1.55 | 0.69 | 1.58 |
| MAF Cases | 0.006 | 0.012 | 0.006 | 0.010 |
| MAF Controls | 0.003 | 0.008 | 0.007 | 0.008 |
| N | 14884 | 15288 | 15288 | 14876 |
|
| ||||
|
Stage1, 2 and 3 Meta-Analysis
| ||||
| P | 5.38E-24 | 1.55E-14 | 5.38E-10 | 4.56E-10 |
| OR | 2.46 | 1.67 | 0.68 | 1.43 |
| MAF Cases | 0.004 | 0.014 | 0.006 | 0.011 |
| MAF Controls | 0.002 | 0.009 | 0.009 | 0.008 |
| N | 80733 | 53042 | 84905 | 84493 |
Note: Concordance for alternate allele carrier genotypes between imputed versus called SNPs in Stage 3 was 75.2% for rs75932628, 91.1% for rs143332484, 95.7% for rs72824905, and 81.9% for rs616338 (Online Methods and Supplementary Table 6).
Figure 1.
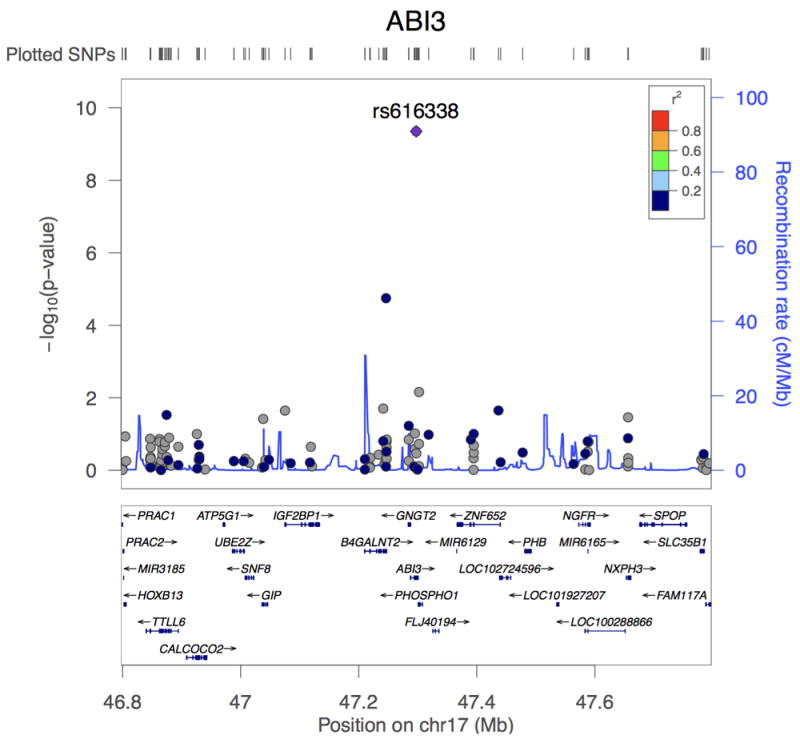
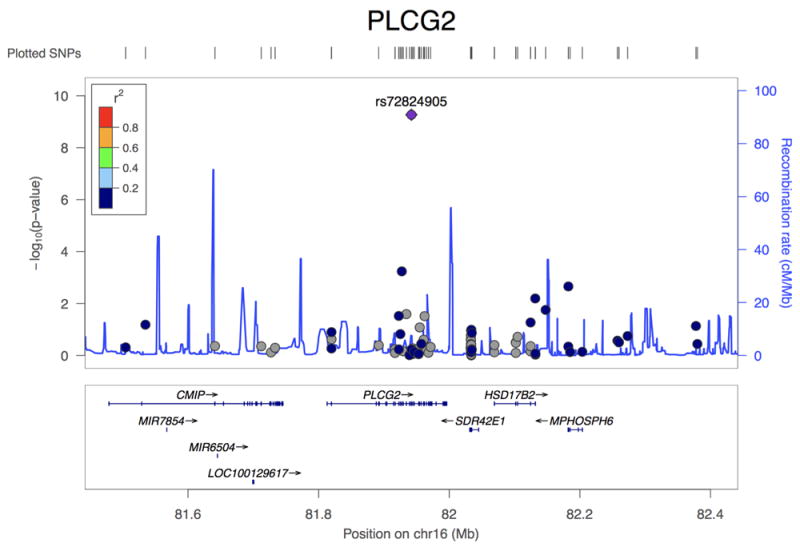
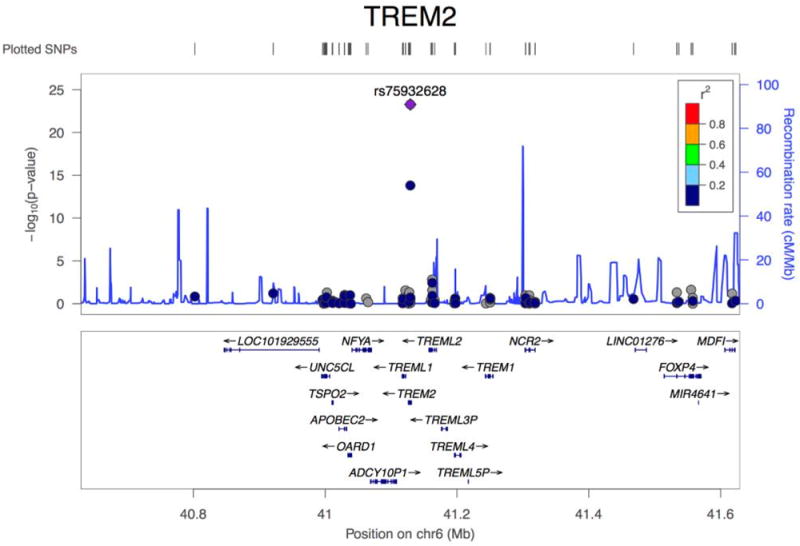
Association plots of PLCG2, ABI3, and TREM2. (a) Regional plot of identified association at the PLCG2 locus. Top hit rs72824905 indicated in purple. Data presented for rs72824905 includes stage 1, stage 2 and stage 3 (N=84,905). (b) Regional plot of identified association at the ABI3 locus. Top hit rs616338 indicated in purple. Data presented for rs616338 includes stage 1, stage 2 and stage 3 (N=84,493). (c) Regional plot of identified association at the TREM2 locus. Top hit rs75932628 indicated in purple. Data presented for rs75932628 and rs143332484 includes stage 1, stage 2 and stage 3 (N=80,733 and 53,042, respectively). SNVs with missing LD information are shown in grey.
The second novel association is a missense change p.S209F (P=4.56×10⁻¹⁰, OR=1.43) in B3 domain-containing transcription factor ABI3 (ABI3). The p.F209 variant shows consistent evidence for increasing LOAD risk across all stages, with a MAF of 0.011 in cases and 0.008 in controls (Table 2, Figure 1b, Supplementary Table 12, Supplementary Figure 6). The reference allele is conserved across multiple species (Supplementary Figure 7). Gene-wide analysis showed nominal evidence of association (P=5.22×10⁻⁵)(Supplementary Tables 10 & 11). The B4GALNT2 gene, adjacent to ABI3, contained an independent suggestive association (Supplementary Figure 8), but this failed to replicate in subsequent stages (Pcombined=1.68×10⁻⁴)(Supplementary Table 7).
Following reports of suggestive association with LOAD34,35, we report the first evidence for GWS association at TREM2 coding variant p.R62H (P=1.55×10⁻¹⁴, OR=1.67), with a MAF of 0.0143 in cases and 0.0089 in controls (Table 2, Figure 1c, Supplementary Table 13, Supplementary Figures 9 & 10). We also observed evidence for the previously reported9,11 TREM2 rare variant p.R47H (Table 2). These variants are not in linkage disequilibrium (Supplementary Table 14) and conditional analyses confirmed that p.R62H and p.R47H are independent risk variants (Supplementary Figure 11). Gene-wide analysis of TREM2 showed a GWS association (PSKAT=1.42×10⁻¹⁵)(Supplementary Tables 10 & 11). Removal of p.R47H and p.R62H variants from the analysis diminished the gene-wide association but the signal remains interesting (PSKAT-O=6.3×10⁻³, PBurden=4.1×10⁻³). No single SNV was responsible for the remaining gene-wide association (Supplementary Table 13, Supplementary Figure 11) suggesting that there are additional TREM2 risk variants in TREM2. We previously reported a common variant LOAD association near TREM2, in a GWAS of cerebrospinal fluid tau and P-tau36. We also observed a different suggestive common variant signal in another LOAD case-control study (P=6.3×10⁻⁷)2.
We previously identified 8 gene pathway clusters significantly enriched in AD-associated common variants36. To test whether biological enrichments observed in common variants are also present in rare variants we used the rare-variant data (MAF<1%) to reanalyze these eight AD-associated pathway clusters (Online Methods, Supplementary Table 15). We used Fisher’s method to combine gene-wide p-values for all genes in each cluster. After correction for multiple testing, we observed enrichment for immune response (P=8.64×10⁻³), cholesterol transport (P=3.84×10⁻⁵), hemostasis (P=2.10×10⁻³), Clathrin/AP2 adaptor complex (P=9.20×10⁻⁴) and protein folding (P=0.02). We also performed pathway analyses on the rare variant data presented here using all 9,816 pathways used previously. The top pathways are related to lipoprotein particles, cholesterol efflux, B-cell differentiation and immune response, areas of biology also enriched when common variants are analyzed37(Supplementary Table 16).
Previous analysis of normal brain co-expression networks identified 4 gene modules that are enriched for common variants associated with LOAD risk2,37,11. These 4 modules are enriched for immune response genes. We identified 151 genes present in 2 or more of these 4 modules and these showed a strong enrichment for LOAD-associated common variants (P=4.0×10⁻⁶)36 and for rare variants described here (MAF<1%)(Supplementary Table 15P=1.17×10⁻⁶). We then used a set of high-quality protein-protein interactions37 to construct, from these 151 genes, an interaction network containing 56 genes, including PLCG2, ABI3 and TREM2 (Figure 2)(Online Methods). This subset is strongly enriched for association signals from both the previous common variant analysis (P=5.0×10⁻⁶, Supplementary Table 17) and this rare variant gene-set analysis (P=1.08×10⁻⁷, Supplementary Table 15). The remaining 95 genes only have nominally-significant enrichment for either common or rare variants (Supplementary Tables 15 & 17), suggesting that the 56-gene (Supplementary Table 18) network is driving the enrichment.
Figure 2.
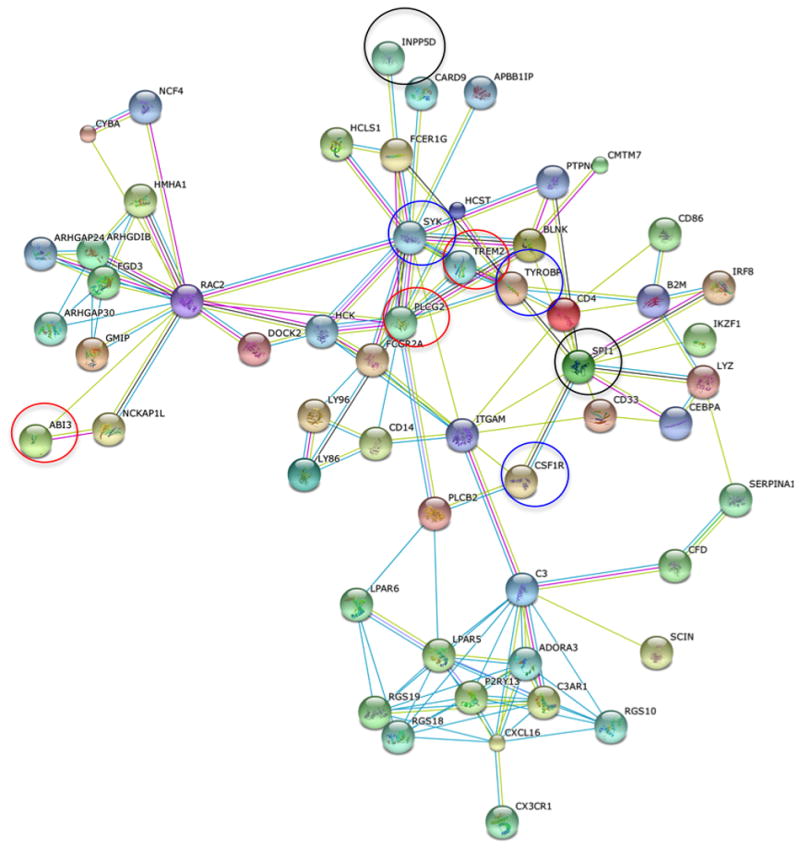
Protein-protein interaction network (using high-confidence human interactions from the STRING database) of 56 genes enriched for both common and rare variants associated with AD risk. Colours of edges refer to the type of evidence linking the corresponding proteins: red=gene fusion, dark blue = co-occurrence, black = co-expression, magenta = experiments, cyan=databases, light green = text mining, mauve = homology. TREM2, PLCG2 and ABI3 highlighted by red circles, SYK, CSF1R and TYROBP highlighted by blue circles, and INPP5D, SPI1 and CD33 identified as common variant risk loci2,5-7, highlighted by black circles.
TREM2, ABI3 and PLCG2 have a common expression pattern in human brain cortex, with high expression in microglia cells and limited expression in neurons, oligodendrocytes, astrocytes and endothelial cells (Supplementary Figure 12)38. Other known LOAD loci with the same expression pattern include SORL1, the MS4A gene cluster, and HLA-DRB1. PLCG2, ABI3, and TREM2 are up-regulated in LOAD human cortex and in two APP mouse models. However, when corrected for levels of other microglia genes, these changes in expression appear to be related to microgliosis (Supplementary Tables 19 & 20).
PLCG2 (Supplementary Figure 13) encodes a transmembrane signaling enzyme (PLCγ2) that hydrolyses the membrane phospholipid PIP2 (1-phosphatidyl-1D-myo-inositol 4,5-bisphosphate) to secondary messengers IP3 (myo-inositol 1,4,5-trisphosphate) and DAG (diacylglycerol). IP3 is released into the cytosol and acts at the endoplasmic reticulum where it binds to ligand-gated ion channels to increase cytoplasmic Ca2+. DAG remains bound to the plasma membrane where it activates two major signaling molecules, protein kinase C (PKC) and Ras guanyl nucleotide-releasing proteins (RasGRPs), which initiate the NF-κB and mitogen-activated protein kinase (MAPK) pathways. While the IP3/DAG/Ca+2 signaling pathway is active in many cells and tissues, in brain, PLCG2 is primarily expressed in microglial cells. PLCG2 variants also cause Antibody Deficiency and Immune Dysregulation (PLAID) and Autoinflammation and PLAID (APLAID)39. Genomic deletions (PLAID) and missense mutations (APLAID) affect the cSH2 autoinhibitory regulatory region. The result is a complex mix of loss and gain of function in cellular signalling39.
Functional annotation (Supplementary Table 21) suggests ABI3 (Supplementary Figure 14) plays a role in the innate immune response via interferon-mediated signaling40. ABI3 is co-expressed with INPP5D (P=2.2×10⁻¹⁰), a gene previously implicated in LOAD risk2. ABI3 plays a significant role in actin cytoskeleton organization through participation in the WAVE2 complex41, a complex that regulates multiple pathways leading to T-cell activation42.
TREM2 encodes a transmembrane receptor present in the plasma membrane of brain microglia (Supplementary Figure 15). TREM2 protein forms an immune-receptor-signaling complex with DAP12. Receptor activation results in activation of Syk and ZAP70 signaling which in turn activates PI3K activity and influences PLCγ2 activity43. In microglia, TREM2-DAP12 induces an M2-like activation44 and participates in recognition of membrane debris and amyloid deposits resulting in microglial activation and proliferation45-47. When TREM2 knockout (KO) or TREM2 heterozygous KO mice are crossed with APP-transgenics that develop plaques, the size and number of microglia associated with plaques are markedly reduced46,47. TREM2 risk variants are located within exon 2, which is predicted to encode the conserved ligand binding extracellular region of the protein. Any disruption in this region may attenuate or abolish TREM2 signaling, resulting in the loss or decrease in TREM2 function47.
The 56-gene interaction network identified here is enriched in immune response genes and includes TREM2, PLCG2, ABI3, SPI1, INPP5D, CSF1R, SYK and TYROBP (Figure 2). SPI1 is a central transcription factor in microglial activation state that has a significant gene-wide association with AD5 and is in the proximity of GWS signals identified by IGAP2. Loss-of function mutations in CSF1R cause hereditary diffuse leukoencephalopathy with spheroids, a white matter disease related to microglial dysfunction48. Activated microglial cells surround plaques49,50, a finding consistently observed in AD brain and AD transgenic mouse models51. In AD mouse model brain, synaptic pruning associates with activated microglial signalling52. Pharmacological targeting of CSF1R inhibits microglial proliferation and shifts the microglial inflammatory profile to an anti-inflammatory phenotype in murine models53. SYK regulates Aβ production and tau hyperphosphorylation54, is affected by the INPP5D/CD2AP complex55 encoded by two LOAD associated genes2, and mediates phosphorylation of PLCG256. Notably, the anti-hypertensive drug Nilvadipine, currently in a phase III AD clinical trial, targets SYK as well as TYROBP, a hub gene in an AD-related brain expression network38, that encodes the TREM2 complex protein DAP12.
We identified three rare coding variants in PLCG2, ABI3 and TREM2 with GWS associations with LOAD that are part of a common innate immune response. This work provides additional evidence that the microglial response in LOAD is directly part of a causal pathway leading to disease and is not simply a downstream consequence of neurodegeneration46,47,57,58. Our network analysis supports this conclusion. In addition, PLCγG2, as an enzyme, represents the first classically drug-able target to emerge from LOAD genetic studies. The variants described here account for a small portion of the ‘missing heritability of AD’. The remaining heritability may be due to a large number of common variants of small effect size. For rare variants, there may be additional exonic sites with lower MAF or effect size, and/or intronic and intergenic sites. Complete resolution of AD heritability will be facilitated by larger sample sizes and more comprehensive sequence data.
Data Availability
Summary statistics for the 43 genetic associations identified are provided in Supplementary Table 6.
Stage 1 data (individual level) for the GERAD exome chip cohort can be accessed by applying directly to Cardiff University. Stage 1 ADGC data is deposited in NIAGADS and NIA/NIH sanctioned qualified access data repository. Stage 1 CHARGE data is accessible by applying to dbGaP for all US cohorts, and to ERASMUS University for Rotterdam data. AGES primary data are not available due to Icelandic laws. Stage 2 and stage 3 primary data is available upon request.
A detailed description of the Mayo Clinic RNAseq data is available to all qualified investigators through the Accelerating Medicines Partnership in Alzheimer’s Disease (AMP-AD) knowledge portal that is hosted in the Synapse software platform from Sage Bionetworks (Synapse IDs: syn3157182 and syn3435792 (mouse data), and syn3163039 (human data)).
Online Methods
Genotyping and Quality Control
Stage 1
GERAD/PERADES
Genotyping was performed at Life and Brain, Bonn, Germany, with the Illumina HumanExome BeadChip v1.0 (N=247,870 variants) or v1.1 (N=242,901 variants). Illumina’s GenTrain version 2.0 clustering algorithm in GenomeStudio or zCall1 was used for genotype calling. Quality control (QC) filters were implemented for sample call rate excluding samples with >1% missingness, excess autosomal heterozygosity excluding outliers based on <1% and >1% minor allele frequency (MAF) separately, gender discordance, relatedness excluding one of each pair related with IBD ≥ 0.125 (the level expected for first cousins), and population outliers (i.e. non European ancestry). Variants were filtered based on call rate excluding variants with >1% missingness, genotype cluster separation excluding variants with a separation score < 0.4 and Hardy-Weinberg equilibrium (HWE) excluding variants with PHWE < 1×10⁻⁴. Ten principal components (PCs) were extracted using EIGENSTRAT, including the first three PCs as covariates had the maximum impact on the genomic control inflation factor, λ2. After QC 6,000 LOAD cases and 2,974 elderly controls (version 1.0; 4,093 LOAD cases and 1,599 controls, version 1.1; 1,907 LOAD cases and 1,375 controls) remained. The version 1.0 array had 244,412 variants available for analysis and 239,814 remained for the version 1.1 array.
CHARGE
All four CHARGE cohorts were genotyped for the Illumina HumanExome BeadChip v1.0. To increase the quality of the rare variant genotype calls, the genotypes for all four studies were jointly called with 62,266 samples from 11 studies at the University of Texas HSC at Houston3. Quality control (QC) procedures for the genotype data were performed both centrally at UT Houston and at each study. The central QC procedures have been described previously3. Minimum QC included: 1) Concordance checking with GWAS data and removal of problematic samples, 2) Removal of individuals with low genotype completion rate (<90%), 3) Removal of variants with low genotype call rate (<95%), 4) Removal of individuals with sex-mismatches, 5) Removal of one individual from duplicate pairs, 6) Removal of first-degree relatives based on genetically calculated relatedness (IBS > 0.45), with cases retained over controls, 7) Removal of variants not called in over 5% of the individuals and those that deviated significantly form the expected Hardy-Weinberg Equilibrium proportions (P<1×10⁻⁶).
ADGC
Genotyping was performed in subsets at four centers: NorthShore, Miami, WashU, and CHOP (“CHOP” and “ADC7” datasets) on the Illumina HumanExome BeadChip v1.0. One variant rs75932628 (p.R47H) in TREM2 clustered poorly across all ADGC cohorts, and was therefore re-genotyped using a Taqman assay. Data on all samples underwent standard quality control procedures applied to genome-wide association studies (GWAS), including excluding variants with call rates <95%, and then filtering samples with call rate <95%. Variants with MAF>0.01 were evaluated for departure from HWE and any variants for PHWE<10-6 were excluded. Population substructure within each of the five subsets (NorthShore, Miami, WashU, CHOP, and ADC7) was examined using PC analysis in EIGENSTRAT4, and population outliers (>6 SD) were excluded from further analyses; the first three PCs were adjusted for as covariates in association testing. Prior to analysis we harmonized the alternate and reference alleles over all datasets. See Supplementary Table 3 for an overview of cohort genotype calling and quality control procedures. All sample genotyping and quality control was performed blind to participant’s disease status.
Stage 2
Twenty-two variants successfully designed for replication genotyping on the Agena Bioscience MassARRAY® platform. Genotyping was performed at Life and Brain, Bonn, Germany, and the Centre National de Génotypage (CNG), Paris, France. Twenty-one variants were successfully genotyped, with one variant (rs147163004 in ASTN2) failing visual cluster plot inspection. An additional nine variants were successfully genotyped using the Agena Bioscience MassARRAY® platform or Thermo FisherTaqMan® assay at the CNG, Paris, France in a subset of the replication samples N=16,850 (7,755 cases, 9,095 controls).
GERAD/PERADES and ACE QC
Filters were implemented for sample call rate, excluding samples with >10% missingness, and excess autosomal heterozygosity via visual inspection. Variants were filtered based on call rate excluding variants with >10% missingness and HWE excluding variants with PHWE<1×10⁻⁵ in either cases or controls.
IGAP and EADI QC
Variants were genotyped in 3 different panels and QC was performed in each panel separately. Samples with more than 3 missing genotypes were excluded, as were males heterozygous for X-Chromosome variants present within the genotyped panels. Variants were excluded based on missingness >5%, HWE (in cases and controls separately) <1×10⁻⁵, and differential missingness between cases and controls <1×10⁻⁵, for each Country cohort. All variants passed quality control. PCs were determined using previously described methods19.
Stage 3
Replication was performed using genotypes from 23 ADGC datasets as described above. Genotyping arrays used have been described in detail before for most datasets, except for the CHAP, NBB, TARCC, and WHICAP datasets. CHAP and WHICAP datasets were genotyped on the Illumina OmniExpress-24 array, while NBB was genotyped on the Illumina 1M platform. TARCC first wave subjects were genotyped using the Affymetrix 6.0 microarray chip, while subjects in the second wave (172 cases and 74 controls) were genotyped using the Illumina HumanOmniExpress-24 beadchip. Second wave TARCC subjects (TARCC2) were genotyped together with 84 cases and 115 controls from second wave samples ascertained at the University of Miami and Vanderbilt University. All samples used in stage 3 were imputed to the HRC haplotype reference panel5,6, which includes 64,976 haplotypes with 39,235,157 SNPs that allows imputation down to an unprecedented MAF=0.00008.
Prior to imputation, all genotype data underwent QC procedures that have been described extensively elsewhere7,8. Imputation was performed on the Michigan Imputation Server (https://imputationserver.sph.umich.edu/) running MiniMac39,10. Genotypes from genome-wide, high-density SNP genotyping arrays for 16,175 AD cases and 17,176 cognitive-normal individuals were imputed. Across all samples 39,235,157 SNPs were imputed, with the actual number of SNPs imputed for each individual varying based on the regional density of array genotypes available. As a subset of these samples had also been genotyped as part of stage 1, we examined the imputation quality for critical variants by comparing imputed genotypes to those directly genotyped by the exome array; overall concordance was >99%, while concordance among alternate allele genotypes (heterozygotes and alternate allele homozygotes) was >88.5% on average (N=13,000 samples). Concordance between Stage 3 imputed genotypes and exome chip genotypes for replicated SNPs is reported in Supplementary Table 6.
Analysis
Stage 1
We tested association with LOAD using logistic regression modelling for common and low frequency variants (MAF>1%) and implementing maximum likelihood estimation using the score test and ‘seqMeta’ package for rare variation (MAF≤1%). Analyses were conducted globally in the GERAD/PERADES consortium, and for each contributing centre in the CHARGE and ADGC consortia under two models (1) an ‘unadjusted’ model, which included minimal adjustment for possible population stratification, using Country of origin and the first three principal components from PCA, and (2) an ‘adjusted’ model, which included covariates for age, and sex, as well as Country of origin and the first three principal components. Age was defined as the age at onset of clinical symptoms for cases, and the age at last interview for cognitively normal controls.
Meta-analysis for common and low frequency variants were undertaken in METAL using a fixed-effects inverse variance-weighted meta-analysis. Rare variants were meta-analysed in the SeqMeta R package. In the SeqMeta pipeline, cohort-level analyses generated score statistics through the function ‘prepScores()’ which were captured in *. Rdata objects. These *. Rdata objects contain the necessary information to meta-analyse SKAT analyses: the individual SNP scores, MAF, and a covariance matrix for each unit of aggregation. Using the ‘singlesnpMeta()’ and ‘skatOmeta()’ functions of SeqMeta, the *. Rdata objects for individual studies were meta-analysed. The seqMeta coefficients and standard errors can be interpreted as a ‘one-step‘ approximation to the maximum likelihood estimates. Monomorphic variants in individual studies were not excluded as they contribute to the minor allele frequency information. Three independent analysts confirmed the meta-analysis results.
In the GERAD/PERADES consortium 1,740 participants (888 LOAD cases and 852 controls) did not have age information available and were excluded from the adjusted analyses. Therefore, 16,160 cases and 17,967 controls were included in the unadjusted analyses and 15,272 cases and 17,115 controls were included in the adjusted analyses. The primary analysis utilized the unadjusted model given the larger sample size this provided. See Supplementary Figure 2 for QQ plots of unadjusted and adjusted analyses.
Stage 2
We tested association with LOAD using the score test and ‘seqMeta’ package. Analyses were conducted under the two models described above, in the analysis groups indicated in Supplementary Table 2. Analyses were undertaken globally in the GERAD/PERADES cohort and by Country in the IGAP cohorts, with the EADI1 cohort only including French participants and the ACE cohort including only Spanish participants. Following the format of the IGAP mega meta-analysis7, four PCs were included for the EADI1 dataset, and one in the Italian and Swedish IGAP clusters. Meta-analysis was undertaken in the SeqMeta R package.
Stage 3
Association analyses performed followed Stage 1 and Stage 2 analytical procedures described below, and only variants in ABI3, PLCG2 and TREM2 were examined. For gene-based testing, 10 variants in ABI3, 35 in PLCG2, and 13 in TREM2 were examined.
Pathway/Gene-set Enrichment Analysis
The eight biological pathway clusters previously identified as enriched for association in the IGAP dataset11 were tested for enrichment in this rare variation study (Supplementary Table 15) in order to test whether the biological enrichments observed in common variants also apply to rare variants. Genes were defined without surrounding genomic sequence, as this yielded the most significant excess of enriched pathways in the common variation dataset11. Gene-wide SKAT-O P-values for the variants of interest were combined using the Fisher’s combined probability test. Given the low degree of LD12 between rare variants our primary analyses did not control for LD between pathway genes. However, as a secondary analysis, the APOE region was removed, and for each pair of pathway genes within 1Mb of each other, the gene with the more significant SKAT-O P-value was removed. This highly conservative procedure removes any potential bias in the enrichment test both from LD between the genes, and also from dropping less significant genes from the analysis.
We also performed pathway analyses on the rare variant data presented here using all 9,816 pathways used previously. The top pathways are related to lipoprotein particles, cholesterol efflux, B-cell differentiation and immune response, and closely parallel the common variant results (Supplementary Table 16).
Protein interaction Analysis
Previous analysis of normal brain co-expression networks identified 4 gene modules that were enriched for common variants associated with AD risk in the IGAP GWAS. Each of these 4 modules was also found to be enriched for immune-related genes. The 151 genes present in 2 or more of these 4 modules were particularly strongly enriched for IGAP GWAS association41. This set of 151 co-expressed genes thus contains genes of relevance to AD aetiology. To identify these genes, and clarify biological relationships between them for future study, protein interaction analysis was performed. First, a list of high-confidence (confidence score >0.7) human protein-protein interactions was downloaded from the latest version (v10) of the STRING database (http://string-db.org). Then, protein interaction networks were generated as follows:
Choose a gene to start the network (the “seed” gene)
For each remaining gene in the set of 151 genes, add it to the network if its corresponding protein shows a high-confidence protein interaction with a protein corresponding to any gene already in the network.
Repeat step 2 until no more genes can be added
Note the number of genes in the network
Repeat, choosing each of the 151 genes in turn as the seed gene.
The largest protein interaction network resulting from this procedure resulted in a network of 56 genes connected by high-confidence protein interactions. To test whether this network was larger than expected by chance, given the total number of protein-protein interactions for each gene, random sets of 151 genes were generated, with each gene chosen to have the same total number of protein-protein interactions as the corresponding gene in the actual data. Protein networks were generated for each gene as described above, and the size of the largest such network compared to the observed 56-gene network. 1000 random gene sets were generated, and none of them yielded a protein interaction network as large as 56 genes. Note that the procedure for generating the protein interaction network relies only on protein interaction data, and is agnostic to the strength of GWAS or rare-variant association for each gene. Thus the strength of genetic association in the set of 56 network genes can be tested relative to that in the original set of 151 genes without bias.
Gene-set enrichment analysis of the protein network
The set of 56 network genes was tested for association enrichment in the IGAP GWAS using ALIGATOR13, as was done in the original pathway analysis, using a range of p-value thresholds for defining significant SNPs (and thus the genes containing those SNPs). The same analysis was also performed on the 95 genes in the module overlap but not the protein interaction network (Supplementary Table 17). It can be seen that the 56 network genes account for most of the enrichment signal observed in the set of 151 module overlap genes.
The set of 56 network genes, the set of 151 module overlap genes, and the set of 95 genes in the module overlap but not the network were tested for enrichment of association signal in variants with MAF<1% using the gene set enrichment method described above in section 11. Both the set of 151 genes (P=1.17×10⁻⁶) and the subset of 56 genes (P =1.08×10⁻⁷) show highly significant enrichment for association in the rare variants with MAF<1%. It can be seen that the 56 network genes account for most of the enrichment signal observed in the set of 151 module overlap genes (Supplementary Table 17). Again, the subset of 56 genes accounts for most of the enrichment signal observed in the set of 151 genes, as the remaining 95 genes have only nominally-significant enrichment (P=0.043). Both the set of 151 genes (P=5.15×10⁻⁵) and the subset of 56 genes (P=2.98×10⁻⁷) show significant enrichment under a conservative analysis excluding the APOE region and correcting for possible LD between the genes (Supplementary Table 17). Thus, the rare variants show convincing replication of the biological signal observed in the common variant GWAS, and furthermore, the protein network analysis has refined this signal to a set of 56 interacting genes. Given that TREM2 has a highly significant gene-wide p-value (P=1.01×10⁻¹³) among variants with MAF<1%, enrichment analyses were run omitting it. Both the set of 151 genes (P=2.78×10⁻³) and the subset of 56 genes (P=0.010) (Supplementary Table 18) still showed significant enrichment of signal, suggesting that the contribution of rare variants to disease susceptibility in these networks is not restricted to TREM2. Biological follow-up of genetic results is labour-intensive and expensive. It is therefore important to concentrate such work on the genes that are most important to AD susceptibility. Thus, the rationale for reducing the gene set is that it defines a network of genes that are not only related through co-expression and protein interaction, but also show enrichment for genetic association signal. These genes are therefore strong candidates for future biological study.
Gene Expression
We examined mRNA expression of the novel genes PLCG2 and ABI3 in neuropathologically characterized brain post-mortem tissue (508 persons): they are expressed at low levels in the dorsolateral prefrontal cortex of subjects from two studies of aging with prospective autopsy (ranked 12,965th out of 13,484 expressed genes)14. However, ABI3 and PLCG2 were more highly expressed in purified microglia/macrophage from the cortex of 11 subjects from these cohorts (1740th and 2600th respectively out of the 11,500 expressed genes)(unpublished data). These findings are consistent with the high levels of expression of both PLCG2 and ABI3 in peripheral monocytes, spleen, and whole blood reported by the ROADmap project and in microglia as reported by Zhang et al15. From the same brain tissue, we examined methylation (n=714)16 and H3K9ac acetylation (n=676) data and found differential methylation at four CpG sites and lower acetylation at two H3K9ac sites adjacent to PLCG2 and ABI3 in relation to increased global neuritic plaque and tangle burden (FDR < 0.05). Similarly, high TREM2 expression has been shown to correlate with increasing neuritic plaque burden17.
AMP-AD Gene Expression Data
RNA sequencing was used to measure gene expression levels in the temporal cortex of 80 subjects with pathologically confirmed AD and 76 controls without any neurodegenerative pathologies obtained from the Mayo Clinic Brain Bank and the Banner Sun Health Institute. The human RNA sequencing data is deposited in the Accelerating Medicines Partnership-AD (AMP-AD) knowledge portal housed in Synapse (https://www.synapse.org/#!Synapse:syn2580853/wiki/66722). After QC, our postmortem human cohort has 80 subjects with pathologically confirmed AD and 76 controls without any neurodegenerative pathologies. Assuming two samples of 100 per group, two-sample t-test, same standard deviation, we will have 80% power to detect effect sizes of 0.40, 0.49 and 0.59 at p<0.05, 0.01 and 0.001, respectively, where effect size is the difference in means between two groups divided by the within-group standard deviation. The human RNA sequencing data overview, QC and analytic methods are available at the following Synapse pages, respectively: syn3163039, syn6126114, syn6090802. Multivariable linear regression was used to test for association of gene expression levels with AD diagnosis (Dx) using two different models: In the Simple model, we adjust for age at death, sex, RNA integrity number (RIN), tissue source, and RNAseq flowcell. In the Comprehensive model, we adjust for all these covariates, and brain cell type markers for five cell-specific genes (CD68 (microglia), CD34 (endothelial), OLIG2 (oligodendroglia), GFAP (astrocyte), ENO2 (neuron)) to account for cell number changes that occur with AD neuropathology. TREM2, PLCG2 and ABI3 are significantly higher in AD temporal cortex prior to correcting for cell types (Simple model), but this significance is abolished after adjusting for cell-specific gene counts (Comprehensive model). This suggests that these elevations are likely a consequence of changes in cell types that occur with AD, most likely microgliosis given that TREM2, PLCG2 and ABI3 are microglia-enriched genes15 (Supplementary Table 19, Supplementary Figure 12).
Supplementary Material
Acknowledgments
GERAD/PERADES: We thank all individuals who participated in this study. Cardiff University was supported by the Alzheimer’s Society (AS; grant RF014/164) and the Medical Research Council (MRC; grants G0801418/1, MR/K013041/1, MR/L023784/1) (Rebecca Sims is an AS Research Fellow). Cardiff University was also supported by the European Joint Programme for Neurodegenerative Disease (JPND, grant MR/L501517/1), Alzheimer’s Research UK (ARUK, grant ARUK-PG2014-1), Welsh Assembly Government (grant SGR544:CADR), a donation from the Moondance Charitable Foundation. Cambridge University acknowledges support from the MRC. Patient recruitment for the MRC Prion Unit/UCL Department of Neurodegenerative Disease collection was supported by the UCLH/UCL Biomedical Centre and NIHR Queen Square Dementia Biomedical Research Unit. The University of Southampton acknowledges support from the AS. King’s College London was supported by the NIHR Biomedical Research Centre for Mental Health and Biomedical Research Unit for Dementia at the South London and Maudsley NHS Foundation Trust and Kings College London and the MRC. Alzheimer’s Research UK (ARUK) and the Big Lottery Fund provided support to Nottingham University. Ulster Garden Villages, AS, ARUK, American Federation for Aging Research and NI R&D Office provided support for Queen’s University, Belfast. The Centro de Biologia de Molecular Severo Ochoa (CSIS-UAM), CIBERNED, Instituto de Investigacion Sanitaria la Paz, University Hospital La Paz and the Universidad Autonoma de Madrid were supported by grants from the Ministerio de Educacion y Ciencia and the Ministerio de Sanidad y Consumo (Instituto de Salud Carlos III), and an institutional grant of the Fundacion Ramon Areces to the CMBSO. Thanks to I. Sastre and Dr A Martinez-Garcia for DNA preparation, and Drs P Gil and P Coria for their recruitment efforts. Department of Neurology, University Hospital Mutua de Terrassa, Terrassa, Barcelona, Spain was supported by CIBERNED, Centro de Investigacion Biomedica en Red de Enfermedades Neurodegenerativas, Instituto de Salud Carlos III, Madrid Spain and acknowledges Maria A Pastor (Department of Neurology, University of Navarra Medical School and Neuroimaging Laboratory, Center for Applied Medical Research, Pamplona, Spain), Manuel Seijo-Martinez (Department of Neurology, Hospital do Salnes, Pontevedra, Spain), Ramon Rene, Jordi Gascon and Jaume Campdelacreu (Department of Neurology, Hospital de Bellvitage, Barcelona, Spain) for providing DNA samples. Hospital de la Sant Pau, Universitat Autonoma de Spain acknowledges support from the Spanish Ministry of Economy and Competitiveness (grant number PI12/01311), and from Generalitat de Catalunya (2014SGR-235). The Santa Lucia Foundation and the Fondazione Ca’ Granda IRCCS Ospedale Policlinico, Italy, acknowledge the Italian Ministry of Health (grant RC 10.11.12.13/A). The Bonn samples are part of the German Dementia Competance Network (DCN) and the German Research Network on Degenerative Dementia (KNDD), which are funded by the German Federal Ministry of Education and Research (grants KND: 01G10102, 01GI0420, 01GI0422, 01GI0423, 01GI0429, 01GI0431, 01GI0433, 04GI0434; grants KNDD: 01GI1007A, 01GI0710, 01GI0711, 01GI0712, 01GI0713, 01GI0714, 01GI0715, 01GI0716, 01ET1006B). Markus M Nothen is a member of the German Research Foundation (DFG) cluster of excellence ImmunoSensation. Funding for Saarland University was provided by the German Federal Ministry of Education and Research (BMBF), grant number 01GS08125 to Matthias Riemenschneider. The University of Washington was supported by grants from the National Institutes of Health (R01-NS085419 and R01-AG044546), the Alzheimer’s Association (NIRG-11-200110) and the American Federation for Aging Research (Carlos Cruchaga was recipient of a New Investigator Award in Alzheimer’s disease). Brigham Young University was supported by the Alzheimer’s Association (MNIRG-11-205368), the BYU Gerontology Program and the National Institutes of Health (R01-AG11380, R01-AG021136, P30- S069329-01, R01-AG042611). We also acknowledge funding from the Institute of Neurology, UCL, London who were supported in part by the ARUK via an anonymous donor, and by a fellowship to Dr Guerreiro. Seripa, Urbano and Masullo’s participation in the study was completely supported by Ministerodella Salute”, I.R.C.C.S. Research Program, Ricerca Corrente 2015-2017, Linea n. 2 “Malattiecomplesse e terapie innovative” and by the “5 × 1000” voluntary contribution. AddNeuromed is supported by InnoMed, an Integrated Project funded by the European Union Sixth Framework programme priority FP6-2004-LIFESCIHEALTH-5, Life Sciences, Genomics and Biotechnology for Health. We are grateful to the Wellcome Trust for awarding a Principal Research Fellowship to Rubensztein (095317/Z/11/Z). Matthias Riemenschneider was funded by the BMBF NGFN Grant 01GS08125. BN supported by FondazioneCassa di Risparmio di Pistoia e Pescia (grants 2014.0365, 2011.0264 and 2013.0347). Harald Hampel is supported by the AXA Research Fund, the Fondation Universite Pierre et Marie Curie and the “Fondation pour la Recherchesur Alzheimer”, Paris, France. The research leading to these results has received funding from the program “Investissementsd’ avenir” ANR-10-IAIHU-06 (Agence Nationale de la Recherche-10-IA Agence Institut Hospitalo-Universitaire-6.
CHARGE: Infrastructure for the CHARGE Consortium is supported in part by the National Heart, Lung, and Blood Institute grant HL105756 and for the neurology working group by AG033193 and AG049505.
The AGES study has been funded by NIA contract N01-AG-12100 and HHSN271201200022C with contributions from NEI, NIDCD and NHLBI, the NIA Intramural Research Program, Hjartavernd (the Icelandic Heart Association), and the Althingi (the Icelandic Parliament).
Cardiovascular Health Study(CHS): This research was supported by contracts HHSN268201200036C, HHSN268200800007C, N01HC55222, N01HC85079, N01HC85080, N01HC85081, N01HC85082, N01HC85083, N01HC85086, and grant U01HL080295 from the National Heart, Lung, and Blood Institute (NHLBI), with additional contribution from the National Institute of Neurological Disorders and Stroke (NINDS). Additional support was provided by R01AG033193, R01AG023629, R01AG15928, and R01AG20098 and U01AG049505 from the National Institute on Aging (NIA). The provision of genotyping data was supported in part by the National Center for Advancing Translational Sciences, CTSI grant UL1TR000124, and the National Institute of Diabetes and Digestive and Kidney Disease Diabetes Research Center (DRC) grant DK063491 to the Southern California Diabetes Endocrinology Research Center. A full list of principal CHS investigators and institutions can be found at CHS-NHLBI.org. The content is solely the responsibility of the authors and does not necessarily represent the official views of the National Institutes of Health.
Framingham Heart Study: This work was supported by the National Heart, Lung and Blood Institute’s Framingham Heart Study (Contract No.N01-HC-25195 and No. HHSN268201500001I). This study was also supported by grants from the National Institute on Aging: AG033193, U01-AG049505 and AG008122 (Seshadri). Drs. Seshadri and DeStefano were also supported by additional grants from the National Institute on Aging (R01AG049607), the National Institute of Neurological Disorders and Stroke (R01-NS017950).
Fundacio Ace: We sincerely acknowledge the collaboration of Susana Ruiz, Maitee Rosende-Roca, Ana Mauleon, Liliana Vargas, Octavio Rodriguez-Gomez, Montserrat Alegret, Ana Espinosa, Gemma Ortega, Marina Tarragona, Carla Abdelnour, Domingo Sanchez. We thank all patients for their participation in this project. We are obliged to Trinitat Port-Carbo and her family for their support of the Fundacio ACE research programs. Fundacio ACE collaborates with the Centro de Investigacion Biomedica en Red sobre Enfermedades Neurodegenerativas (CIBERNED, Spain), and is one of the participating centers of the Dementia Genetics Spanish Consortium 430 (DEGESCO). CIBERNED is an Instituto de Salud Carlos III ISCIII Project. Agustin Ruiz is supported by grant PI13/02434 (Accion Estrategica en Salud. Instituto de Salud Carlos III (ISCIII). Ministerio de Economia y Competitividad, Spain), and Obra Social “La Caixa” (Barcelona, Spain).
ADGC: The National Institutes of Health, National Institute on Aging (NIH-NIA) supported this work through the following grants: ADGC, U01 AG032984, RC2 AG036528; Samples from the National Cell Repository for Alzheimer’s Disease (NCRAD), which receives government support under a cooperative agreement grant (U24 AG21886) awarded by the National Institute on Aging (NIA), were used in this study. We thank contributors who collected samples used in this study, as well as patients and their families, whose help and participation made this work possible; Data for this study were prepared, archived, and distributed by the National Institute on Aging Alzheimer’s Disease Data Storage Site (NIAGADS) at the University of Pennsylvania (U24-AG041689-01); NACC, U01 AG016976; NIA LOAD (Columbia University), U24 AG026395, R01AG041797; Banner Sun Health Research Institute P30 AG019610; Boston University, P30 AG013846, U01 AG10483, R01 CA129769, R01 MH080295, R01 AG017173, R01 AG025259, R01 AG048927, R01AG33193; Columbia University, P50 AG008702, R37 AG015473; Duke University, P30 AG028377, AG05128; Emory University, AG025688; Group Health Research Institute, UO1 AG006781, UO1 HG004610, UO1 HG006375; Indiana University, P30 AG10133; Johns Hopkins University, P50 AG005146, R01 AG020688; Massachusetts General Hospital, P50 AG005134; Mayo Clinic, P50 AG016574; Mount Sinai School of Medicine, P50 AG005138, P01 AG002219; New York University, P30 AG08051, UL1 RR029893, 5R01AG012101, 5R01AG022374, 5R01AG013616, 1RC2AG036502, 1R01AG035137; Northwestern University, P30 AG013854; Oregon Health & Science University, P30 AG008017, R01 AG026916; Rush University, P30 AG010161, R01 AG019085, R01 AG15819, R01 AG17917, R01 AG30146; TGen, R01 NS059873; University of Alabama at Birmingham, P50 AG016582; University of Arizona, R01 AG031581; University of California, Davis, P30 AG010129; University of California, Irvine, P50 AG016573; University of California, Los Angeles, P50 AG016570; University of California, San Diego, P50 AG005131; University of California, San Francisco, P50 AG023501, P01 AG019724; University of Kentucky, P30 AG028383, AG05144; University of Michigan, P50 AG008671; University of Pennsylvania, P30 AG010124; University of Pittsburgh, P50 AG005133, AG030653, AG041718, AG07562, AG02365; University of Southern California, P50 AG005142; University of Texas Southwestern, P30 AG012300; University of Miami, R01 AG027944, AG010491, AG027944, AG021547, AG019757; University of Washington, P50 AG005136; University of Wisconsin, P50 AG033514; Vanderbilt University, R01 AG019085; and Washington University, P50 AG005681, P01 AG03991. The Kathleen Price Bryan Brain Bank at Duke University Medical Center is funded by NINDS grant # NS39764, NIMH MH60451 and by Glaxo Smith Kline. Support was also from the Alzheimer’s Association (LAF, IIRG-08-89720; MP-V, IIRG-05-14147), the US Department of Veterans Affairs Administration, Office of Research and Development, Biomedical Laboratory Research Program, and BrightFocus Foundation (MP-V, A2111048). P.S.G.-H. is supported by Wellcome Trust, Howard Hughes Medical Institute, and the Canadian Institute of Health Research. Genotyping of the TGEN2 cohort was supported by Kronos Science. The TGen series was also funded by NIA grant AG041232 to AJM and MJH, The Banner Alzheimer’s Foundation, The Johnnie B. Byrd Sr. Alzheimer’s Institute, the Medical Research Council, and the state of Arizona and also includes samples from the following sites: Newcastle Brain Tissue Resource (funding via the Medical Research Council, local NHS trusts and Newcastle University), MRC London Brain Bank for Neurodegenerative Diseases (funding via the Medical Research Council), South West Dementia Brain Bank (funding via numerous sources including the Higher Education Funding Council for England (HEFCE), Alzheimer’s Research UK (ARUK), BRACE as well as North Bristol NHS Trust Research and Innovation Department and DeNDRoN), The Netherlands Brain Bank (funding via numerous sources including Stichting MS Research, Brain Net Europe, Hersenstichting Nederland BreinbrekendWerk, International Parkinson Fonds, InternationaleStiching Alzheimer Onderzoek), Institut de Neuropatologia, ServeiAnatomiaPatologica, Universitat de Barcelona. ADNI data collection and sharing was funded by the National Institutes of Health Grant U01 AG024904 and Department of Defense award number W81XWH-12-2-0012. ADNI is funded by the National Institute on Aging, the National Institute of Biomedical Imaging and Bioengineering, and through generous contributions from the following: AbbVie, Alzheimer’s Association; Alzheimer’s Drug Discovery Foundation; Araclon Biotech; BioClinica, Inc.; Biogen; Bristol-Myers Squibb Company; CereSpir, Inc.; Eisai Inc.; Elan Pharmaceuticals, Inc.; Eli Lilly and Company; EuroImmun; F. Hoffmann-La Roche Ltd and its affiliated company Genentech, Inc.; Fujirebio; GE Healthcare; IXICO Ltd.; Janssen Alzheimer Immunotherapy Research & Development, LLC.; Johnson & Johnson Pharmaceutical Research & Development LLC.; Lumosity; Lundbeck; Merck & Co., Inc.; Meso Scale Diagnostics, LLC.; NeuroRx Research; Neurotrack Technologies; Novartis Pharmaceuticals Corporation; Pfizer Inc.; Piramal Imaging; Servier; Takeda Pharmaceutical Company; and Transition Therapeutics. The Canadian Institutes of Health Research is providing funds to support ADNI clinical sites in Canada. Private sector contributions are facilitated by the Foundation for the National Institutes of Health (www.fnih.org). The grantee organization is the Northern California Institute for Research and Education, and the study is coordinated by the Alzheimer’s Disease Cooperative Study at the University of California, San Diego. ADNI data are disseminated by the Laboratory for Neuro Imaging at the University of Southern California. We thank Drs. D. Stephen Snyder and Marilyn Miller from NIA who are ex-officio ADGC members.
EADI: This work was supported by INSERM, the National Foundation for Alzheimer’s disease and related disorders, the Institut Pasteur de Lille and the Centre National de Genotypage. This work has been developed and supported by the LABEX (laboratory of excellence program investment for the future) DISTALZ grant (Development of Innovative Strategies for a Transdisciplinary approach to Alzheimer’s disease) including funding from MEL (Metropoleeuropeenne de Lille), ERDF (European Regional Development Fund) and Conseil Regional Nord Pas de Calais. The Three-City Study was performed as part of collaboration between the Institut National de la Sante et de la Recherche Medicale (Inserm), the Victor Segalen Bordeaux II University and Sanofi-Synthelabo. The Fondation pour la Recherche Medicale funded the preparation and initiation of the study. The 3C Study was also funded by the Caisse Nationale Maladie des Travailleurs Salaries, Direction Generale de la Sante, MGEN, Institut de la Longevite, Agence Francaise de Securite Sanitaire des Produits de Sante, the Aquitaine and Bourgogne Regional Councils, Agence Nationale de la Recherche, ANR supported the COGINUT and COVADIS projects. Fondation de France and the joint French Ministry of Research/INSERM “Cohortes et collections de donnees biologiques” programme. Lille Genopole received an unconditional grant from Eisai. The Three-city biological bank was developed and maintained by the laboratory for genomic analysis LAG-BRC - Institut Pasteur de Lille. Belgium sample collection: Research at the Antwerp site is funded in part by the Interuniversity Attraction Poles program of the Belgian Science Policy Office, the Foundation for Alzheimer Research (SAO-FRA), a Methusalem Excellence Grant of the Flemish Government, the Research Foundation Flanders (FWO), the Special Research Fund of the University of Antwerp, Belgium. KB is a postdoctoral fellow of the FWO. The Antwerp site authors thank the personnel of the VIB Genetic Service Facility, the Biobank of the Institute Born-Bunge and the Departments of Neurology and Memory Clinics at the Hospital Network Antwerp and the University Hospitals Leuven. Finish sample collection: Financial support for this project was provided by the Health Research Council of the Academy of Finland, EVO grant 5772708 of Kuopio University Hospital, and the Nordic Center of Excellence in Neurodegeneration. Swedish sample collection: Financially supported in part by the Swedish Brain Power network, the Marianne and Marcus Wallenberg Foundation, the Swedish Research Council (521-2010-3134), the King Gustaf V and Queen Victoria’s Foundation of Freemasons, the Regional Agreement on Medical Training and Clinical Research (ALF) between Stockholm County Council and the Karolinska Institutet, the Swedish Brain Foundation and the Swedish Alzheimer Foundation”.
AMP AD University of Florida/Mayo Clinic/Institutes of Systems Biology: For the human brain donations, we thank all patients and their families, without whom this work would not have been possible. This work was supported by NIH/NIA AG046139-01 (TEG, NET, NP, SGY). We thank Thomas G Beach (Banner Sun Health Institute, AZ) for sharing human tissue.
The Mayo Clinic Brain Bank: Data collection was supported through funding by NIA grants P50 AG016574, R01 AG032990, U01 AG046139, R01 AG018023, U01 AG006576, U01 AG006786, R01 AG025711, R01 AG017216, R01 AG003949, NINDS grant R01 NS080820, CurePSP Foundation, and support from Mayo Foundation.
Sun Health Research Institute Brain and Body Donation Program of Sun City, Arizona: The Brain and Body Donation Program is supported by the National Institute of Neurological Disorders and Stroke (U24 NS072026 National Brain and Tissue Resource for Parkinson’s Disease and Related Disorders), the National Institute on Aging (P30 AG19610 Arizona Alzheimer’s Disease Core Center), the Arizona Department of Health Services (contract 211002, Arizona Alzheimer’s Research Center), the Arizona Biomedical Research Commission (contracts 4001, 0011, 05-901 and 1001 to the Arizona Parkinson’s Disease Consortium) and the Michael J. Fox Foundation for Parkinson’s Research.
Main Authors by Consortium and Author Contributions
Superscript number refers to institutional affiliation. This can be found below the main author list at the beginning of this article.
GERAD/PERADES
Rebecca Sims1, Nandini Badarinarayan1, Rachel Raybould1, Stefanie Heilmann-Heimbach12,13, Maria Vronskaya1, Per Hoffmann12,13,21, Markus M. Nöthen12,13, Wolfgang Maier30,31, Stefan Herms12,13,21, Andreas J. Forstner12,13, Denise Harold35, Rhodri Thomas1, Taniesha Morgan1, Nicola Denning1, Elisa Majounie1, Michelle K Lupton43,44, Christopher Medway47, Kristelle Brown47, Bernadette McGuinness50, Petra Proitsi43, Pau Pastor54, Ana Frank-García56,57,58, Ina Giegling63, Harald Hampel65,66,67, Patrizia Mecocci54, Virginia Boccardi54, Martin Scherer72, Markus Leber74, Steffi Riedel-Heller76, Anne Braae79, Carlo Masullo83, Gianfranco Spalletta86, Paola Bossù86, Eleonora Sacchinelli86, Pascual Sánchez-Juan37, Frank Jessen30,31,74, John Morris97,98, Chris Corcoran100, JoAnn Tschanz100, Maria Norton100, Ron Munger100, María J Bullido57,58,106, Eliecer Coto107, Victoria Alvarez107, Maura Gallo116, Amalia Cecilia Bruni116, Martin Dichgans119,120, Daniela Galimberti122, Elio Scarpini122, Michelangelo Mancuso127, Ubaldo Bonuccelli127, Antonio Daniele129, GERAD/PERADES, Oliver Peters131, Benedetta Nacmias132,133, Matthias Riemenschneider134, Reinhard Heun31, Carol Brayne135, David C Rubinsztein123, Jose Bras136,137, Rita Guerreiro136,137, John Hardy136, Ammar Al-Chalabi138, Christopher E Shaw138, John Collinge139, David Mann140, Magda Tsolaki141, Jordi Clarimón58,142, Rebecca Sussams143, Simon Lovestone144, Michael C O’Donovan1, Michael J Owen1, Simon Mead139, Clive Holmes143, John Powell43, Kevin Morgan47, Peter Passmore50, Dan Rujescu63, Sara Ortega-Cubero58,154, John “Keoni” Kauwe157, Lesley Jones1, Valentina Escott-Price1, Peter A Holmans1, Alfredo Ramirez12,31,74, Julie Williams1.
Study design or conception
Rebecca Sims, Valentina Escott-Price, Michael C O’Donovan, Michael J Owen, Peter A. Holmans, Julie Williams
Sample contribution
Markus M. Nöthen, Wolfgang Maier, Stefan Herms, Andreas J. Forstner, Julie Williams, Alfredo Ramirez, Michelle K Lupton, Christopher Medway, Kristelle Brown, Bernadette McGuinness, Petra Proitsi, Pau Pastor, Ana Frank-García, Ina Giegling, Harald Hampel, Patrizia Mecocci, Virginia Boccardi, Martin Scherer, Markus Leber, Steffi Riedel-Heller, Anne Braae, Carlo Masullo, Gianfranco Spalletta, Paola Bossù, Eleonora Sacchinelli, Pascual Sánchez-Juan, Frank Jessen, John Morris, Chris Corcoran, JoAnn Tschanz, Maria Norton, Ron Munger, María J Bullido, Eliecer Coto, Victoria Alvarez, Maura Gallo, Amalia Cecilia Bruni, Martin Dichgans, Daniela Galimberti, Elio Scarpini, Michelangelo Mancuso, Ubaldo Bonuccelli, Antonio Daniele, Oliver Peters, Benedetta Nacmias, Matthias Riemenschneider, Reinhard Heun, Carol Brayne, David C Rubinsztein, Ammar Al-Chalabi, Christopher E Shaw, John Collinge, David Mann, Magda Tsolaki, Jordi Clarimón, Rebecca Sussams, Simon Lovestone, Simon Mead, Clive Holmes, John Powell, Kevin Morgan, Peter Passmore, Dan Rujescu, Sara Ortega-Cubero, John “Keoni” Kauwe,
Data generation
Rebecca Sims, Rachel Raybould, Stefanie Heilmann-Heimbach, Per Hoffmann, Rhodri Thomas, Taniesha Morgan, Nicola Denning, Alfredo Ramirez, Julie Williams, Jose Bras, Rita Guerreiro, John Hardy
Analysis
Rebecca Sims, Nandini Badarinarayan, Maria Vronskaya, Denise Harold, Elisa Majounie, Peter A. Holmans
Manuscript preparation
Rebecca Sims, Lesley Jones, Peter A. Holmans, Julie Williams
Study supervision/management
Rebecca Sims, Alfredo Ramirez, Julie Williams
ADGC
Adam C. Naj3, Brian W. Kunkle8, Eden R. Martin8,11, Amanda B. Kuzma16, Robert R. Graham20, Badri N. Vardarajan23,24,25, Kara L. Hamilton-Nelson8, Gary W. Beecham8,11, Cory C. Funk34, Hongdong Li34, Otto Valladares16, Liming Qu16, Yi Zhao16, John Malamon16, Beth Dombroski16, Patrice Whitehead8, Shubhabrata Mukherjee48, Laura B. Cantwell16, Jeremy D. Burgess51, Mariet Allen51, Nathan D Price34, Paramita Chakrabarty60, Xue Wang51, Paul K. Crane48, Robert C. Barber71, Perrie M. Adams73, Marilyn S. Albert75, Duane Beekly78, Deborah Blacker81,82, Rachelle S. Doody85, Thomas J. Fairchild89, Matthew P. Frosch92, Bernardino Ghetti93, Ryan M. Huebinger94, M. Ilyas Kamboh95,96, Mindy J. Katz99, C. Dirk Keene101, Walter A. Kukull88, Eric B. Larson48,104, Richard B. Lipton99, Thomas J. Montine101, Ronald C. Petersen109, Eric M. Reiman112,113,114,115, Joan S. Reisch59,117, Donald R. Royall118, Mary Sano121, Peter St George-Hyslop123,124, Debby W. Tsuang125,126, Ashley R. Winslow128, Chuang-Kuo Wu130, ADGC, Timothy W. Behrens20, Alison M. Goate98a, Carlos Cruchaga97,98, Todd E. Gold60,146, Nilufer Ertekin-Taner51,109, Steven G Younkin51,109, Dennis W. Dickson51, Hakon Hakonarson156, Lindsay A. Farrer14, Johnathan Haines159, Richard Mayeux23,24,25, Margaret A. Pericak-Vance8,11, Li-San Wang16, Gerard D. Schellenberg16.
Study design or conception
Lindsay A. Farrer, Johnathan Haines, Richard Mayeux
Margaret A. Pericak-Vance, Li-San Wang, Gerard D. Schellenberg
Sample contribution
Ashley R. Winslow, Shubhabrata Mukherjee, Paul K. Crane, Robert C. Barber, Perrie M. Adams, Marilyn S. Albert, Deborah Blacker, Rachelle S. Doody, Thomas J. Fairchild, Matthew P. Frosch, Bernardino Ghetti, Ryan M. Huebinger, M. Ilyas Kamboh, Mindy J. Katz, C. Dirk Keene, Eric B. Larson, Richard B. Lipton, Thomas J. Montine, Ronald C. Petersen, Eric M. Reiman, Joan S. Reisch, Donald R. Royall, Mary Sano, Peter St George-Hyslop, Debby W. Tsuang, Chuang-Kuo Wu, Alison M. Goate, Carlos Cruchaga, Steven G Younkin, Dennis W. Dickson, Walter A. Kukull, Nilufer Ertekin-Taner
Data generation
Otto Valladares, Liming Qu, Yi Zhao, John Malamon, Cory C. Funk, Hongdong Li, Jeremy D. Burgess, Mariet Allen, Nathan D Price, Paramita Chakrabarty, Xue Wang, Todd E. Golde, Hakon Hakonarson, Timothy W. Behrens, Beth Dombroski, Walter A. Kukull, Nilufer Ertekin-Taner
Analysis
Adam C. Naj, Brian W. Kunkle, Eden R. Martin, Amanda Partch, Robert R. Graham, Badri N. Vardarajan, Kara L. Hamilton-Nelson, Gary W. Beecham
Manuscript preparation
Adam C. Naj, Gerard D. Schellenberg
Study supervision/management
Gerard D. Schellenberg, Laura B. Cantwell, Duane Beekly, Patrice Whitehead
CHARGE
Sven J. van der Lee2, Johanna Jakobsdottir7, Joshua C. Bis10, Vincent Chouraki14,15, Agustin Ruiz19, Megan L. Grove22, Charles C. White28, Seung-Hoan Choi14,32, Albert V. Smith7,33, Shahzad Ahmad2, Claudia L. Satizabal14,15, Jennifer A. Brody10, Frank J. Wolters2, Myriam Fornage39, Thomas H. Mosley40, Josée Dupuis32, Xueqiu Jian39, Honghuang Lin162, Sonia Moreno-Grau19, Hieab H. Adams2, L. Adrienne Cupples15,32, Daniel Levy14,15,59, Alexa S. Beiser15,32, Melissa E. Garcia68, Gudny Eiriksdottir7, Isabel Henández19, Lluis Tarraga19, Yuning Chen32, Valur Emilsson7,77, Reinhold Schmidt80, Helena Schmidt84, WT Longstreth Jr87,88, Oscar L. Lopez90,91, Qiong Yang32, Shuo Li32, Oscar Sotolongo-Grau19, Jayanadra J. Himali14, Annette L. Fitzpatrick88,102, Thor Aspelund7,103, Jerome I. Rotter105, Albert Hofman2, Eric Boerwinkle22,108, Fernando Rivadeneira2,110,111, Christopher J. O’Donnell15, CHARGE, Andre G. Uitterlinden2,110,111, David A. Bennett145, Philip L. De Jager148, Bruce M. Psaty10,88,104,149, Vilmundur Gudnason7,33, Anita L. DeStefano15,32, Merce Boada19, M. Arfan Ikram2,158, Lenore J. Launer68, Najaf Amin2, Cornelia M. van Duijn2, Sudha Seshadri14,15.
Study design or conception
S. J. van der Lee, Joshua C. Bis, Philip L. De Jager, Vilmundur Gudnason, Anita L. DeStefano, Lenore J. Launer, Najaf Amin, Cornelia M. van Duijn, Sudha Seshadri.
Sample contribution
Joshua C. Bis, Agustin Ruiz, Megan L. Grove, Claudia L. Satizabal, Frank J. Wolters, Thomas H. Mosley, Alexa S. Beiser, Melissa E. Garcia, Gudny Eiriksdottir, Reinhold Schmidt, Helena Schmidt, WT Longstreth, Jr, Oscar L. Lopez, Jayanadra J. Himali, Annette L. Fitzpatrick, Albert Hofman, David A. Bennett, Philip L. De Jager, Bruce M. Psaty, Vilmundur Gudnason, Merce Boada, M. Arfan Ikram, Lenore J. Launer.
Data generation
Sven J. van der Lee, Agustin Ruiz, Fernando Rivadeneira, Andre G., Uitterlinden, Joshua C. Bis, Megan L. Grove, Helena Schmidt, Johanna Jakobsdottir, Albert V. Smith, Jennifer A. Brody, Myriam Fornage, Xueqiu Jian, Honghuang Lin, L. Adrienne Cupples, Daniel Levy, Qiong Yang, Thor Aspelund, Eric Boerwinkle, Christopher J. O’Donnell, Merce Boada, Shahzad Ahmad, Sonia Moreno-Grau, Hieab H. Adams, Isabel Henández, Lluis Tarraga, Oscar Sotolongo-Grau, Najaf Amin
Analysis
Sven J. van der Lee, Agustin Ruiz, Joshua C. Bis, Megan L. Grove, Helena Schmidt, Johanna Jakobsdottir, Albert V. Smith, Sonia Moreno-Grau, Najaf Amin, Vincent Chouraki, Charles C. White, Seung-Hoan Choi, Josée Dupuis, Yuning Chen, Shuo Li, Anita L. DeStefano
Manuscript preparation
Sven J. van der Lee, Agustin Ruiz, Joshua C. Bis, Johanna Jakobsdottir, Vincent Chouraki, Charles C. White, Cornelia M. van Duijn, Sudha Seshadri
Study supervision/management
Cornelia M. van Duijn, Sudha Seshadri, M. Arfan Ikram
EADI
Céline Bellenguez4,5,6, Anne Boland9, Benjamin Grenier-Boley4,5,6, Kristel Sleegers17,18, Robert Olaso9, Mikko Hiltunen26,27, Jacques Epelbaum29, Cécile Dulary9, Céline Derbois9, Delphine Bacq9, Alessio Squassina36, Pascual Sanchez-Juan37, Florentino Sanchez Garcia38, Maria Candida Deniz Naranjo38, David Wallon41,42, Laura Fratiglioni45,46, Lina Keller46, Francesco Panza49, Vincenzo Solfrizzi52, Davide Seripa53, Didier Hannequin42,55, Paolo Caffarra61,62, Vimantas Giedraitis64, Lars Lannfelt64, Florence Pasquier69,70, EADI, Martin Ingelsson64, Caroline Graff45,147, Onofre Cambarros37, Claudine Berr150,151,152, Jean-Francois Dartigues153, Dominique Campion41,42, Christine Van Broeckhoven17,18, Christophe Tzourio160,161, Jean-François Deleuze9, Philippe Amouyel4,5,6,69, Jean-Charles Lambert4,5,6.
Study design or conception
Phillippe Amouyel, Jean-Charles Lambert
Sample contribution
Jacques Epelbaum, David Wallon, Didier Hannequin, Florence Pasquier, Claudine Berr, Jean-Francois Dartigues, Dominique campion, Christophe Tzourio, Phillippe Amouyel, Jean-Charles Lambert, Vincent Dermecourt, Nathalie Fievet, Olivier Hanon, Carole Dufouil, Alexis Brice, Karen Ritchie, Bruno Dubois, Kristel Sleegers, Mikko Hiltunen, Maria Del Zompo, Ignacio Mateo, Florentino Sanchez Garcia, Maria Candida Deniz Naranjo, Laura Fratiglioni, Lina Keller, Francesco Panza, Paolo Caffarra, Lars Lannfelt, Martin Ingelsson, Caroline Graff, Onofre Cambarros, Christine Van Broeckhoven, Sebastien Engelborghs, Rik Vandenberghe, Peter P. De Deyn, Alession Squassina, Pascual Sanchez-Juan, Carmen, Munoz Fernadez, Yoland Aladro Benito, Hakan Thonberg, Charlotte Forsell, Lena Lilius, Anne Kinhult-stählbom, Vilmantas Giedraitis, Lena Kilander, RoseMarie Brundin, Letizia Concari, Seppo Helisalmi, Anne Maria Koivisto, Annakaisa Haapasalo, Vincenzo Solfrizzi, Vincenza Frisardi
Data generation
Anne Boland, Robert Aloso, Cécile Dulary, Céline Derbois, Delphine Bacq, Jean-François Deleuze, Fabienne Garzia, Feroze Golamaully, Gislain Septier
Analysis
Céline Bellenguez, Benjamin Grenier-Boley, Phillippe Amouyel, Jean-Charles Lambert
Manuscript preparation
Céline Bellenguez, Jean-Charles Lambert Study
supervision/management
Phillippe Amouyel, Jean-Charles Lambert
Footnotes
Competing Financial Interests Statement
Robert R. Graham and Timothy W. Behrens are full-time employees of Genentech Inc. Deborah Blacker is a consultant for Biogen Inc. Ronald C. Petersen is a consultant for Roche Inc., Merck Inc., Genentech Inc., Biogen Inc., and Eli Lilly. Ashley R. Winslow is a former employee and stockholder of Pfizer, Inc., and a current employee of the Perelman School of Medicine at the University of Pennsylvania Orphan Disease Center in partnership with the Loulou. Alison M. Goate is a member of the scientific advisory board for Denali Therapeutics. Nilufer Ertekin-Taner is a consultant for Cytox. John Hardy holds a collaborative grant with Cytox cofunded by Department of Business (Biz). Frank Jessen acts as a consultant for Novartis, Eli Lilly, Nutricia, MSD, Roche and Piramal. Neither Dr. Morris nor his family owns stock or has equity interest (outside of mutual funds or other externally directed accounts) in any pharmaceutical or biotechnology company. Dr. Morris is currently participating in clinical trials of antidementia drugs from Eli Lilly and Company, Biogen, and Janssen. Dr. Morris serves as a consultant for Lilly USA. He receives research support from Eli Lilly/Avid Radiopharmaceuticals and is funded by NIH grants # P50AG005681; P01AG003991; P01AG026276 and UF01AG032438.
References
- 1.Gatz M, et al. Role of genes and environments for explaining Alzheimer disease. Arch Gen Psychiatry. 2006;63:168–174. doi: 10.1001/archpsyc.63.2.168. [DOI] [PubMed] [Google Scholar]
- 2.Lambert JC, et al. Meta-analysis of 74,046 individuals identifies 11 new susceptibility loci for Alzheimer’s disease. Nat Genet. 2013;45:1452–1458. doi: 10.1038/ng.2802. [DOI] [PMC free article] [PubMed] [Google Scholar]
- 3.Harold D, et al. Genome-wide association study identifies variants at CLU and PICALM associated with Alzheimer’s disease. Nat Genet. 2009;41:1088–1093. doi: 10.1038/ng.440. [DOI] [PMC free article] [PubMed] [Google Scholar]
- 4.Lambert J-C, et al. Genome-wide association study identifies variants at CLU and CR1 associated with Alzheimer’s disease. Nat Genet. 2009;41:1094–1099. doi: 10.1038/ng.439. [DOI] [PubMed] [Google Scholar]
- 5.Escott-Price V, et al. Gene-wide analysis detects two new susceptibility genes for Alzheimer’s disease. PloS One. 2014;9:e94661. doi: 10.1371/journal.pone.0094661. [DOI] [PMC free article] [PubMed] [Google Scholar]
- 6.Hollingworth P, et al. Common variants at ABCA7, MS4A6A/MS4A4E, EPHA1, CD33 and CD2AP are associated with Alzheimer’s disease. Nat Genet. 2011;43:429–435. doi: 10.1038/ng.803. [DOI] [PMC free article] [PubMed] [Google Scholar]
- 7.Naj AC, et al. Common variants at MS4A4/MS4A6E, CD2AP, CD33 and EPHA1 are associated with late-onset Alzheimer’s disease. Nat Genet. 2011;43:436–441. doi: 10.1038/ng.801. [DOI] [PMC free article] [PubMed] [Google Scholar]
- 8.Ruiz A, et al. TOWARD FINE MAPPING AND FUNCTIONAL CHARACTERIZATION OF GENOME-WIDE ASSOCIATION STUDY-IDENTIFIED LOCUS RS74615166 (TRIP4) FOR ALZHEIMER’S DISEASE. Alzheimers Dement J Alzheimers Assoc. 2014;10:P257–P258. [Google Scholar]
- 9.Jonsson T, et al. Variant of TREM2 Associated with the Risk of Alzheimer’s Disease. N Engl J Med. 2013;368:107–116. doi: 10.1056/NEJMoa1211103. [DOI] [PMC free article] [PubMed] [Google Scholar]
- 10.Jonsson T, et al. A mutation in APP protects against Alzheimer’s disease and age-related cognitive decline. Nature. 2012;488:96–99. doi: 10.1038/nature11283. [DOI] [PubMed] [Google Scholar]
- 11.Guerreiro R, et al. TREM2 Variants in Alzheimer’s Disease. N Engl J Med. 2013;368:117–127. doi: 10.1056/NEJMoa1211851. [DOI] [PMC free article] [PubMed] [Google Scholar]
- 12.Seshadri S, et al. Genome-wide analysis of genetic loci associated with Alzheimer disease. JAMA. 2010;303:1832–1840. doi: 10.1001/jama.2010.574. [DOI] [PMC free article] [PubMed] [Google Scholar]
- 13.Escott-Price V, et al. Common polygenic variation enhances risk prediction for Alzheimer’s disease. Brain J Neurol. 2015;138:3673–3684. doi: 10.1093/brain/awv268. [DOI] [PMC free article] [PubMed] [Google Scholar]
- 14.Bodmer W, Bonilla C. Common and rare variants in multifactorial susceptibility to common diseases. Nat Genet. 2008;40:695–701. doi: 10.1038/ng.f.136. [DOI] [PMC free article] [PubMed] [Google Scholar]
- 15.Pritchard JK. Are rare variants responsible for susceptibility to complex diseases? Am J Hum Genet. 2001;69:124–137. doi: 10.1086/321272. [DOI] [PMC free article] [PubMed] [Google Scholar]
- 16.Schork NJ, Murray SS, Frazer KA, Topol EJ. Common vs. rare allele hypotheses for complex diseases. Curr Opin Genet Dev. 2009;19:212–219. doi: 10.1016/j.gde.2009.04.010. [DOI] [PMC free article] [PubMed] [Google Scholar]
- 17.Surakka I, et al. The impact of low-frequency and rare variants on lipid levels. Nat Genet. 2015;47:589–597. doi: 10.1038/ng.3300. [DOI] [PMC free article] [PubMed] [Google Scholar]
- 18.Vardarajan BN, et al. Coding mutations in SORL1 and Alzheimer disease. Ann Neurol. 2015;77:215–227. doi: 10.1002/ana.24305. [DOI] [PMC free article] [PubMed] [Google Scholar]
- 19.Vardarajan BN, et al. Rare coding mutations identified by sequencing of Alzheimer disease genome-wide association studies loci. Ann Neurol. 2015;78:487–498. doi: 10.1002/ana.24466. [DOI] [PMC free article] [PubMed] [Google Scholar]
- 20.Steinberg S, et al. Loss-of-function variants in ABCA7 confer risk of Alzheimer’s disease. Nat Genet. 2015;47:445–447. doi: 10.1038/ng.3246. [DOI] [PubMed] [Google Scholar]
- 21.Logue MW, et al. Two rare AKAP9 variants are associated with Alzheimer’s disease in African Americans. Alzheimers Dement J Alzheimers Assoc. 2014;10:609–618.e11. doi: 10.1016/j.jalz.2014.06.010. [DOI] [PMC free article] [PubMed] [Google Scholar]
- 22.Jun G, et al. PLXNA4 is associated with Alzheimer disease and modulates tau phosphorylation. Ann Neurol. 2014;76:379–392. doi: 10.1002/ana.24219. [DOI] [PMC free article] [PubMed] [Google Scholar]
- 23.Hunkapiller J, et al. A rare coding variant alters UNC5C function and predisposes to Alzheimer’s disease. Alzheimers Dement J Alzheimers Assoc. 2013;9:P853. [Google Scholar]
- 24.Wetzel-Smith MK, et al. A rare mutation in UNC5C predisposes to late-onset Alzheimer’s disease and increases neuronal cell death. Nat Med. 2014;20:1452–1457. doi: 10.1038/nm.3736. [DOI] [PMC free article] [PubMed] [Google Scholar]
- 25.Richards AL, et al. Exome arrays capture polygenic rare variant contributions to schizophrenia. Hum Mol Genet. 2016 doi: 10.1093/hmg/ddv620. [DOI] [PMC free article] [PubMed] [Google Scholar]
- 26.Wessel J, et al. Low-frequency and rare exome chip variants associate with fasting glucose and type 2 diabetes susceptibility. Nat Commun. 2015;6:5897. doi: 10.1038/ncomms6897. [DOI] [PMC free article] [PubMed] [Google Scholar]
- 27.Igartua C, et al. Ethnic-specific associations of rare and low-frequency DNA sequence variants with asthma. Nat Commun. 2015;6:5965. doi: 10.1038/ncomms6965. [DOI] [PMC free article] [PubMed] [Google Scholar]
- 28.Tachmazidou I, et al. A rare functional cardioprotective APOC3 variant has risen in frequency in distinct population isolates. Nat Commun. 2013;4:2872. doi: 10.1038/ncomms3872. [DOI] [PMC free article] [PubMed] [Google Scholar]
- 29.Huyghe JR, et al. Exome array analysis identifies new loci and low-frequency variants influencing insulin processing and secretion. Nat Genet. 2013;45:197–201. doi: 10.1038/ng.2507. [DOI] [PMC free article] [PubMed] [Google Scholar]
- 30.Willer CJ, Li Y, Abecasis GR. METAL: fast and efficient meta-analysis of genomewide association scans. Bioinformatics. 2010;26:2190–2191. doi: 10.1093/bioinformatics/btq340. [DOI] [PMC free article] [PubMed] [Google Scholar]
- 31.R Development Core Team. R: A language and environment for statistical computing. R Foundation for Statistical Computing; [Google Scholar]
- 32.Das S, et al. Imputation server: next generation genotype imputation service. Nat Genet. doi: 10.1038/ng.3656. [DOI] [PMC free article] [PubMed] [Google Scholar]
- 33.McCarthy S, et al. A reference panel of 64,976 haplotypes for genotype imputation. bioRxiv 35170. 2015 doi: 10.1101/035170. [DOI] [PMC free article] [PubMed] [Google Scholar]
- 34.Jin SC, et al. Coding variants in TREM2 increase risk for Alzheimer’s disease. Hum Mol Genet. 2014;23:5838–5846. doi: 10.1093/hmg/ddu277. [DOI] [PMC free article] [PubMed] [Google Scholar]
- 35.Lu Y, Liu W, Wang X. TREM2 variants and risk of Alzheimer’s disease: a meta-analysis. Neurol Sci. 2015;36:1881–1888. doi: 10.1007/s10072-015-2274-2. [DOI] [PubMed] [Google Scholar]
- 36.Cruchaga C, et al. GWAS of cerebrospinal fluid tau levels identifies risk variants for Alzheimer’s disease. Neuron. 2013;78:256–268. doi: 10.1016/j.neuron.2013.02.026. [DOI] [PMC free article] [PubMed] [Google Scholar]
- 37.International Genomics of Alzheimer’s Disease Consortium (IGAP) Convergent genetic and expression data implicate immunity in Alzheimer’s disease. Alzheimers Dement J Alzheimers Assoc. 2015;11:658–671. doi: 10.1016/j.jalz.2014.05.1757. [DOI] [PMC free article] [PubMed] [Google Scholar]
- 38.Zhang Y, et al. Purification and Characterization of Progenitor and Mature Human Astrocytes Reveals Transcriptional and Functional Differences with Mouse. Neuron. 2016;89:37–53. doi: 10.1016/j.neuron.2015.11.013. [DOI] [PMC free article] [PubMed] [Google Scholar]
- 39.Milner JD. PLAID: a Syndrome of Complex Patterns of Disease and Unique Phenotypes. J Clin Immunol. 2015;35:527–530. doi: 10.1007/s10875-015-0177-x. [DOI] [PMC free article] [PubMed] [Google Scholar]
- 40.Fairfax BP, et al. Innate Immune Activity Conditions the Effect of Regulatory Variants upon Monocyte Gene Expression. Science. 2014;343:1246949. doi: 10.1126/science.1246949. [DOI] [PMC free article] [PubMed] [Google Scholar]
- 41.Sekino S, et al. The NESH/Abi-3-based WAVE2 complex is functionally distinct from the Abi-1-based WAVE2 complex. Cell Commun Signal CCS. 2015;13 doi: 10.1186/s12964-015-0119-5. [DOI] [PMC free article] [PubMed] [Google Scholar]
- 42.Nolz JC, et al. The WAVE2 Complex Regulates Actin Cytoskeletal Reorganization and CRAC-Mediated Calcium Entry during T Cell Activation. Curr Biol CB. 2006;16:24–34. doi: 10.1016/j.cub.2005.11.036. [DOI] [PMC free article] [PubMed] [Google Scholar]
- 43.Xing J, Titus AR, Humphrey MB. The TREM2-DAP12 signaling pathway in Nasu-Hakola disease: a molecular genetics perspective. Res Rep Biochem. 2015;5:89–100. doi: 10.2147/RRBC.S58057. [DOI] [PMC free article] [PubMed] [Google Scholar]
- 44.Neumann H, Takahashi K. Essential role of the microglial triggering receptor expressed on myeloid cells-2 (TREM2) for central nervous tissue immune homeostasis. J Neuroimmunol. 2007;184:92–99. doi: 10.1016/j.jneuroim.2006.11.032. [DOI] [PubMed] [Google Scholar]
- 45.Painter MM, et al. TREM2 in CNS homeostasis and neurodegenerative disease. Mol Neurodegener. 2015;10:43. doi: 10.1186/s13024-015-0040-9. [DOI] [PMC free article] [PubMed] [Google Scholar]
- 46.Ulrich JD, et al. In vivo measurement of apolipoprotein E from the brain interstitial fluid using microdialysis. Mol Neurodegener. 2013;8:13. doi: 10.1186/1750-1326-8-13. [DOI] [PMC free article] [PubMed] [Google Scholar]
- 47.Wang Y, et al. TREM2 lipid sensing sustains the microglial response in an Alzheimer’s disease model. Cell. 2015;160:1061–1071. doi: 10.1016/j.cell.2015.01.049. [DOI] [PMC free article] [PubMed] [Google Scholar]
- 48.Rademakers R, et al. Mutations in the colony stimulating factor 1 receptor (CSF1R) gene cause hereditary diffuse leukoencephalopathy with spheroids. Nat Genet. 2012;44:200–205. doi: 10.1038/ng.1027. [DOI] [PMC free article] [PubMed] [Google Scholar]
- 49.Perlmutter LS, Barron E, Chui HC. Morphologic association between microglia and senile plaque amyloid in Alzheimer’s disease. Neurosci Lett. 1990;119:32–36. doi: 10.1016/0304-3940(90)90748-x. [DOI] [PubMed] [Google Scholar]
- 50.Wisniewski HM, Wegiel J, Wang KC, Lach B. Ultrastructural studies of the cells forming amyloid in the cortical vessel wall in Alzheimer’s disease. Acta Neuropathol (Berl) 1992;84:117–127. doi: 10.1007/BF00311383. [DOI] [PubMed] [Google Scholar]
- 51.Schwab C, Klegeris A, McGeer PL. Inflammation in transgenic mouse models of neurodegenerative disorders. Biochim Biophys Acta BBA - Mol Basis Dis. 2010;1802:889–902. doi: 10.1016/j.bbadis.2009.10.013. [DOI] [PubMed] [Google Scholar]
- 52.Hong S, et al. Complement and microglia mediate early synapse loss in Alzheimer mouse models. Science. 2016 doi: 10.1126/science.aad8373. [DOI] [PMC free article] [PubMed] [Google Scholar]
- 53.Olmos-Alonso A, et al. Pharmacological targeting of CSF1R inhibits microglial proliferation and prevents the progression of Alzheimer’s-like pathology. Brain. 2016 doi: 10.1093/brain/awv379. [DOI] [PMC free article] [PubMed] [Google Scholar]
- 54.Paris D, et al. The Spleen Tyrosine Kinase (syk) Regulates Alzheimer’s Aβ Production and Tau Hyperphosphorylation. J Biol Chem. 2014 doi: 10.1074/jbc.M114.608091. jbc.M114.608091. [DOI] [PMC free article] [PubMed] [Google Scholar]
- 55.Bao M, et al. CD2AP/SHIP1 complex positively regulates plasmacytoid dendritic cell receptor signaling by inhibiting the E3 ubiquitin ligase Cbl. J Immunol Baltim Md 1950. 2012;189:786–792. doi: 10.4049/jimmunol.1200887. [DOI] [PMC free article] [PubMed] [Google Scholar]
- 56.Kurosaki T, Tsukada S. BLNK: Connecting Syk and Btk to Calcium Signals. Immunity. 2000;12:1–5. doi: 10.1016/s1074-7613(00)80153-3. [DOI] [PubMed] [Google Scholar]
- 57.Wang Y, et al. TREM2-mediated early microglial response limits diffusion and toxicity of amyloid plaques. J Exp Med. 2016;213:667–675. doi: 10.1084/jem.20151948. [DOI] [PMC free article] [PubMed] [Google Scholar]
- 58.Yuan P, et al. TREM2 Haplodeficiency in Mice and Humans Impairs the Microglia Barrier Function Leading to Decreased Amyloid Compaction and Severe Axonal Dystrophy. Neuron. 2016;90:724–739. doi: 10.1016/j.neuron.2016.05.003. [DOI] [PMC free article] [PubMed] [Google Scholar]
Methods only References
- 1.Goldstein JI, et al. zCall: a rare variant caller for array-based genotyping: genetics and population analysis. Bioinforma Oxf Engl. 2012;28:2543–2545. doi: 10.1093/bioinformatics/bts479. [DOI] [PMC free article] [PubMed] [Google Scholar]
- 2.Devlin B, Roeder K. Genomic control for association studies. Biometrics. 1999;55:997–1004. doi: 10.1111/j.0006-341x.1999.00997.x. [DOI] [PubMed] [Google Scholar]
- 3.Grove ML, et al. Best Practices and Joint Calling of the HumanExome BeadChip: The CHARGE Consortium. PLoS ONE. 2013;8:e68095. doi: 10.1371/journal.pone.0068095. [DOI] [PMC free article] [PubMed] [Google Scholar]
- 4.Patterson N, Price AL, Reich D. Population structure and eigenanalysis. PLoS Genet. 2006;2:e190. doi: 10.1371/journal.pgen.0020190. [DOI] [PMC free article] [PubMed] [Google Scholar]
- 5.Das S, et al. Imputation server: next generation genotype imputation service. Nat Genet. doi: 10.1038/ng.3656. [DOI] [PMC free article] [PubMed] [Google Scholar]
- 6.McCarthy S, et al. A reference panel of 64,976 haplotypes for genotype imputation. bioRxiv 35170. 2015 doi: 10.1101/035170. [DOI] [PMC free article] [PubMed] [Google Scholar]
- 7.Lambert JC, et al. Meta-analysis of 74,046 individuals identifies 11 new susceptibility loci for Alzheimer’s disease. Nat Genet. 2013;45:1452–1458. doi: 10.1038/ng.2802. [DOI] [PMC free article] [PubMed] [Google Scholar]
- 8.Naj AC, et al. Common variants at MS4A4/MS4A6E, CD2AP, CD33 and EPHA1 are associated with late-onset Alzheimer’s disease. Nat Genet. 2011;43:436–441. doi: 10.1038/ng.801. [DOI] [PMC free article] [PubMed] [Google Scholar]
- 9.Howie B, Fuchsberger C, Stephens M, Marchini J, Abecasis GR. Fast and accurate genotype imputation in genome-wide association studies through pre-phasing. Nat Genet. 2012;44:955–959. doi: 10.1038/ng.2354. [DOI] [PMC free article] [PubMed] [Google Scholar]
- 10.Fuchsberger C, Abecasis GR, Hinds DA. minimac2: faster genotype imputation. Bioinforma Oxf Engl. 2015;31:782–784. doi: 10.1093/bioinformatics/btu704. [DOI] [PMC free article] [PubMed] [Google Scholar]
- 11.International Genomics of Alzheimer’s Disease Consortium (IGAP) Convergent genetic and expression data implicate immunity in Alzheimer’s disease. Alzheimers Dement J Alzheimers Assoc. 2015;11:658–671. doi: 10.1016/j.jalz.2014.05.1757. [DOI] [PMC free article] [PubMed] [Google Scholar]
- 12.Talluri R, Shete S. A linkage disequilibrium-based approach to selecting disease-associated rare variants. PloS One. 2013;8:e69226. doi: 10.1371/journal.pone.0069226. [DOI] [PMC free article] [PubMed] [Google Scholar]
- 13.Holmans P, et al. Gene ontology analysis of GWA study data sets provides insights into the biology of bipolar disorder. Am J Hum Genet. 2009;85:13–24. doi: 10.1016/j.ajhg.2009.05.011. [DOI] [PMC free article] [PubMed] [Google Scholar]
- 14.Lim ASP, et al. 24-hour rhythms of DNA methylation and their relation with rhythms of RNA expression in the human dorsolateral prefrontal cortex. PLoS Genet. 2014;10:e1004792. doi: 10.1371/journal.pgen.1004792. [DOI] [PMC free article] [PubMed] [Google Scholar] [Retracted]
- 15.Zhang Y, et al. Purification and Characterization of Progenitor and Mature Human Astrocytes Reveals Transcriptional and Functional Differences with Mouse. Neuron. 2016;89:37–53. doi: 10.1016/j.neuron.2015.11.013. [DOI] [PMC free article] [PubMed] [Google Scholar]
- 16.De Jager PL, et al. Alzheimer’s disease: early alterations in brain DNA methylation at ANK1, BIN1, RHBDF2 and other loci. Nat Neurosci. 2014;17:1156–1163. doi: 10.1038/nn.3786. [DOI] [PMC free article] [PubMed] [Google Scholar]
- 17.Chan G, et al. CD33 modulates TREM2: convergence of Alzheimer loci. Nat Neurosci. 2015;18:1556–1558. doi: 10.1038/nn.4126. [DOI] [PMC free article] [PubMed] [Google Scholar]
Associated Data
This section collects any data citations, data availability statements, or supplementary materials included in this article.
Supplementary Materials
Data Availability Statement
Summary statistics for the 43 genetic associations identified are provided in Supplementary Table 6.
Stage 1 data (individual level) for the GERAD exome chip cohort can be accessed by applying directly to Cardiff University. Stage 1 ADGC data is deposited in NIAGADS and NIA/NIH sanctioned qualified access data repository. Stage 1 CHARGE data is accessible by applying to dbGaP for all US cohorts, and to ERASMUS University for Rotterdam data. AGES primary data are not available due to Icelandic laws. Stage 2 and stage 3 primary data is available upon request.
A detailed description of the Mayo Clinic RNAseq data is available to all qualified investigators through the Accelerating Medicines Partnership in Alzheimer’s Disease (AMP-AD) knowledge portal that is hosted in the Synapse software platform from Sage Bionetworks (Synapse IDs: syn3157182 and syn3435792 (mouse data), and syn3163039 (human data)).