Abstract
Background:
Schinus terebinthifolius Raddi belongs to Anacardiacea family and is widely known as “aroeira.” This species originates from South America, and its extracts are used in folk medicine due to its therapeutic properties, which include antimicrobial, anti-inflammatory, and antipyretic effects. The complexity and variability of the chemical constitution of the herbal raw material establishes the quality of the respective herbal medicine products.
Objective:
Thus, the purpose of this study was to investigate the variability of the volatile compounds from leaves of S. terebinthifolius.
Materials and Methods:
The samples were collected from different states of the Northeast region of Brazil and analyzed with a gas chromatograph coupled to a mass spectrometer (GC-MS). The collected data were analyzed using multivariate data analysis.
Results:
The samples’ chromatograms, obtained by GC-MS, showed similar chemical profiles in a number of peaks, but some differences were observed in the intensity of these analytical markers. The chromatographic fingerprints obtained by GC-MS were suitable for discrimination of the samples; these results along with a statistical treatment (principal component analysis [PCA]) were used as a tool for comparative analysis between the different samples of S. terebinthifolius.
Conclusion:
The experimental data show that the PCA used in this study clustered the samples into groups with similar chemical profiles, which builds an appropriate approach to evaluate the similarity in the phytochemical pattern found in the different leaf samples.
SUMMARY
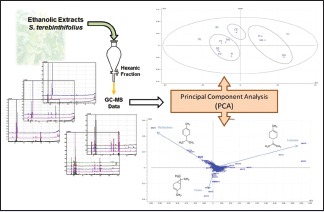
The leave extracts of Schinus terebinthifolius were obtained by turbo-extraction
The extracts were partitioned with hexane and analyzed by GC-MS
The chromatographic data were analyzed using the principal component analysis (PCA)
The PCA plots showed the main compounds (phellandrene, limonene, and carene), which were used to group the samples from a different geographical location in accordance to their chemical similarity.
Abbreviations used: AL: Alagoas, BA: Bahia, CE: Ceará, CPETEC: Center for Weather Forecasting and Climate Studies, GC-MS: Gas chromatograph coupled to a mass spectrometer, MA: Maranhão, MVA: Multivariate data analysis, PB: Paraíba, PC1: Direction that describes the maximum variance of the original data, PC2: Maximum direction variance of the data in the subspace orthogonal to PC1, PCA: Principal component analysis, PE: Pernambuco, PI: Piauí, RN: Rio Grande do Norte, SE: Sergipe.
Keywords: Schinus terebinthifolius, GC-MS, fingerprint, chemometrics, principal component analysis
INTRODUCTION
Schinus terebinthifolius Raddi belongs to Anacardiacea family and originates from South America. It is distributed throughout Brazil and is more commonly known as “aroeira.” This plant is widely used in folk medicine for its antioxidant, antibacterial, anti-inflammatory, and analgesic effects and also to treat urogenital diseases.[1,2]
The studies by Cole et al.[3] showed that S. terebinthifolius mainly presented monoterpenes (85.81%) on its chemical constitution, with the main compounds being: d-3-carene (30.37%), limonene (17.44%), phellandrene (12.60%), pinene (12.59%), myrcene (5.82%), and o-cymene (3.46%); sesquiterpenes are shown in minor proportion (5.34%).
The characteristic fingerprint of the plant samples, obtained by an analytical method, allowed the separation of the largest possible number of compounds generating a specific pattern of recognition. This specific pattern typifies the chemical composition of the samples; such composition was submitted to a chemometric data analysis.[4,5]
The chemometric method of principal component analysis (PCA), used for chemical profiles, has been widely applied in the analysis of chemical information of herbal drugs. In addition, chromatographic analysis coupled with multivariate statistical methods (chemometric method) has been extensively used for classifying and distinguishing several plants.[6,7]
This study aims to evaluate the similarity among S. terebinthifolius samples collected in nine states of the Northeast of Brazil using the gas chromatograph coupled to a mass spectrometer (GC-MS) fingerprinting technique. Furthermore, the PCA was applied to the chemical profiles for the evaluation of similarities among the tested samples. Therefore, it is expected that the combination of this analysis will provide an appropriate approach to conduct a comprehensive evaluation of S. terebinthifolius.
MATERIALS AND METHODS
Plant material
The leaves from S. terebinthifolius used to obtain the extracts for this study were collected in October 2015, from different Northeastern states of Brazil: Alagoas (AL) - Maceio (9°39’45.0”S/35°42’33.1”W); Bahia (BA) - Salvador (13°00’13.8”S/38°30’33.2”W); Ceará (CE) - Fortaleza (3°45’09.8”S/38°31’34.5”W); Maranhão (MA) - São Luis (2°30’27.2”S/44°15’15.8”W); Paraíba (PB) - João Pessoa (7°08’10.4”S/34°50’32.3”W); Pernambuco (PE) - Recife (8°02’48.7”S/34°56’52.7”W); Piauí (PI) - Teresina (5°01’55.9”S/42°48’32.2”W); Rio Grande do Norte (RN) - Natal (5°52’20.9”S/35°11’08.2”W); and Sergipe (SE) - Aracaju (10°54’32.5”S/37°04’17.7”W).
A voucher specimen of the plant was identified and deposited in the Herbarium Lauro Pires Xavier of the Federal University of Paraíba with reference numbers JPB 54051, 54052, and 54053. The climatic data of the harvest period were obtained from the weather prediction center and climate studies.[8]
Analysis method
Fresh S. terebinthifolius leaves were used for extraction, with a drug: solvent ratio of 1:2. After cutting the leaves, about 100 g of the plant was weighed and submitted to a turbo-extraction with 200 mL of an 80% alcohol solution. For turbo-extraction, an Ultra-Turrax (IKA, model T-18, Frankfurt, Germany) was used at a rotation of 11,000 rpm. The extraction was conducted for 15 min with a 5 min interval so that the temperature would not exceed 35°C. The extract obtained by turbo-extraction was filtered and submitted to a liquid–liquid extraction process using hexane (1:2) and finally submitted to a gas chromatography for analysis.
The samples were analyzed by GC-MS detection GC-MS Ultra (Shimadzu, model GC-2010 Plus, Japan) equipped with a capillary column Rtx-5 (30 m × 0.25 mm × 0.25 µm), helium carrier gas, with flow rate of 1.0 ml/min. The temperature of the column was programed as follows: from 60°C to 200°C with a heating rate of 10°C/min and then from 200°C to 280°C with a heating rate of 20°C/min. The injection volume was 1.0 μl. The temperatures of injection and detection were 260°C and 280°C, respectively.
Chemometric analysis
The chromatographic data obtained by GC-MS were analyzed using the PCA. The PCA is used to qualitatively analyze the samples by reducing the number of variables and data dimensionality. The score plot of PCA is an observational map that shows the possible presence of any outliers in the data.[9,10,11]
To execute the PCA analysis, each variable (the m/z intensity of each peak) was subtracted from the average variable. Afterward, the results were interpreted in terms of the average variation.[11]
The analysis was made by the preprocessing (on average center) of the original data in addition to using the software XCMS Online (https://xcmsonline.scripps.edu/) to calculate the correlation coefficients of the chromatographic patterns of the samples based on a correlation coefficient (median). The analysis of similarity for the different chromatograms, as well as the correlation coefficient, was used to calculate the results. The classification of the chromatographic profiles was performed by the PCA with the aid of this software.
RESULTS AND DISCUSSION
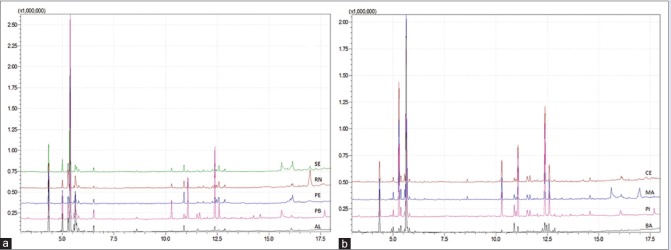
The plants were collected in October 2015. According to Center for Weather Forecasting and Climate Studies,[8] from September to November, most of the Northeast region was in its dry season, except the states of Piauí, Maranhão, and the West of Bahia. The GC-chromatograms for the samples are presented in Figure 1. The qualitative analysis of the chromatograms showed small differences among the chemical profiles, especially regarding its main peaks.
Figure 1.
Chromatographic profiles of samples from Schinus terebinthifolius: (a) Chromatograms of samples from SE, RN, PE, PB and AL; (b) chromatograms of samples from the states of CE, MA, PI and BA. SE: Sergipe, RN: Rio Grande do Norte, PE: Pernambuco, PB: Paraíba, AL: Alagoas, CE: Ceará, MA: Maranhão, PI: Piauí, BA: Bahia
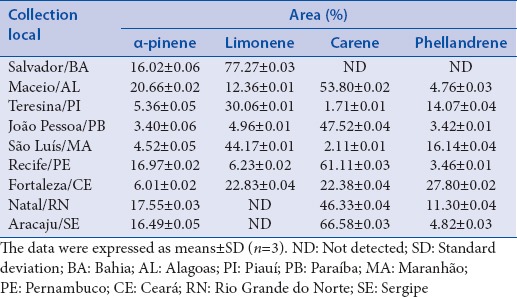
The gas chromatographic analysis allowed the separation and identification of the volatile compounds where the ones with the highest concentrations were α-pinene, limonene, carene, and phellandrene [Table 1]. In addition to these main compounds, the extracts also presented myrcene, δ-elemene, α-cubebene, γ-cadinene, and α-copaene For samples collected in Bahia (BA), Piauí (PI), and Maranhão (MA), limonene was the compound with the highest percentage. Regarding the samples from Alagoas (AL), Paraíba (PB), Pernambuco (PE), Rio Grande do Norte (RN) and Sergipe (SE); carene was the compound with the highest percentage, while phellandrene was the major compound for the samples collected in Ceará (CE). Even though α-pinene does not represent the highest percentage in any of the samples, it is present in all of them and may, therefore, be a standard reference peak.
Table 1.
The major components identified by gas chromatography-mass spectrometry from samples of Schinus terebinthifolius
The majority of the compounds identified in the samples of this study are qualitatively similar to previously reported data for the leaves of S. terebinthifolius. According to studies by Jamal and Agusta[12] in India, detected 3-carene, α-pinene, β-pinene, α-phellandrene, limonene, sabinene, p-cymene, β-cymene, δ-elemene, isocaryophyllene, and α-cubebene in their study with the leaves of this plant.
The studies described by Gundidza et al.[13] detected α-pinene (30.27%), camphene (0.58%), β-myrcene (6.60%), β-pinene (7.96%), myrcene (1.63%), α-phellandrene (9.86%), α-terpinene (0.77%), sabinene (40.66%), trans-b-ocimene (0.30%), γ-terpinene (0.77%), and 3-cyclohexen-1-ol (0.61%) when studying the composition of S. terebinthifolius leaves.
The variability of the main compounds on different samples collected in the states of the Northeast region of Brazil may be related to the microclimates of each region since the amount of secondary metabolites on medicinal plants may vary depending on various factors such as seasonality, circadian period, age, development of the plant, and availability of nutrients and water in the soil.[14]
In a study carried out by Barbosa et al.,[15] the oil content in the leaves of S. terebinthifolius showed some minor changes throughout the course of 1 year, but these changes were usually statistically insignificant. The oil content was higher (0.65%–0.69%) between March and September and lower (0.45%–0.55%) between October and February, which coincided with flowering and fruiting, respectively. The oil extracted from flowerless leaf petioles showed the presence of α-pinene, phellandrene, myrcene, δ-elemene, γ-cadinene, and α-copaene, corroborating with the results of this study.
The application of chemometric techniques provides a higher quality interpretation of the data, enabling the classification and discrimination of the samples.[16]
To visualize the degree of similarity among the samples, the data were processed by PCA, to cluster samples with the same chromatographic characteristics. The chromatographic profiles obtained were organized in a data matrix containing 36 lines (samples) and 882 variables (ion fragment and retention time combined, m/z-time), and after the data pretreatment and alignment of the peaks, the chromatograms were evaluated by PCA.
The PCA was applied to evaluate the data of the compounds, determined by GC-MS, reducing the number of data set dimensions without losing relevant information. Obtaining a lower number of new variables (principal components) facilitates interpretation of the data. The analysis provided data clustering which allowed the identification of similar values among the samples. The main component 1 (PC1) explained 57% of the total variance of the data and the main component 2 (PC2) explained 19%. Thus, the PC1 × PC2 graph represents a variance of 76% of the plotted data, demonstrating that the sample points are distant [Figure 2]. In this way, samples with similar characteristics have nearby points on the graph.
Figure 2.
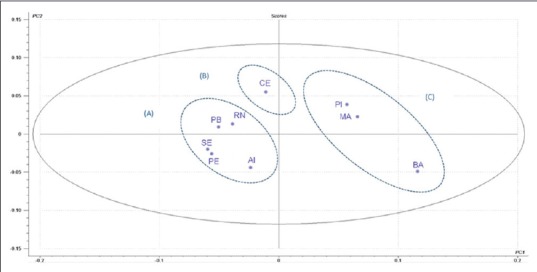
Principal component analysis of GC-MS data from samples of Schinus terebinthifolius. SE: Sergipe, RN: Rio Grande do Norte, PE: Pernambuco, PB: Paraíba, AL: Alagoas, CE: Ceará, MA: Maranhão, PI: Piauí and BA: Bahia
The data were normalized between − 0.2 and + 0.2 for both PC1 and PC2. The results presented in Figure 2 shows that in PC1, PI and MA samples are grouped together in positive score values, along with BA sample, in negative score values. Analyzing the samples in PC2, it is possible to observe PB, RN, and CE samples in positive score values and SE, PE, and AL samples in negative score values. It can be observed in Figure 2, the clusters A, B, and C, which occurred because of the similarities between samples belonging to each group.
Analyzing the loading graph presented in Figure 3, which provides the variable that influences the clustering; the construction of the main components (PC1 and PC2) can be explained by the similarity of the samples in each group and therefore the projection of the samples in the score plot.[17]
Figure 3.
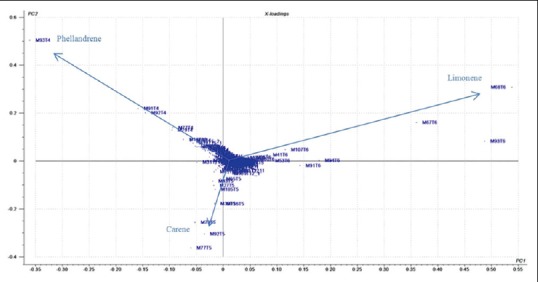
Loading graph of the different samples of Schinus terebinthifolius
Figure 3 shows the loading plot for the model. It was observed that the grouping fragment for the first quadrant area is 93 m/z with a retention time of 4 min, which is characteristic for phellandrene; the second quadrant showed 68 m/z with a retention time of 6 min, which is characteristic for limonene, and the third quadrant showed 92 m/z with a retention time of 5 min, which is characteristic for carene. Therefore, samples in groups A (RN, PB, SE, PE, and AL), B (CE), and C (PI, MA, and BA) are grouped by the presence of carene, phellandrene, and limonene, respectively.
The scatter plot provided by the PCA was an important tool for this analysis since it allowed the comparison and exploration of complex data and multivariate design of the samples in a two-dimensional graph, where the chromatogram was treated not as a set of many peaks but as a single signal multivariable, enabling a comparison between them. Therefore, we are able to assume that the PCA was an appropriate approach to examine the similarity between the samples.
CONCLUSION
This paper determined the chromatographic profiles for S. terebinthifolius leaves using GC-MS. The data were treated by PCA. This analysis made it possible to investigate the similarity of the chemical compounds present in leaf samples of S. terebinthifolius from different states of the Northeast of Brazil.
Analyzing the chromatographic fingerprints from samples of S. terebinthifolius, it was possible to identify the main components in each sample and detect variations in their chemical composition.
The model obtained with PCA was effective in the interpretation of the data analyzed. Thus, the samples could be distributed into three groups by comparing the score and loading data obtained from the combination of main components.
Group A containing samples from the states of RN, PB, SE, PE, and AL, Group B containing samples from the state of CE, and group C containing samples from the states of PI, MA, and BA; presented carene, phellandrene and limonene, as their main compounds, respectively. These markers guided the data clustering. Thus, plants belonging to the same group showed chemical similarities.
In conclusion, this study showed that the chemometric approach for the analysis of the GC-fingerprints from samples of S. terebinthifolius samples was able to their comparative analysis.
Financial support and sponsorship
This work was partially supported by CNPq [308386/2015 9] and FACEPE [APQ 0363 4.03/13, APQ 0493 4.03/14].
Conflicts of interest
There are no conflicts of interest.
Acknowledgements
The authors thank the CNPq, FACEPE, ANVISA/MS, UFPB and UFPE for their support. The authors are also grateful to Andrew Alastair Cumming for editing this paper.
REFERENCES
- 1.D’Sousa’Costa CO, Ribeiro PR, Loureiro MB, Simões RC, de Castro RD, Fernandez LG. Phytochemical screening, antioxidant and antibacterial activities of extracts prepared from different tissues of Schinus terebinthifolius Raddi that occurs in the coast of Bahia, Brazil. Pharmacogn Mag. 2015;11:607–14. doi: 10.4103/0973-1296.160459. [DOI] [PMC free article] [PubMed] [Google Scholar]
- 2.Piccinelli AC, Santos JA, Konkiewitz EC, Oesterreich SA, Formagio AS, Croda J, et al. Antihyperalgesic and antidepressive actions of (R)-(+)-limonene, α-phellandrene, and essential oil from Schinus terebinthifolius fruits in a neuropathic pain model. Nutr Neurosci. 2015;18:217–24. doi: 10.1179/1476830514Y.0000000119. [DOI] [PubMed] [Google Scholar]
- 3.Cole ER, dos Santos RB, Lacerda V, Júnior, Martins JD, Greco SJ, Cunha Neto A. Chemical composition of essential oil from ripe fruit of Schinus terebinthifolius Raddi and evaluation of its activity against wild strains of hospital origin. Braz J Microbiol. 2014;45:821–8. doi: 10.1590/s1517-83822014000300009. [DOI] [PMC free article] [PubMed] [Google Scholar]
- 4.Donno D, Boggia R, Zunin P, Cerutti AK, Guido M, Mellano MG, et al. Phytochemical fingerprint and chemometrics for natural food preparation pattern recognition: An innovative technique in food supplement quality control. J Food Sci Technol. 2016;53:1071–83. doi: 10.1007/s13197-015-2115-6. [DOI] [PMC free article] [PubMed] [Google Scholar]
- 5.Qin K, Wang B, Li W, Cai H, Chen D, Liu X, et al. Quality assessment of raw and processed Arctium lappa L. through multicomponent quantification, chromatographic fingerprint, and related chemometric analysis. J Sep Sci. 2015;38:1491–8. doi: 10.1002/jssc.201401299. [DOI] [PubMed] [Google Scholar]
- 6.Wang D, He F, Lv Z, Li D. Phytochemical composition, antioxidant activity and HPLC fingerprinting profiles of three Pyrola species from different regions. PLoS One. 2014;9:e96329. doi: 10.1371/journal.pone.0096329. [DOI] [PMC free article] [PubMed] [Google Scholar]
- 7.Zhang Z, Liang Y, Xie P, Chau F, Chan K. Chromatographic fingerprinting and chemometric techniques for quality control of herb medicines. In: Poon J, Poon SK, editors. Data Analytics for Traditional Chinese Medicine Research. Switzerland: Springer International Publishing; 2014. pp. 133–153. [Google Scholar]
- 8.CPTEC. Center for Weather Forecasting and Climate Studies. Brazil: Ministry of Science and Technology; 2015. [Last accessed on 2015 Dec 18]. Available from: http://infoclima1.cptec.inpe.br/ [Google Scholar]
- 9.Alaerts G, Pieters S, Logie H, Van Erps J, Merino-Arévalo M, Dejaegher B, et al. Exploration and classification of chromatographic fingerprints as additional tool for identification and quality control of several Artemisia species. J Pharm Biomed Anal. 2014;95:34–46. doi: 10.1016/j.jpba.2014.02.006. [DOI] [PubMed] [Google Scholar]
- 10.Pomerantsev AL, Rodionova OY. Concept and role of extreme objects in PCA/SIMCA. J Chemom. 2014;28:429–38. [Google Scholar]
- 11.Iorgulescu E, Voicu VA, Sârbu C, Tache F, Albu F, Medvedovici A. Experimental variability and data pre-processing as factors affecting the discrimination power of some chemometric approaches (PCA, CA and a new algorithm based on linear regression) applied to (+/-) ESI/MS and RPLC/UV data: Application on green tea extracts. Talanta. 2016;155:133–44. doi: 10.1016/j.talanta.2016.04.042. [DOI] [PubMed] [Google Scholar]
- 12.Jamal Y, Agusta A. Chemical composition of essential oil Schinus terebinthifolius Raddi leaves. Indones J Pharm. 2001;12:135–9. [Google Scholar]
- 13.Gundidza M, Gweru N, Magwa ML, Mmbengwa V, Samie A. The chemical composition and biological activities of essential oil from the fresh leaves of Schinus terebinthifolius from Zimbabwe. Afr J Biotechnol. 2009;8:7164–9. [Google Scholar]
- 14.Czelusniak KE, Brocco A, Pereira DF, Freitas GB. Morpho-anatomy, phytochemistry and pharmacology of Mikania glomerata Sprengel: A brief literature review. Rev Bras Plant Med. 2012;14:400–9. [Google Scholar]
- 15.Barbosa LC, Demuner AJ, Clemente AD, Paula VF, Ismail F. Seasonal variation in the composition of volatile oils from Schinus terebinthifolius RADDI. Quim Nova. 2007;30:1959–65. [Google Scholar]
- 16.Zeng Z, Li J, Hugel HM, Xu G, Marriott PJ. Interpretation of comprehensive two-dimensional gas chromatography data using advanced chemometrics. Trends Anal Chem. 2014;53:150–66. [Google Scholar]
- 17.Prado VM, Moraes VR, Nogueira PC, Cruz EM, Blank AF, Pereira-Filho ER, et al. Characterization of teas from Lippia gracilis schauer genotypes by HPLC-DAD chromatographic profile combined with chemometric analyses. Quim Nova. 2012;35:1814–8. [Google Scholar]


