

Abstract
Background
We investigated how body weight affects survival after stroke, leveraging the availability of multiple prestroke body mass index (BMI) measurements and using a nested case‐control design in a community‐based sample.
Methods and Results
We compared all‐cause mortality in participants stratified by prestroke weight. Separate analyses were performed for ischemic stroke and all stroke and for age‐, sex‐, and BMI category‐matched stroke‐free controls. Participants were grouped into BMI categories and followed for up to 10 years. Differences in survival were tested for interaction by case status. In sensitivity analysis, to exclude those with prestroke weight loss, we restricted the reference group to participants with 2 consistently normal BMI measurements within 10 years before stroke/matching. There were 782 stroke cases (age 71±9, 51% female participants, 87% ischemic stroke) and 2346 controls (age 72±9, 51% female participants). Overweight participants with ischemic stroke had a lower mortality compared with those with normal weight (hazard ratio [HR]=0.70, 95%CI 0.55‐0.90, P=0.005). The association of reduced mortality with BMI ≥25, compared with normal‐weight BMI 18.5 to <25, was pronounced among ischemic stroke cases but diminished with inclusion of hemorrhagic strokes (case‐control interaction P=0.051 and P=0.130, respectively). Compared with participants with stable normal weight, moderately increased weight was protective after ischemic stroke (overweight HR=0.72, 95%CI 0.53‐0.99, P=0.041).
Conclusions
Overweight and mildly obese participants had better 10‐year survival after ischemic stroke compared with normal‐weight participants, even after excluding persons with recent prestroke weight loss. There may be unknown protective factors associated with a moderately increased body weight before stroke.
Keywords: body mass index, body weight, cerebrovascular disease, epidemiology, mortality, obesity, recurrent event, risk factor, secondary prevention, stroke
Subject Categories: Cerebrovascular Disease/Stroke, Obesity, Secondary Prevention, Mortality/Survival, Epidemiology
Clinical Perspective
What is New?
The article presents long‐term data from a large community‐based prospective study investigating the association of prestroke weight status with survival after stroke.
Using a nested case‐control design and rigorous adjustment for potential confounding, the study observed that persons who were overweight or mildly obese had reduced 10‐year mortality after stroke, compared with normal weight persons.
This paradoxical effect was strongest in participants less than age 70 or in males; no survival benefit was seen with excess weight in the stroke‐free control group.
Removal of participants with prestroke weight loss and controlling for prior smoking did not change the observed results.
What Are the Clinical Implications?
Obesity is a risk factor for stroke and is associated with higher mortality, yet the role of increased body weight on prognosis after stroke remains a controversial topic.
It is unknown whether a biological mechanism associated with excess weight is responsible for the survival benefit, or whether other factors, such as more intensive risk factor control in the overweight or obese, produced this finding.
Further research is needed to determine appropriate clinical recommendations for weight loss or weight maintenance after stroke.
Introduction
Epidemiologists have observed a decline in stroke incidence and case fatality in the United States attributable to improved risk factor control.1, 2 Obesity is an independent risk factor for stroke, and increased body mass index (BMI) has been associated with all‐cause mortality in the general population.3, 4 For primary prevention of stroke, clinicians recommend lifestyle modification and maintenance of healthy weight.5 However, the effects of overweight and obesity on prognosis after stroke are a controversial topic. Some prospective studies have observed lower mortality after stroke in obese persons compared with those with normal weight,6, 7 but others have not.8, 9
The counterintuitive relationship observed between higher BMI and improved survival after stroke has been described as an “obesity paradox” and is seen in other disease states such as heart failure and myocardial infarction.10, 11 Previous studies sampled only hospitalized patients without age‐matched control groups. Hence, it was not clear whether a higher body weight reduced mortality in all older adults or only in persons with stroke. In addition, change in weight before stroke may also be associated with mortality,12, 13 information that is not routinely obtained at the time of hospitalization.
To better understand the complex relationship between weight status and mortality in the presence and absence of stroke, we examined the association among participants with incident ischemic stroke and all incident stroke, compared to stroke‐free controls matched on age, sex, and BMI category, in the community‐based Framingham Heart Study (FHS). In secondary analysis we investigated whether change in BMI before stroke affects the observed associations by restricting the normal‐weight reference group to persons with 2 normal BMI measurements within the 10 years before stroke or matching.
Methods
Study Design
We used a nested case‐control study design. Investigators followed a cohort of all incident stroke cases in the FHS with prestroke BMI data available for all‐cause mortality. We followed a cohort of stroke‐free matched controls in an identical manner. The study protocol was approved by the institutional review board of Boston University School of Medicine, and all participants gave written informed consent.
Selection of Participants
The Original FHS cohort enrolled in 1948 consisted of 5209 participants (2336 men and 2873 women), aged 28 to 62 years, who were reexamined every 2 years. The Offspring cohort, which also enrolled the spouses of offspring, began in 1971 and consisted of 5124 participants (2483 men and 2641 women), aged 5 to 70 years, who were examined approximately once every 4 years.
Between January 1951 and December 2011, 1058 subjects between the ages of 45 and 85 had an incident stroke. Stroke cases attending a FHS examination within the 5 years before their incident stroke were included in the analysis. Participants without BMI measurement at the exam or with BMI <18.5 were excluded. To each case we randomly assigned 3 age‐ (within 2 years), sex‐, and BMI category–matched controls who were alive and stroke‐free at matching and who had attended an examination within 5 years before the matching date. We excluded a total of 276 cases: 210 had not attended an exam within 5 years before stroke; 41 attended a recent exam but did not have BMI data available; 15 had BMI <18.5; 16 did not have matching controls.
Definition of Stroke
The stroke surveillance protocols for the FHS, including confirmation of diagnosis, type of stroke, and assessment of stroke severity, have been published previously.2, 14 The diagnosis of stroke was determined by a panel of 3 investigators (at least 2 neurologists) using ongoing clinic and hospital surveillance data: medical records, imaging, and, when available, examination by a FHS neurologist. Clinical stroke was defined as rapidly developing focal neurologic symptoms and signs of presumed vascular etiology, lasting more than 24 hours. This definition excludes transient ischemic attacks and silent cerebral infarctions detected only by imaging. Stroke was categorized into ischemic, including atherothrombotic brain infarction and cardiac embolus, or hemorrhagic, including subarachnoid and intracerebral. These definitions were initially based on clinical and cerebrospinal fluid findings. Since the late 1970s, findings on neuroimaging were used to confirm the diagnosis. Ischemic stroke was diagnosed if brain imaging showed no hemorrhage, if imaging showed an infarct that correlated with the clinical deficit, or if an ischemic infarction was documented at autopsy.
Ischemic stroke subtypes were categorized based on preestablished diagnostic criteria that include clinical features, imaging studies and other laboratory criteria, noninvasive vascular studies, cardiac evaluations for a source of embolus, and information from autopsy studies, if performed. The subtypes were: cardioembolic, lacunar atherothrombotic brain infarctions, nonlacunar (“large artery”) atherothrombotic brain infarctions, other, and strokes of unknown origin. Stroke severity was categorized based on the observed neurologic deficits at the initial neurologic examination, either performed by an FHS neurologist or abstracted from the medical records by the stroke adjudication panel. Deficits were classified into 4 categories: none (no deficit/impairment), mild (visual, communication, motor, and/or sensory deficit with impairment insufficient to affect functional independence), moderate (deficit requiring assistance in 1 visual, communication, motor, or sensory domain), and severe (the participant was functionally dependent on others in 2 or more visual, communication, motor, or sensory domains). The stroke was categorized as fatal if the person died due to the stroke within 48 hours of the onset of stroke. These definitions have remained stable over time.
Description of Dependent and Independent Variables
Weight was determined to the nearest pound on a physician's scale, and stature was measured to the nearest quarter inch. Height and weight were converted to meters and kilograms, allowing calculation of BMI for participants at each examination. Three BMI categories (normal, BMI 18.5 to <25; overweight, BMI 25 to <30; obese, BMI ≥30) were used in primary statistical analyses, as well as 5 subcategories (normal, BMI 18.5 to <25; low overweight, BMI 25 to <27.5; high overweight, BMI 27.5 to <30; low obesity, BMI 30 to <32.5; high obesity, BMI ≥32.5).
Systolic blood pressure was measured for participants at each clinic examination. Marital status (married or not married), education (no high school graduation, high school graduate, some college, and college graduate), smoking pack‐years, and current smoking (yes or no), were determined during interview. Persons on diabetic medications or with a recorded fasting glucose ≥7.0 mmol/L or random blood glucose level ≥11.1 mmol/L at the clinic examination were categorized as having diabetes mellitus. Atrial fibrillation was verified by 2 FHS cardiologists who reviewed interim and examination electrocardiograms. Methods used to document, diagnose, ascertain, and classify coronary heart disease and heart failure in the FHS have been published.15 Prevalent cancer was validated using medical records with pathology reports, if available; the definition excluded benign tumors and nonmelanoma skin cancers. Detection and diagnosis of dementia have been described in a previous report.16
For sensitivity analysis, we defined a prestroke “stable normal weight” reference group for comparison with higher BMI categories. Participants were identified as having “stable normal weight” if they had BMI measurements of 18.5 to <25 in 2 previous exam cycles within 10 years before the date of stroke or matching. Participants were required to have 1 of these measurements in the recent period, within 5 years before stroke/matching and the other measurement more remotely, from between 5 and 10 years before stroke/matching, to define their normal weight as “stable” over a long‐term period of 5 to 10 years.
Participants were followed for mortality for up to 10 years from the date of stroke or matching, through December 2014. Deaths were ascertained by a committee of 3 physicians to determine probable cause after review of hospital records, imaging, autopsy findings, death certificates, and interviews with family members. The end point of this study was all‐cause mortality.
Statistical Analysis
Baseline characteristics were described for cases and controls using measures of central tendency and dispersion (means±SD or medians and quartiles) for continuous variables and frequency and proportions for categorical variables. Differences between the groups were evaluated using t tests, ANOVA, chi‐squared, and Fisher exact tests, as appropriate.
Separately for ischemic stroke cases, all stroke cases, and stroke‐free matched controls, we used multivariable Cox proportional hazards models with 10‐year mortality as the outcome to estimate the hazard ratios associated with (1) a 1 standard of deviation change in natural log‐transformed BMI, (2) each of 2 BMI categories (overweight and obese) as compared to the referent normal BMI, (3) a composite indicator of overweight plus obese participants with BMI ≥25 as compared to a normal BMI 18.5 to <25, and (4) each of 4 BMI subcategories (low overweight, high overweight, low obesity, and high obesity) compared to normal weight. Model 1 was adjusted for age, sex, time between the FHS examination and event date, education, marital status, and smoking status. For ischemic stroke cases and their stroke‐free matched controls, a second model (model 2) was adjusted for the same factors as model 1 as well as systolic blood pressure, diabetes mellitus, atrial fibrillation, heart failure, coronary heart disease, prevalent cancer, and dementia. We tested for an interaction between case/control status and BMI category in their effect on mortality overall and stratified by age and sex. Additionally, among ischemic stroke cases, we tested for interaction between the weight category and each of stroke severity and ischemic stroke subtype in their effects on mortality.
In sensitivity analyses, participants with weight loss within 10 years before stroke or matching were excluded to create a “stable normal weight” reference category (see Description of Dependent and Independent Variables). We performed additional sensitivity analysis to assess for an effect of antecedent smoking, adjusting for pack‐years smoking (instead of current smoking in model 1). Further secondary analysis was conducted using a follow‐up interval of 1 year to assess short‐term mortality. Significance was set at P<0.10 for tests for interactions and P<0.05 for all other models. Data were analyzed using SAS version 9.4 (SAS, Cary, NC).
Results
During the time period from which strokes were selected (1951‐2011), incident first‐ever stroke occurred in 782 (51% women) participants aged 45 to 84 who attended a recent exam, had BMI data available, and were not underweight. Figure S1 displays the selection of the study participants. The mean age of participants at initial stroke was 70.6 (SD 9.3) years; mean age for matched controls was 72.2 (SD 9.2) years. Median BMI was 26.7 (Q1‐Q3 24.3‐29.9) for cases and 26.7 (Q1‐Q3 24.3‐29.8) for controls. Among the cases and controls, 31.5% (246/782 and 738/2346, respectively) were normal weight, 44.2% (346/782 and 1038/2346, respectively) were overweight, and 24.3% (190/782 and 570/2346, respectively) were obese. Table 1 summarizes the overall baseline characteristics for cases and controls. As expected, cases were more likely to be current smokers, had higher systolic blood pressure, and were more likely to have diabetes mellitus, atrial fibrillation, heart failure, coronary heart disease, and prevalent dementia. They were more likely to be on treatment for hypertension.
Table 1.
Baseline Characteristics of All Stroke Cases and Controls
| All Stroke Cases (n=782) | Controls (n=2346) | |
|---|---|---|
| Age, y, mean±SD | 70.6±9.3 | 72.2±9.2 |
| Women, n, % | 398 (50.9) | 1194 (50.9) |
| BMI, kg/m2, median (Q1, Q3) | 26.7 (24.3, 29.9) | 26.7 (24.3, 29.8) |
| BMI category*, n, % | ||
| Normal weight | 246 (31.5) | 738 (31.5) |
| Overweight | 346 (44.2) | 1038 (44.2) |
| Low overweight | 202 (25.8) | 620 (26.4) |
| High overweight | 144 (18.4) | 418 (17.8) |
| Obese | 190 (24.3) | 570 (24.3) |
| Low obesity | 95 (12.2) | 299 (12.8) |
| High obesity | 95 (12.2) | 271 (11.6) |
| Marital status, n, % | ||
| Married | 516 (67.3) | 1430 (65.3) |
| Other (single, divorced, separated, or widowed) | 251 (32.7) | 759 (34.7) |
| Education, n, % | ||
| No high school graduation | 285 (38.2) | 827 (36.5) |
| High school graduate | 217 (29.1) | 651 (28.8) |
| Some college | 140 (18.8) | 421 (18.6) |
| College graduate | 104 (13.9) | 364 (16.1) |
| Current smoker § | 188 (26.7) | 393 (18.4) |
| SBP, mm Hg, mean±SD § | 151±27 | 143±22 |
| Antihypertensive treatment, n, % § | 343 (46.6) | 769 (34.8) |
| Diabetes mellitus, n, % § | 149 (23.0) | 241 (12.1) |
| Total cholesterol, mg/dL, mean±SD | 219±52 | 218±47 |
| Atrial fibrillation, n, % § | 109 (13.9) | 133 (5.7) |
| Heart failure, n, % § | 60 (7.7) | 69 (2.9) |
| Coronary heart disease, n, % § | 205 (26.2) | 420 (17.9) |
| Prevalent cancer † , n, % | 65 (9.6) | 189 (9.3) |
| Prevalent dementia, n, % § | 46 (8.8) | 51 (2.7) |
| Stroke severity, n, % | ||
| None, no deficit | 136 (17.4) | |
| Mild | 246 (31.4) | |
| Moderate | 152 (19.4) | n/a |
| Severe | 102 (13.0) | |
| Fatal | 7 (0.9) | |
| Stroke type, n, % | ||
| Ischemic | 677 (86.6) | |
| Hemorrhagic | 97 (12.4) | n/a |
| Other ‡ | 7 (0.9) | |
| Unknown | 1 (0.1) | |
| Ischemic stroke subtype, n, % | ||
| Cardioembolic | 182 (23.3) | |
| Nonlacunar ABI | 408 (52.2) | |
| Lacunar (ABI) | 87 (11.1) | n/a |
| Other | 4 (0.5) | |
| Unknown subtype | 1 (0.1) | |
ABI indicates atherothrombotic brain infarction; BMI, body mass index; Q1, first quartile; Q3, third quartile; SBP, systolic blood pressure.
*Normal weight=BMI 18.5 to <25. Overweight=BMI 25 to <30. Obese=BMI ≥30. Low overweight=BMI 25 to <27.5. High overweight=BMI 27.5 to <30. Low obesity=BMI 30 to <32.5. High obesity=BMI ≥32.5.
†Excludes nonmalignant/benign tumors and nonmelanoma skin cancers.
‡Other stroke includes all noncardioembolic and non‐ABI etiologies, including procedure‐related embolic stroke (1), central pontine myelinolysis (1), vasculitis (1), hypoperfusion due to cardiac arrest (1), and anticoagulant‐associated hemorrhagic stroke (3).
§Significant P value ≤0.001.
Among 677 ischemic stroke cases, 202 (29.8%) were normal weight, 167 (24.7%) were low overweight, 132 (19.5%) were high overweight, 86 (12.7%) were in the low obesity category, and 90 (13.3%) were in the high obesity category. Matched controls had a similar distribution in the 5 BMI categories, 606 (29.8%), 545 (16.8%), 352 (17.3%), 271 (13.3%), and 257 (12.7%), respectively. Table 2 summarizes the baseline characteristics of the ischemic stroke cases, grouped by weight categories. There were no significant differences in ischemic stroke subtype or stroke severity among the weight categories. Among ischemic stroke cases, as compared with persons of normal weight, those who were overweight or obese were significantly more likely to be male, married, less educated, nonsmokers, and diabetic. There were no significant differences in age, systolic blood pressure, heart disease, prevalent cancer, dementia, or treatment for hypertension. The distribution of stroke severity or stroke subtype did not differ by composite weight category (BMI 18.5 to <25 or BMI ≥25), as shown in Table S1.
Table 2.
Baseline Characteristics of Ischemic Stroke Cases by BMI Category*
| Normal Weight (n=202) | Overweight (n=299) | Obese (n=176) | |
|---|---|---|---|
| Age, y, mean±SD | 72±9 | 71±9 | 70±9 |
| Women, n, %§§§ | 128 (63) | 123 (41) | 88 (50) |
| Stroke severity, n, % | |||
| None, no deficit | 41 (21) | 59 (20) | 36 (22) |
| Mild | 69 (36) | 114 (39) | 63 (39) |
| Moderate | 43 (23) | 70 (24) | 39 (24) |
| Severe | 37 (19) | 43 (15) | 22 (14) |
| Fatal | 1 (1) | 4 (1) | 2 (1) |
| Stroke subtype, n, % | |||
| Cardioembolic | 63 (31) | 79 (26) | 40 (23) |
| Lacunar (ABI) | 23 (11) | 32 (11) | 32 (18) |
| ABI (nonlacunar) | 116 (58) | 188 (63) | 104 (59) |
| Marital status, n, %§ | |||
| Married | 178 (89) | 281 (95) | 166 (95) |
| Other (single, divorced, separated, or widowed) | 21 (11) | 15 (5) | 9 (5) |
| Education, n, %§§ | |||
| No high school graduation | 57 (29) | 117 (42) | 80 (47) |
| High school graduate | 60 (31) | 78 (28) | 41 (24) |
| Some college | 48 (25) | 40 (14) | 29 (17) |
| College graduate | 29 (15) | 45 (16) | 19 (11) |
| Current smoker, n, %§§§ | 68 (36) | 59 (22) | 29 (18) |
| SBP, mm Hg, mean±SD | 149±29 | 152±27 | 154±25 |
| Antihypertensive treatment, n, % | 83 (43) | 133 (48) | 90 (54) |
| Diabetes mellitus, n, %§§ | 29 (18) | 60 (23) | 48 (34) |
| Total cholesterol, mg/dL, mean±SD | 227±51 | 218±±52 | 211±56 |
| Atrial fibrillation, n, % | 31 (15) | 52 (17) | 22 (13) |
| Heart failure, n, % | 21 (10) | 24 (8) | 10 (6) |
| Coronary heart disease, n, % | 53 (26) | 81 (27) | 52 (30) |
| Prevalent cancer † , n, % | 23 (11) | 27 (9) | 15 (9) |
| Prevalent dementia, n, % | 13 (6) | 16 (5) | 4 (2) |
ABI indicates atherothrombotic brain infarction; BMI, body mass index; SBP, systolic blood pressure.
*Normal weight=BMI 18.5 to <25. Overweight=BMI 25 to <30. Obese=BMI ≥30.
†Excludes nonmalignant/benign tumors and nonmelanoma skin cancers.
§Significant P value: §<0.05, §§≤0.01, §§§≤0.001.
Table S2 displays the causes of mortality, either cardiovascular, cancer, or other, for ischemic stroke cases, all stroke cases, and controls, overall and stratified by weight categories. Among ischemic stroke cases, 65 died within 30 days of stroke (37% normal weight, 35% overweight, and 28% obese).
Table 3 displays the hazard ratios for mortality among the BMI categories for ischemic stroke cases and their matched controls, controlling for sociodemographic factors and smoking in model 1. Complete data for model 1 were available for 579 ischemic stroke cases and 1649 controls. Overall, we found a significant interaction between case/control status and composite BMI or BMI subcategory in their effects on mortality (P=0.051 and 0.079, respectively). Figure A displays a Kaplan‐Meier survival curve stratified by case/control status and composite BMI category. The association between BMI and mortality was not linear for strokes or controls. Compared with normal‐weight participants with ischemic stroke, there was significantly lower mortality at 10 years in overweight participants (HR=0.70, 95%CI 0.55‐0.90, P=0.005) but not in obese participants. Lower mortality was observed among a composite group of overweight and obese participants with BMI ≥25 (HR=0.75, 95%CI 0.60‐0.94, P=0.011) compared with normal‐weight BMI 18.5 to <25. We did not observe a significant association between weight status (overweight, obese, or composite BMI ≥25) and mortality among stroke‐free controls. Adjusting for smoking pack‐years to control for antecedent smoking did not change the effect of weight status categories on mortality (data not shown).
Table 3.
Mortality by BMI or BMI Category Among Ischemic Stroke Cases and Controls, Model 1*
| Mortality (%) | Case‐Control Interaction | Ischemic Stroke Cases | Controls | ||||
|---|---|---|---|---|---|---|---|
| 382/579 (66.0) | 716/1649 (43.0) | ||||||
| P Value | 10‐y Cumulative Hazard (95%CI) | 10‐y HR (95%CI) | P Value | 10‐y Cumulative Hazard (95%CI) | 10‐y HR (95%CI) | P Value | |
| BMI category † | 0.140 | ||||||
| Normal weight | 1.42 (1.18, 1.72) | 1.0 | 0.53 (0.46, 0.61) | 1.0 | |||
| Overweight | 1.00 (0.84, 1.19) | 0.70 (0.55, 0.90) | 0.005 | 0.48 (0.42, 0.54) | 0.91 (0.76, 1.08) | 0.280 | |
| Obese | 1.19 (0.97, 1.47) | 0.84 (0.64, 1.10) | 0.207 | 0.56 (0.48, 0.66) | 1.07 (0.87, 1.31) | 0.518 | |
| Composite BMI | 0.051 | ||||||
| 18.5 to <25 | 1.43 (1.18, 1.73) | 1.0 | 0.53 (0.46, 0.61) | 1.0 | |||
| ≥25 | 1.07 (0.93, 1.23) | 0.75 (0.60, 0.94) | 0.011 | 0.51 (0.46, 0.56) | 0.96 (0.82, 1.13) | 0.611 | |
| BMI subcategory † | 0.079 | ||||||
| Normal weight | 1.43 (1.18, 1.72) | 1.0 | 0.53 (0.46, 0.61) | 1.0 | |||
| Low overweight | 0.98 (0.79, 1.23) | 0.69 (0.52, 0.91) | 0.010 | 0.52 (0.45, 0.60) | 0.99 (0.82, 1.19) | 0.890 | |
| High overweight | 1.02 (0.79, 1.30) | 0.71 (0.53, 0.97) | 0.031 | 0.41 (0.34, 0.50) | 0.78 (0.61, 0.99) | 0.038 | |
| Low obesity | 0.90 (0.66, 1.22) | 0.63 (0.44, 0.90) | 0.011 | 0.51 (0.41, 0.63) | 0.96 (0.75, 1.23) | 0.753 | |
| High obesity | 1.62 (1.23, 2.14) | 1.14 (0.82, 1.59) | 0.437 | 0.64 (0.51, 0.79) | 1.21 (0.94, 1.56) | 0.147 | |
BMI indicates body mass index; HR, hazard ratio; LBMI, natural‐log‐transformed body mass index.
*Adjusted for age, sex, time between exam and event date, education, marital status, and smoking.
†Normal weight=BMI 18.5 to <25. Overweight=BMI 25 to <30. Obese=BMI ≥30. Low overweight=BMI 25 to <27.5. High overweight=BMI 27.5 to <30. Low obesity=BMI 30 to <32.5. High obesity=BMI ≥32.5.
Figure 1.
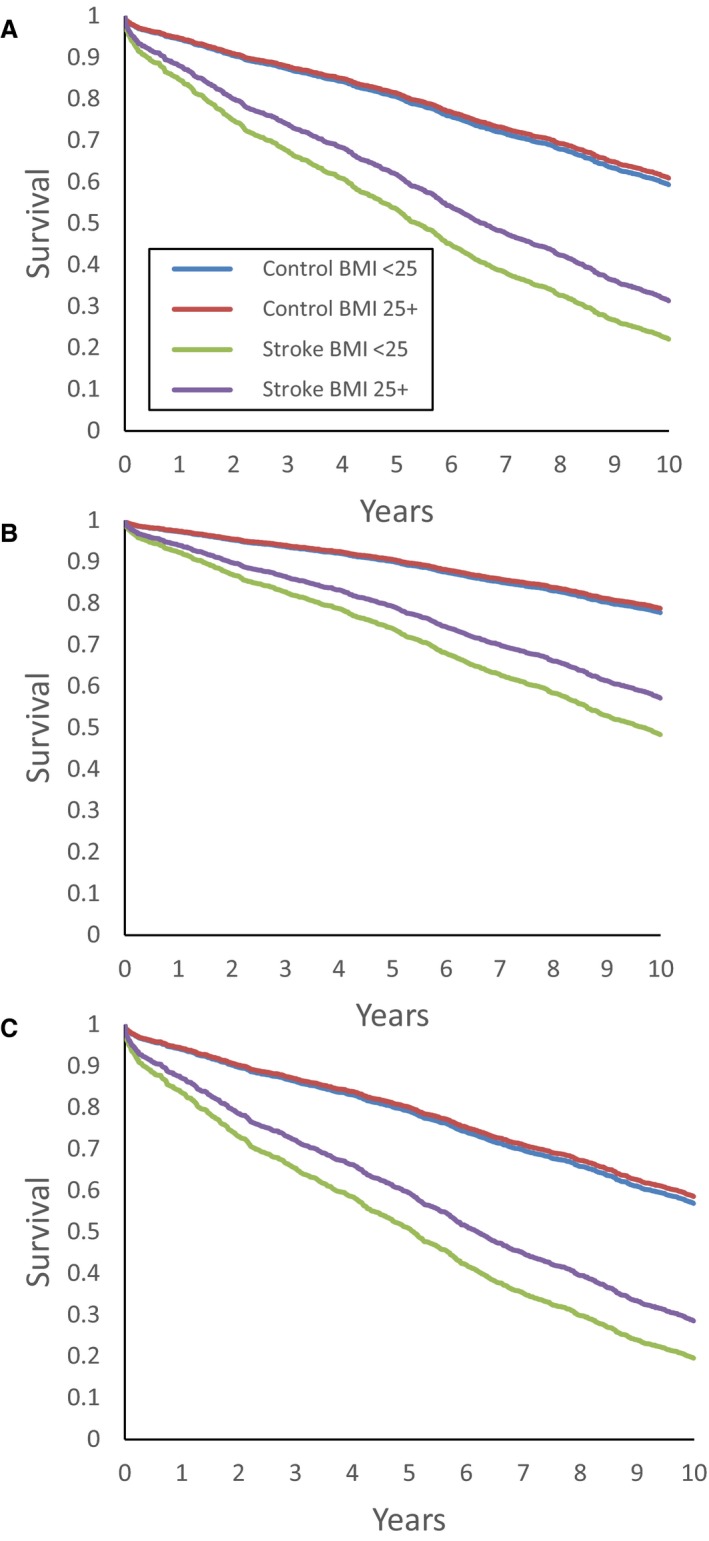
Kaplan‐Meier survival curves for ischemic stroke cases and controls, according to BMI composite category (normal‐weight BMI 18.5 to <25 or overweight/obese BMI ≥25), displaying 10‐year survival for (A) overall ischemic stroke cases and controls, and in subgroups of participants (B) <70 years old and (C) males. BMI indicates body mass index.
Among participants with ischemic stroke, on further categorization, the low overweight, high overweight, and low obesity subgroups had significantly lower mortality compared with the normal‐weight group (HR=0.69, 95%CI 0.52‐0.91, P=0.010; HR=0.71, 95%CI 0.53‐0.97, P=0.031; HR=0.63, 95%CI 0.44‐0.90, P=0.011, respectively), whereas participants in the high‐obesity subcategory with BMI ≥32.5 did not differ from the normal‐weight group (HR=1.14, 95%CI 0.82‐1.59, P=0.437).
Results for analyses of all stroke cases (ischemic and hemorrhagic) and their matched controls for model 1 are shown in Table S3. Multivariable data were available for 664 stroke cases and 1919 controls. The protective effect of a higher BMI was diminished with inclusion of hemorrhagic stroke cases in the analysis, as case‐control interaction did not reach statistical significance for an effect of higher BMI on mortality (P=0.130 for composite BMI and P=0.294 for BMI subcategories). However, stroke cases with moderately high BMI, including overweight and mildly obese persons, had lower mortality compared with the normal‐weight reference group.
Table S4 shows results for the secondary analysis (model 2), which adjusted for sociodemographic factors, smoking, cardiovascular risk factors (systolic blood pressure and diabetes mellitus), heart failure, atrial fibrillation, coronary artery disease, cancer, and prevalent dementia. Results are shown for ischemic stroke cases and controls. Among participants with ischemic stroke, mortality was less among the “low obese” than the normal‐weight cases.
Case/control interactions stratified by age, sex, and smoking are shown in Table 4 for the ischemic stroke cases and controls. We stratified age by those younger and older than 70, near the median age for the case and control cohorts. Lower mortality with higher prestroke BMI was observed primarily in persons aged <70 years and in males, as displayed in Figure B and C.
Table 4.
Age and Sex Interactions for 10‐Year Mortality Among Ischemic Stroke Cases and Controls, by BMI Categories
| Case‐Control Interaction | Ischemic Stroke Cases | Controls | |
|---|---|---|---|
| P value | HR (95%CI) | HR (95%CI) | |
| Age <70 y* | |||
| Mortality, % | 110/221 (49.8) | 129/541 (23.8) | |
| BMI category † | 0.026 | ||
| Normal weight | 1.0 | 1.0 | |
| Overweight | 0.49 (0.30, 0.78) §§ | 1.34 (0.83, 2.16) | |
| Obese | 0.69 (0.42, 1.14) | 1.50 (0.90, 2.48) | |
| Composite BMI | 0.012 | ||
| 18.5 to <25 | 1.0 | 1.0 | |
| ≥25 | 0.57 (0.37, 0.88) § | 1.40 (0.90, 2.19) | |
| Age ≥70 y* | |||
| Mortality (%) | 272/358 (76.0) | 587/1108 (53.0) | |
| BMI category | 0.956 | ||
| Normal weight | 1.0 | 1.0 | |
| Overweight | 0.80 (0.60, 1.07) | 0.86 (0.71, 1.03) | |
| Obese | 0.91 (0.65, 1.27) | 1.00 (0.80, 1.25) | |
| Composite BMI | 0.778 | ||
| 18.5 to <25 | 1.0 | 1.0 | |
| ≥25 | 0.84 (0.64, 1.09) | 0.90 (0.75, 1.07) | |
| Male ‡ | |||
| Mortality (%) | 189/278 (68.0) | 363/780 (46.5) | |
| BMI category | 0.180 | ||
| Normal weight | 1.0 | 1.0 | |
| Overweight | 0.70 (0.49, 1.00) | 1.07 (0.82, 1.39) | |
| Obese | 0.78 (0.51, 1.20) | 1.27 (0.93, 1.73) | |
| Composite BMI | 0.071 | ||
| 18.5 to <25 | 1.0 | 1.0 | |
| ≥25 | 0.72 (0.52, 1.02) | 1.12 (0.87, 1.43) | |
| Female ‡ | |||
| Mortality (%) | 193/301 (64.1) | 353/869 (40.6) | |
| BMI category | 0.888 | ||
| Normal weight | 1.0 | 1.0 | |
| Overweight | 0.68 (0.47, 0.97) § | 0.79 (0.62, 1.00) | |
| Obese | 0.89 (0.62, 1.29) | 0.96 (0.73, 1.26) | |
| Composite BMI | 0.863 | ||
| 18.5 to <25 | 1.0 | 1.0 | |
| ≥25 | 0.76 (0.56, 1.04) | 0.85 (0.68, 1.06) | |
BMI indicates body mass index; HR, hazard ratio.
*Adjusted for sex, time between exam and event date, education, marital status, and smoking.
†Normal weight=BMI 18.5 to <25. Overweight=BMI 25 to <30. Obese=BMI ≥30.
‡Adjusted for age, time between exam and event date, education, marital status, and smoking.
§Significant P value: §<0.05, §§≤0.01.
Sensitivity analyses restricted the normal‐weight reference group to participants with no weight loss before the stroke or matching. Table S5 displays the hazard ratios for mortality comparing different weight categories to the “stable normal weight” reference group. Ischemic stroke cases in the overweight BMI category, low overweight subcategory, and low obesity subcategory had improved survival compared with those with stable normal weight (HR=0.72, 95%CI 0.53‐0.99, P=0.041; HR=0.67, 95%CI 0.47‐0.95, P=0.025; and HR=0.60, CI 0.37‐0.99, P=0.044, respectively). No difference was seen by BMI category in the controls. Table S6 shows identical analyses for all stroke with the reference group again restricted to participants with stable normal weight. We did not observe a statistical significance in case/control interaction for survival stratified by weight groups, including composite BMI (P=0.351) and BMI subcategory (P=0.718).
In a final sensitivity analysis, mortality at 1 year follow‐up did not significantly differ between weight groups in either ischemic stroke cases or controls, as shown in Table S7.
Discussion
The comprehensive risk factor, weight, and mortality data captured in the FHS, along with monitoring of stroke‐free controls, afford a unique opportunity to evaluate the role of elevated body weight on mortality after stroke and to assess if this is an effect seen in all older persons or is restricted to stroke survivors. At 10 years of follow‐up, overweight and mild obesity were associated with reduced mortality after ischemic stroke, independent of other factors including age, sex, smoking, other cardiovascular risk factors, cancer, and dementia. There was no difference in the distribution of ischemic stroke severity or subtype between normal and overweight or obese participants to account for the difference in survival. The protective effect of a higher BMI was diminished with inclusion of hemorrhagic stroke cases, although the association between increasing weight and mortality again followed a U‐ or J‐shaped curve. Overall, participants with BMI 25 to <32.5 experienced a long‐term survival benefit after ischemic stroke, an effect not consistently seen in the controls without stroke. The effect was strongest in persons with stroke who were younger than age 70 or in males. Removal of participants with recent and potentially illness‐induced weight loss from the reference group attenuated but did not eliminate the observed association. Additional adjustment for antecedent smoking did not change the effect of weight status on mortality. Our study did not observe a difference in mortality in short‐term follow‐up of 1 year.
Findings describing an obesity paradox in stroke have been reported from single‐center studies,6, 8 clinical trials data,17, 18 and regional or national stroke registries.7, 19, 20 For long‐term mortality, with median follow‐up time ranging from 2.5 to 10 years, BMI 25 to 30 was associated with the best survival in many studies. Our results differ from other reports in that we did not find lower mortality with higher BMI beyond mild obesity.6, 7, 18, 19, 20 One reason may be that BMI data are frequently missing in studies of hospitalized patients, where weight is measured at the time of admission. Patients in whom BMI is missing have been shown to be older, with more severe strokes.9 The current study used a measurement of BMI assessed before the stroke, during routine examination, and hence is available for most participants. Many studies did not separate the analyses of ischemic and hemorrhagic stroke,9, 21 stroke types with distinct patterns of mortality.
To our knowledge, the only longitudinal study to previously examine weight status, prestroke weight loss, and poststroke mortality was the Honolulu‐Asia Aging Study of Japanese‐American males.12 This research found that prestroke weight loss, but not BMI, was associated with 30‐day and up to 8‐year poststroke mortality. Our study also used multiple prestroke BMI measurements and benefits from a broad distribution of participants stratified in the different weight categories. The ability to use objectively measured BMI in prospective studies, instead of self‐reported weight, reduces the risk of recall bias. We were able to perform analyses for a large proportion of overweight and obese participants, which may partially explain differences in our findings compared with the Honolulu study.
The mechanism by which increased weight is protective after stroke is not clear. In normal‐weight or underweight persons with stroke, outcomes may be worse due to less metabolic reserve for recovery, relative frailty, or a poor nutritional state.22 Obese patients, specifically, may have lower rates of smoking or may have some poorly understood physiologic or metabolic advantage. Ozeke et al proposed that obstructive sleep apnea, which is highly prevalent in both obesity and stroke, may be responsible for a form of ischemic preconditioning due to chronic intermittent hypoxia;23 obesity thus would be indirectly neuroprotective following an episode of acute ischemia‐reperfusion injury. Future research investigating underlying mechanisms for the obesity paradox might additionally explore the roles of adipocytokines, longitudinal macronutrient and caloric intake, or poststroke dietary choices. Weight gain, weight loss, physical activity, and caloric restriction effects can be studied in animal models, such as in overfed mice or stroke‐prone spontaneously hypertensive rats, for example.24, 25
Certain design aspects should be considered to explain the findings. Overweight or obese people may be more likely to be on medications to address risk factors or to have closer follow‐up with physicians due to their appearance. Overweight may also be more protective at certain ages. In our study, the association of overweight and improved survival was strongest in those with stroke younger than age 70, compared with controls. Towfighi et al reported different findings using data from NHANES, noting that obesity was significantly protective in the elderly.21 We found a similar trend in participants over age 70; however, the results were not significant.
Whereas the current study investigated survival after stroke, it is important to note that stroke incidence may still be higher among persons who are overweight or obese. Weight is an independent risk factor for stroke, and stroke is associated with higher mortality. In the population, mortality is higher among overweight and obese persons with stroke, even though the stroke case fatality rate may be lower when compared with normal‐weight persons. Our results should not be misinterpreted to indicate that obesity has an overall protective health effect with regard to population stroke mortality.
Our study had several strengths, including the completeness of data available on risk factors and comorbidities, minimal loss to follow‐up, and the analysis of a control cohort. The study also had limitations. Our study sample was underpowered to look at the effect of severe obesity, BMI ≥40. Our study may be underpowered to investigate the association of BMI with mortality after hemorrhagic stroke. We did not address the relationship between weight and recurrence of stroke or other cardiovascular disease. Our study population is predominantly white and of European descent, affecting the generalizability of the results.
Future studies in stroke patients can use other anthropometric measures, including waist‐hip ratio or sagittal abdominal diameter, use imaging measures of central or visceral adiposity, or determine obesity genetic risk scores to further reduce bias and reveal specific causative mechanisms underlying the association between body weight and reduced mortality.
Summary
We observed that overweight and mild obesity are associated with lower mortality after ischemic stroke, without similar effect in a matched control group. Whether increased weight has a direct role in conferring a survival advantage after stroke has yet to be determined. Future clinical studies using alternative measures of fat mass, research using obesity animal models, and studies of obesity genetic profiles can further our understanding of this paradoxical effect.
Sources of Funding
The FHS and research supported by the Boston University School of Medicine are funded by the National Heart, Lung, and Blood Institute (N01‐HC‐25195; HHSN268201500001I) and by grants from the National Institute of Neurological Disease and Stroke (R01NS017950). Aparicio is supported by grants from the National Institute of Aging (T32‐AG036697) and the American Heart Association (15GPSPG23770000).
Disclosures
None.
Supporting information
Table S1. Distributions of Ischemic Stroke Severity or Subtype by Composite BMI Category (18.5 to <25 or ≥25)
Table S2. Causes of 10‐Year Mortality for Ischemic Stroke Cases, All Stroke Cases, and Controls, by BMI Category
Table S3. Mortality by BMI or BMI Category Among All Stroke Cases and Controls, Model 1*
Table S4. Mortality by BMI or BMI Category Among Ischemic Stroke Cases and Controls, Model 2*
Table S5. Mortality by BMI or BMI Category Among Ischemic Stroke Cases and Controls, Excluding Participants With Weight Loss From the Normal Weight Group*
Table S6. Mortality by BMI or BMI Category Among All Stroke Cases and Controls, Excluding Participants With Weight Loss From the Normal Weight Group*
Table S7. One‐Year Mortality by BMI or BMI Category Among Ischemic Stroke Cases and Controls*
Figure S1. Selection of study participants; BMI indicates body mass index; FHS, Framingham Heart Study.
Acknowledgments
We are grateful to the FHS participants who have committed so much of their time and effort.
(J Am Heart Assoc. 2017;6:e004721 DOI: 10.1161/JAHA.116.004721.)28647687
Data from this article were published in abstract form at the American Academy of Neurology Annual Meeting, April 18 to 25, 2015, in Washington, DC.
References
- 1. Mozaffarian D, Benjamin EJ, Go AS, Arnett DK, Blaha MJ, Cushman M, de Ferranti S, Despres JP, Fullerton HJ, Howard VJ, Huffman MD, Judd SE, Kissela BM, Lackland DT, Lichtman JH, Lisabeth LD, Liu S, Mackey RH, Matchar DB, McGuire DK, Mohler ER III, Moy CS, Muntner P, Mussolino ME, Nasir K, Neumar RW, Nichol G, Palaniappan L, Pandey DK, Reeves MJ, Rodriguez CJ, Sorlie PD, Stein J, Towfighi A, Turan TN, Virani SS, Willey JZ, Woo D, Yeh RW, Turner MB; American Heart Association Statistics Committee and Stroke Statistics Subcommittee . Heart disease and stroke statistics–2015 update: a report from the American Heart Association. Circulation. 2015; 131:e29–e322. [DOI] [PubMed] [Google Scholar]
- 2. Carandang R, Seshadri S, Beiser A, Kelly‐Hayes M, Kase CS, Kannel WB, Wolf PA. Trends in incidence, lifetime risk, severity, and 30‐day mortality of stroke over the past 50 years. JAMA. 2006;296:2939–2946. [DOI] [PubMed] [Google Scholar]
- 3. Kurth T, Gaziano JM, Berger K, Kase CS, Rexrode KM, Cook NR, Buring JE, Manson JE. Body mass index and the risk of stroke in men. Arch Intern Med. 2002;162:2557–2562. [DOI] [PubMed] [Google Scholar]
- 4. Whitlock G, Lewington S, Sherliker P, Clarke R, Emberson J, Halsey J, Qizilbash N, Collins R, Peto R; Prospective Studies Collaboration . Body‐mass index and cause‐specific mortality in 900 000 adults: collaborative analyses of 57 prospective studies. Lancet. 2009;373:1083–1096. [DOI] [PMC free article] [PubMed] [Google Scholar]
- 5. Meschia JF, Bushnell C, Boden‐Albala B, Braun LT, Bravata DM, Chaturvedi S, Creager MA, Eckel RH, Elkind MS, Fornage M, Goldstein LB, Greenberg SM, Horvath SE, Iadecola C, Jauch EC, Moore WS, Wilson JA; AHA Stroke Council, Council on Cardiovascular and Stroke Nursing, Council on Clinical Cardiology, Council on Functional Genomics and Translational Biology, Council on Hypertension . Guidelines for the primary prevention of stroke: a statement for healthcare professionals from the American Heart Association/American Stroke Association. Stroke. 2014;45:3754–3832. [DOI] [PMC free article] [PubMed] [Google Scholar]
- 6. Vemmos K, Ntaios G, Spengos K, Savvari P, Vemmou A, Pappa T, Manios E, Georgiopoulos G, Alevizaki M. Association between obesity and mortality after acute first‐ever stroke: the obesity‐stroke paradox. Stroke. 2011;42:30–36. [DOI] [PubMed] [Google Scholar]
- 7. Kim BJ, Lee SH, Jung KH, Yu KH, Lee BC, Roh JK; for Korean Stroke Registry Investigators . Dynamics of obesity paradox after stroke, related to time from onset, age, and causes of death. Neurology. 2012; 79:856–863. [DOI] [PubMed] [Google Scholar]
- 8. Ryu WS, Lee SH, Kim CK, Kim BJ, Yoon BW. Body mass index, initial neurological severity and long‐term mortality in ischemic stroke. Cerebrovasc Dis. 2011;32:170–176. [DOI] [PubMed] [Google Scholar]
- 9. Dehlendorff C, Andersen KK, Olsen TS. Body mass index and death by stroke: no obesity paradox. JAMA Neurol. 2014;71:978–984. [DOI] [PubMed] [Google Scholar]
- 10. Horwich TB, Fonarow GC, Hamilton MA, MacLellan WR, Woo MA, Tillisch JH. The relationship between obesity and mortality in patients with heart failure. J Am Coll Cardiol. 2001;38:789–795. [DOI] [PubMed] [Google Scholar]
- 11. Romero‐Corral A, Montori VM, Somers VK, Korinek J, Thomas RJ, Allison TG, Mookadam F, Lopez‐Jimenez F. Association of bodyweight with total mortality and with cardiovascular events in coronary artery disease: a systematic review of cohort studies. Lancet. 2006;368:666–678. [DOI] [PubMed] [Google Scholar]
- 12. Bell CL, Rantanen T, Chen R, Davis J, Petrovitch H, Ross GW, Masaki K. Prestroke weight loss is associated with poststroke mortality among men in the Honolulu‐Asia Aging Study. Arch Phys Med Rehabil. 2014;95:472–479. [DOI] [PMC free article] [PubMed] [Google Scholar]
- 13. Stokes A, Preston SH. Smoking and reverse causation create an obesity paradox in cardiovascular disease. Obesity. 2015;23:2485–2490. [DOI] [PMC free article] [PubMed] [Google Scholar]
- 14. Seshadri S, Beiser A, Kelly‐Hayes M, Kase CS, Au R, Kannel WB, Wolf PA. The lifetime risk of stroke: estimates from the Framingham Study. Stroke. 2006;37:345–350. [DOI] [PubMed] [Google Scholar]
- 15. Abbott RD, McGee DL. Section 37. The probability of developing certain cardiovascular diseases in eight years at specified values of some characteristics In: Kannel WB, Wolf PA, and Gordon T, eds. The Framingham Study; An Epidemiological Investigation of Cardiovascular Disease. Bethesda, MD: US Department of Health, Education, and Welfare; 1987:5–15. NIH Publication No. 87‐2284. [Google Scholar]
- 16. Ivan CS, Seshadri S, Beiser A, Au R, Kase CS, Kelly‐Hayes M, Wolf PA. Dementia after stroke: the Framingham Study. Stroke. 2004;35:1264–1268. [DOI] [PubMed] [Google Scholar]
- 17. Ovbiagele B, Bath PM, Cotton D, Vinisko R, Diener HC. Obesity and recurrent vascular risk after a recent ischemic stroke. Stroke. 2011;42:3397–3402. [DOI] [PubMed] [Google Scholar]
- 18. Doehner W, Schenkel J, Anker SD, Springer J, Audebert HJ. Overweight and obesity are associated with improved survival, functional outcome, and stroke recurrence after acute stroke or transient ischaemic attack: observations from the TEMPiS trial. Eur Heart J. 2013;34:268–277. [DOI] [PubMed] [Google Scholar]
- 19. Skolarus LE, Sanchez BN, Levine DA, Baek J, Kerber KA, Morgenstern LB, Smith MA, Lisabeth LD. Association of body mass index and mortality after acute ischemic stroke. Circ Cardiovasc Qual Outcomes. 2014;7:64–69. [DOI] [PMC free article] [PubMed] [Google Scholar]
- 20. Olsen TS, Dehlendorff C, Petersen HG, Andersen KK. Body mass index and poststroke mortality. Neuroepidemiology. 2008;30:93–100. [DOI] [PubMed] [Google Scholar]
- 21. Towfighi A, Ovbiagele B. The impact of body mass index on mortality after stroke. Stroke. 2009;40:2704–2708. [DOI] [PubMed] [Google Scholar]
- 22. FOOD Trial Collaboration . Poor nutritional status on admission predicts poor outcomes after stroke: observational data from the FOOD trial. Stroke. 2003;34:1450–1456. [DOI] [PubMed] [Google Scholar]
- 23. Ozeke O, Ozer C, Gungor M, Celenk MK, Dincer H, Ilicin G. Chronic intermittent hypoxia caused by obstructive sleep apnea may play an important role in explaining the morbidity‐mortality paradox of obesity. Med Hypotheses. 2011;76:61–63. [DOI] [PubMed] [Google Scholar]
- 24. Sfrantzis KD, How JM, Sartor DM. Implications of diet modification on sympathoinhibitory mechanisms and hypertension in obesity. Auton Neurosci. 2015;189:25–30. [DOI] [PubMed] [Google Scholar]
- 25. Okuyama H, Ohara N, Tatematsu K, Fuma S, Nonogaki T, Yamada K, Ichikawa Y, Miyazawa D, Yasui Y, Honma S. Testosterone‐lowering activity of canola and hydrogenated soybean oil in the stroke‐prone spontaneously hypertensive rat. J Toxicol Sci. 2010;35:743–747. [DOI] [PubMed] [Google Scholar]
Associated Data
This section collects any data citations, data availability statements, or supplementary materials included in this article.
Supplementary Materials
Table S1. Distributions of Ischemic Stroke Severity or Subtype by Composite BMI Category (18.5 to <25 or ≥25)
Table S2. Causes of 10‐Year Mortality for Ischemic Stroke Cases, All Stroke Cases, and Controls, by BMI Category
Table S3. Mortality by BMI or BMI Category Among All Stroke Cases and Controls, Model 1*
Table S4. Mortality by BMI or BMI Category Among Ischemic Stroke Cases and Controls, Model 2*
Table S5. Mortality by BMI or BMI Category Among Ischemic Stroke Cases and Controls, Excluding Participants With Weight Loss From the Normal Weight Group*
Table S6. Mortality by BMI or BMI Category Among All Stroke Cases and Controls, Excluding Participants With Weight Loss From the Normal Weight Group*
Table S7. One‐Year Mortality by BMI or BMI Category Among Ischemic Stroke Cases and Controls*
Figure S1. Selection of study participants; BMI indicates body mass index; FHS, Framingham Heart Study.