

Abstract
Background
Cryoballoon‐based pulmonary vein isolation (CB‐PVI) has been widely used for the treatment of atrial fibrillation. Although generally safe and effective, the procedure may be associated with pulmonary vein (PV) stenosis and bronchial or esophageal injury. The mechanisms leading to these complications have not been studied in detail. Our aim was to examine acute effects of cryoballoon on the pulmonary vessel and right heart pressures as well as PV wall morphology.
Methods and Results
In 8 patients (5 men, mean age 55±14 years) undergoing CB‐PVI, pressure in each PV was measured by catheter located inside the PV directly before and after CB‐PVI. The right atrial, right ventricular, and pulmonary artery pressures as well as pulmonary arterial wedge capillary pressure in the pulmonary artery branch corresponding to target PV were also measured. Morphological changes in PVs were assessed using intravascular ultrasonography.
There were no significant differences in PV pressures before and after ablation. The pulmonary arterial wedge capillary pressure significantly increased during cryoapplication (left superior: 20±10 versus 29±8.5 mm Hg, P=0.004; left inferior: 24±10 versus 32±6 mm Hg, P=0.012; right superior: 25±9 versus 35±10 mm Hg, P=0.002; right inferior: 24±10 versus 37±12 mm Hg, P=0.0036). The right atrial and pulmonary artery pressures increased significantly after CB‐PVI (9±6 versus 13±8 mm Hg, P=0.004, and 20±9 versus 24±10 mm Hg, P=0.048, respectively). Intravascular ultrasonography showed acute edema and dissection‐like changes causing relative lumen narrowing in 90% of PVs.
Conclusions
CB‐PVI causes significant rise in pulmonary artery and right atrial pressures as well as PV wall damage. The clinical significance of these findings warrants further investigations.
Keywords: atrial fibrillation, collateral damage, cryoballoon ablation
Subject Categories: Arrhythmias, Electrophysiology, Clinical Studies, Ultrasound
Clinical Perspective
What Is New?
This study shows that cryoenergy causes significant elevation of right heart pressures and damage to the inner surface of pulmonary veins as deep as 3 to 4 cm from the pulmonary vein ostium.
What Are the Clinical Implications?
These findings stress the importance of positioning the cryoballoon as close to the pulmonary vein ostium as possible and avoiding very low temperatures during cryoenergy delivery.
Introduction
Cryoballoon‐based pulmonary vein isolation (CB‐PVI) has been widely used for the treatment of atrial fibrillation (AF). Recent randomized clinical studies1 and meta‐analyses2 showed comparable outcomes for CB‐PVI and standard radiofrequency PVI; however, both procedures are associated with the risk of complications. Right phrenic nerve palsy occurs almost exclusively following CB‐PVI.3 The potential benefit of CB‐PVI in reduction of esophageal injury compared with radiofrequency energy has not been confirmed.4 In addition, CB‐PVI may be also associated with such complications as pulmonary vein (PV) stenosis,5 hemoptysis,6 or bronchial injury.7, 8 The PV stenosis may be operator dependent in part when a cryoballoon is located too distally in the PV ostium,9 whereas hemoptysis and bronchial injury are rather anatomy dependent, given the close proximity of the bronchi and PV ostium. Other mechanisms may be responsible for some of these complications, including acute elevation of pulmonary and right heart pressures during and shortly after CB‐PVI; however, there are no reports concerning this topic.
Possible morphological changes inside the PV following CB‐PVI have not been studied. Some reports have suggested that cryoenergy is delivered more deeply inside the PV than it should be as a result of too distal cryoballoon positioning in the PV, necessitated by the size and anatomy of the PV ostium.10 In addition, the formation of ice inside the PV during cryoenergy application may cause inadvertent damage to the PV wall and collateral tissue.11 We hypothesized that the morphology and diameter of the PV wall may be accurately imaged by intravascular ultrasonography (IVUS), which has not yet been used for this purpose. This technique perfectly displays longitudinal diameter vessel anatomy and, in the case of the PV, may visualize muscle sleeves located in the PV that are an ablation target.12, 13
Accordingly, the aim of our study was to examine whether acute blockade of the PV ostium during CB‐PVI is associated with elevation of pulmonary arterial wedge capillary pressure (PAWCP) and may cause right heart‐chamber pressure elevation. Our second aim was to assess morphologic changes in the PV wall caused by CB‐PVI.
Methods
The IVUS‐Cryo study was a prospective single center study that was designed to evaluate acute and hemodynamic and morphologic changes occurring during and immediately after CB‐PVI (local ethics committee approval 10.06.2015). Recruitment started in August 2016 and ended in November 2016.
Patients
The study group consisted of 8 consecutive patients undergoing standard CB‐PVI (5 men, mean age 55±14 years; all paroxysmal AF). All patients gave written informed consent to participate in the study. One day before ablation, all patients underwent cardiac computed tomography to assess left atrial (LA) anatomy and transesophageal echocardiography to exclude LA appendage thrombus.
Ablation
CB‐PVI was conducted in the standard manner. Briefly, after injection of local anesthetic, both femoral veins were punctured. One long sheath (8.5‐F Swartz; St Jude Medical, St Paul, MN) to cross the interatrial septum and 1 short sheath for pulmonary artery (PA) pressure measurement were inserted in the right femoral vein. Another short sheath for a diagnostic decapolar catheter (Dynamic XT; Boston Scientific, Marlborough, MA), placed in the right atrium, was inserted in the left femoral vein. The intracardiac echocardiographic probe (8‐ or 10‐Fr Acuson AcuNav; Siemens, Berlin, Germany) was introduced via the nasal route to the esophagus to assist transseptal puncture.14 After crossing the septum and introducing a guidewire into the left superior pulmonary vein (LSPV), the long sheath was replaced with a steerable sheath (14‐F FlexCath; Medtronic, Minneapolis, MN), and a cryoballoon (28 mm, second generation) was introduced into the left atrium. Next, the Achieve mapping catheter (20 mm diameter; Medtronic) was placed in the LSPV ostium, cryoballoon inflated and contrast injected to confirm proper occlusion of LSPV. When PVI was achieved during the first inflation and confirmed by the disappearance of PV potentials within 60 seconds by recordings from the Achieve catheter, no second cryoapplication was performed. In case of incomplete occlusion, persistence or very late disappearance of PV potentials, suboptimal temperatures achieved (warmer than −36°C) or very short thawing time, the cryoballoon was repositioned and another cryoapplication was delivered. Next, CB‐PVI of the left inferior pulmonary vein (LIPV), right superior pulmonary vein (RSPV), and right inferior pulmonary vein (RIPV) was performed. No adenosine testing for persistence of PV potentials was performed.
PV Pressure Assessment
All examinations were conducted using a diagnostic 5‐F catheter (Angiosin; B. Braun, Berlin, Germany) connected to a pressure transducer. Numerical values were displayed using an electrophysiological system (Labsystem Pro EP; Boston Scientific). The diagnostic catheter was introduced into the left atrium using a steerable sheath and then moved over the wire (Whisper; Abbott Laboratories, Abbott Park, IL) to the target location: the medial branch of the PV, usually 3 to 4 cm from the PV ostium. Care was taken to obtain measurements from exactly the same location before and after ablation. The preablation pressure measurements were taken starting in the LSPV, followed by LIPV, RSPV, and RIPV. Calibration was performed according to standard procedures. The mean and systolic pressure data were collected when they remained stable for at least 30 seconds. After completing PVI, pressure measurements were repeated in the same order as before ablation.
PA Pressure Assessment
The 5‐F diagnostic catheter was introduced via the right femoral vein first into the right atrium and then redirected to the right ventricle and the PA trunk. The PAWCP was measured in the PA branch corresponding to the PV where ablation was applied. The measurements were taken before balloon inflation, during cryoablation, and after balloon deflation when they remained stable for at least 30 seconds.
Original recordings of PAWCP and fluoroscopic images showing the placement of ablation tools as well as catheters for pressure measurements are presented in Figure 1.
Figure 1.
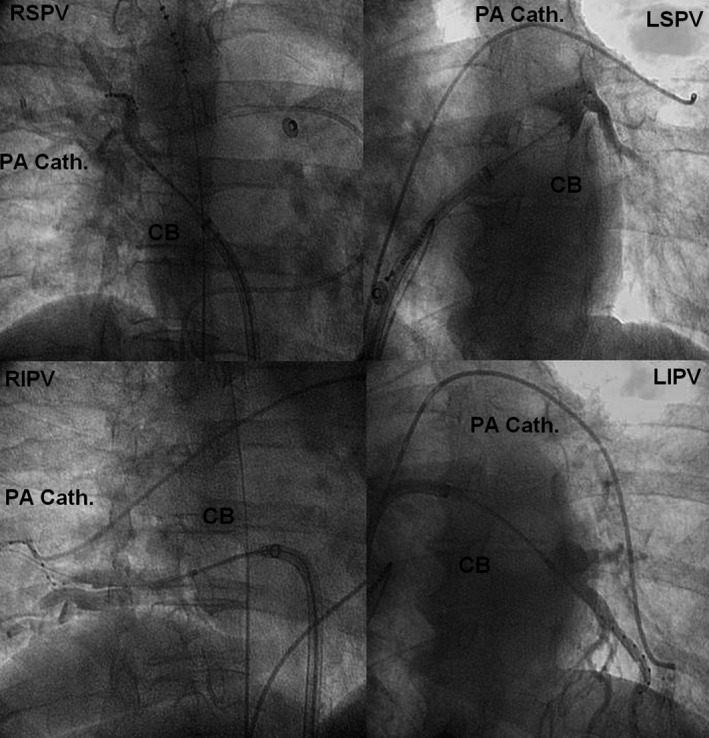
Fluoroscopic images showing the placement of the inflated cryoballoon in each pulmonary vein ostium and contrast trapped in the vein as well as catheters for pressure measurements located in corresponding pulmonary artery branch. CB indicates cryoballoon; LIPV, left inferior pulmonary vein; LSPV, left superior pulmonary vein; PA Cath, pulmonary artery catheter; RIPV, right inferior pulmonary vein; RSPV, right superior pulmonary vein.
IVUS Examination of the PV
An IVUS catheter (Eagle Eye Platinum; Volcano, San Diego, CA) with maximum ultrasonic detection depth of 20 mm was mounted on a guidewire (0.014‐in percutaneous transluminal coronary angioplasty guidewire) and advanced under fluoroscopic guidance into each PV. The IVUS probe was advanced distally into the PV where automatic pullback (1 mm/s) was performed to determine the extent of PV branching and to identify atrial tissue within each vein. The recording was stopped at the level where the PV ostium was identified using both IVUS and fluoroscopy. Digital commentary was performed during pullback of the IVUS catheter. The distance covered during the pullback maneuver and the minimal and maximal vessel diameter and circumference values were measured. All PV were imaged twice, before and after ablation, and analyzed offline by 2 operators. Care was taken to obtain visualization from exactly the same location before and after ablation. The morphologic changes of the PV wall were analyzed and categorized as edema and dissection‐like changes. The PV diameter and lumen were measured. The PV area and relative narrowing of vein area, defined as percentage of vein area covered by edema at the spot where the first morphologic change was noticed, were also computed.
Statistical Analysis
Results are presented as mean±SD or median or as numbers and percentages. The quantitative variables were compared using the Student t test, and qualitative parameters were compared using the Fisher exact test. The calculation was performed in Excel 2010 software with the Analysis ToolPak (Microsoft, Redmond, WA). P<0.05 was considered significant.
Results
All ablation procedures were uneventful. The mean duration of PVI with PA pressure measurement was 123±18 minutes. All 32 PVs were isolated. There were no significant differences between duration of cryoapplication between the PVs. Thawing time was longest in the LSPV and shortest in the RIPV (43±15 versus 24±13 seconds, P=0.014). The mean lowest temperature was achieved in the RSPV, whereas the highest negative temperature was measured in the LIPV (−45±4°C versus −42±4°C, P=0.014; Table 1).
Table 1.
Procedural Details
| Application Time (S) | Number of Applications (Mean and Range) | Average Temperature (Celsius) | Thawing Time (S) | |
|---|---|---|---|---|
| LSPV | 420±246 | 2 (1–4) | −43±5 | 43±15 |
| LIPV | 253±32 | 1.2 (1–2) | −41±6.5 | 37±17 |
| RSPV | 290±96 | 1.2 (1–2) | −45±4 | 40±10 |
| RIPV | 305±97 | 1.2 (1–2) | −42±4 | 24±13 |
LIPV indicates left inferior pulmonary vein; LSPV, left superior pulmonary vein; RIPV, right inferior pulmonary vein; RSPV, right superior pulmonary vein.
LA and PV Pressures
The systolic and mean pressures in all 32 PVs were measured. Following CB‐PVI, pressures in PVs increased; however, differences did not reach significance (Table 2).
Table 2.
Pre‐ and Postablation Pressure Values
| Preablation (mm Hg) | Postablation (mm Hg) | P Value | |
|---|---|---|---|
| LA pressure | 14.5±5 | 16±9.5 | 0.368 |
| LSPV systolic | 20±10 | 24±8.5 | 0.072 |
| LSPV mean | 14.3±5 | 14.7±5.5 | 0.399 |
| LIPV systolic | 19.1±10 | 23±10 | 0.176 |
| LIPV mean | 12.5±8 | 18±10 | 0.065 |
| RSPV systolic | 23.6±9 | 24±13 | 0.458 |
| RSPV mean | 14.2±5 | 13.1±7 | 0.331 |
| RIPV systolic | 16.7±7 | 23.1±10 | 0.078 |
| RIPV mean | 13.4±4 | 16±6.5 | 0.086 |
| RA systolic | 14.8±9 | 19.7±10 | 0.015a |
| RA mean | 9±6 | 13±8 | 0.004a |
| RV systolic | 24.6±7 | 33.1±11 | 0.086 |
| RV mean | 14±4.5 | 19.5±10 | 0.129 |
| PA systolic | 26.1±10.5 | 34.1±14 | 0.047a |
| PA mean | 20±9 | 24±10 | 0.048a |
LA indicates left atrium; LIPV, left inferior pulmonary vein; LSPV, left superior pulmonary vein; PA, pulmonary artery; RA, right atrium; RIPV, right inferior pulmonary vein; RSPV, right superior pulmonary vein; RV, right ventricle.
p<0.05.
Right Atrial, Right Ventricle, and PA Pressures
The mean values of right atrial and PA pressures increased significantly after CB‐PVI (9±6 versus 13±8 mm Hg, P=0.004, and 20±9 versus 24±10 mm Hg, P=0.048, respectively), whereas elevation in the right ventricle pressure did not reach significance (14±4.5 versus 19.5±10 mm Hg, P=0.129; Table 2). Individual data are presented in Figure 2.
Figure 2.
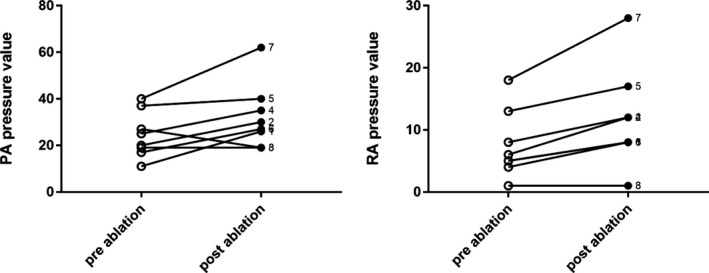
Cryoablation‐induced changes of RA and PA pressures (mm Hg in individual patients). PA indicates pulmonary artery; RA, right atrial.
Segmental PA Pressures
The PAWCP in the PA branches corresponding to a PV that was ablated significantly increased during cryoapplication in all PVs. After cryoballoon deflation, these values returned to baseline values only in the LIPV, whereas in the LSPV, RSPV and RIPV, they remained elevated compared with baseline values (difference in the RIPV was significant; Table 3).
Table 3.
Pressure Values in the Pulmonary Artery Branches Corresponding to Target PV Measured Before, During, and After Cryoapplication
| Ablated PV | PA Pressure Preablation (mm Hg) | PA Pressure Postablation (mm Hg) | P Valuea | PA Pressure During Ablation (mm Hg) | P Valueb |
|---|---|---|---|---|---|
| LSPV | 20±10 | 24±11 | 0.019 | 29±8.5 | 0.004c |
| LIPV | 24±10 | 24±9 | 0.459 | 32±6 | 0.013c |
| RSPV | 24.5±9 | 29±11 | 0.055 | 35±10 | 0.002c |
| RIPV | 24±10 | 29.2±13 | 0.032c | 37±12 | 0.004c |
LIPV indicates left inferior pulmonary vein; LSPV, left superior pulmonary vein; PA, pulmonary artery; PV, pulmonary vein; RIPV, right inferior pulmonary vein; RSPV, right superior pulmonary vein.
Difference between pre‐ and postablation values.
Difference between pre‐ and during ablation values.
p<0.05.
IVUS Parameters
All details are presented in Table 4. Before ablation, muscle sleeves were identified in 17 veins (53%), with the highest percentage of 62.5% in the LIPV. After ablation, images resembling edema (Figure 3, Videos S1 and S2) and dissection‐like changes as far as 3 cm from the PV ostium were found in 32 PVs (90%; Figure 4). Dissection‐like changes at the PV ostium level were most frequently visualized in the LSPV, LIPV, and RIPV (up to 88%) and least frequently in the RSPV (71%). Edema was visualized in all left PVs, in 88% of RIPVs, and in 72% of RSPVs. We also recorded changes in each vein area, before and after cryoablation, at the first most distal spot where the morphologic changes occurred (LSPV: 40±24 versus 53±30 mm2, P=0.44; LIPV: 37±15.5 versus 46±26 mm2, P=0.54; RSPV: 29±17 versus 56±32 mm2, P=0.11; RIPV: 27±3 versus 61±46 mm2, P=0.22). The most distal changes were recorded in the LSPV as far as 35±18 mm from the ostium, followed by LIPV, RIPV, and RSPV, where this distance was 13±11 mm. The dissection‐like morphology changes were recorded in 12 PVs (38%) distally from ostium. In the LSPV, it was present as far as 26±20 mm from the ostium, whereas in the RSPV, it was visualized 8.7±8.8 mm from the PV ostium.
Table 4.
The Intravascular Ultrasonography Parameters Obtained in PVs Before and After Ablation
| LSPV | LIPV | RSPV | RIPV | |
|---|---|---|---|---|
| Distance from PV ostium to the distal part of muscle sleeve, mm (mean/median) | 9.3±1.75 | 7.5±3 | 6.9±5.3 | 2.3±2 |
| Diameter of the muscle sleeves, mm (mean/median) | 0.825±0.6 | 1.3±1 | 0.38±0.08 | 0.52±0.05 |
| Distance of measurement in the vein after cryoablation, mm (mean/SD) | 71.25±22 | 64±27 | 62.75±21 | 68±27 |
| Distance from first visualized morphological change (edema and/or dissection) inside PV to PV ostium, mm (mean/SD) | 35±18 | 26±4.7 | 13±11 | 15±13 |
| Area of the ostium before cryoablation, mm2 (mean/SD) | 136.4±19.8 | 113±30 | 114±13 | 79±45 |
| Area of the ostium after cryoablation, mm (mean/SD) | 135±38 | 104±26 | 135±34 | 131±35 |
| Area of the vein at the level of first recorded morphologic change before cryoablation, mm2 (mean/SD) | 40±24 | 37±15.5 | 29±17 | 27±3 |
| Area of the vein at the level of first recorded morphologic change after cryoablation, mm2 (mean/SD) | 53±30 | 46±26 | 56±32 | 61±46 |
| Relative vein narrowing at the level of first recorded morphologic change (%) | 32 | 37 | 22 | 26 |
| Diameter of edema at the level of first recorded morphologic change, mm (mean/SD) | 2.1±0.1 | 2.7±1.7 | 2.2±1.6 | 2.1±1.6 |
| Existence of dissection at the morphological change spot (%) | 50 | 50 | 75 | 43 |
| Distance from first dissection spot to PV ostium, mm (mean/SD) | 26±20 | 18±10 | 8.7±8.8, median 7.5 | 13.1±11.1 |
| Diameter of edema/intramural hematoma in the ostium level, mm (mean/SD) | 3.8±1.5 | 4±1.8 | 2.5±1.8 | 5.4±6.2, median 3.65 |
| Existence of dissection‐like event in the PV ostium level (%) | 87.5 | 88 | 71 | 88 |
| Existence of edema in the PV ostium level (%) | 100 | 100 | 72 | 88 |
LIPV indicates left inferior pulmonary vein; LSPV, left superior pulmonary vein; PV, pulmonary vein; RIPV, right inferior pulmonary vein; RSPV, right superior pulmonary vein.
Figure 3.
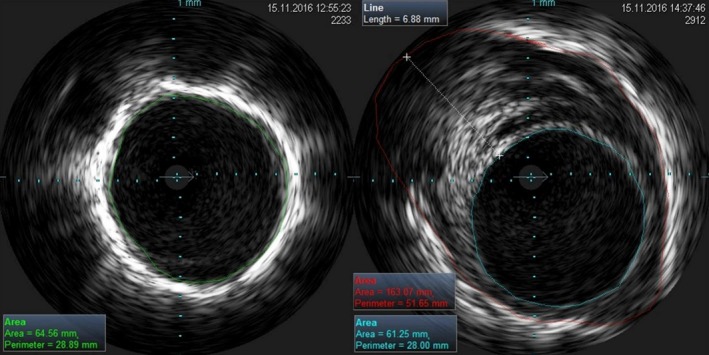
Visualization with intravascular ultrasonography of the inner vein lumen before cryoablation (left panel) and after balloon deflation (right panel). The area of edema with a diameter of 6.88 mm is visible as well as the relative area lumen reduction.
Figure 4.
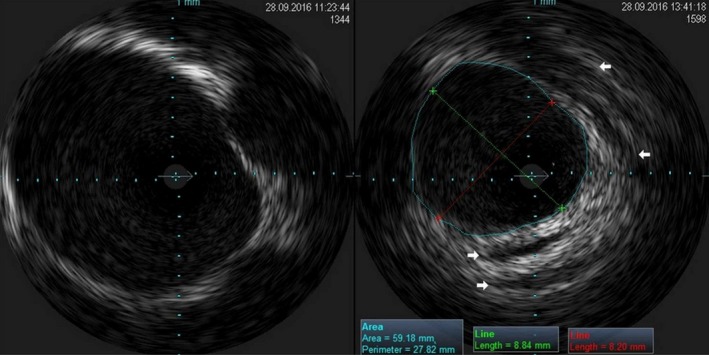
Visualization with intravascular ultrasonography of the inner vein lumen before cryoablation (left panel) and after balloon deflation (right panel). The white arrows mark area of dissection‐like morphologic changes in the PV wall. The PV wall edema may also be noticed. PV, pulmonary vein.
Discussion
To our knowledge, this study is the first to examine the effects of CB‐PVI on pulmonary vessel and right heart pressures as well as PV wall morphology. The key findings of our study are as follows: (1) PAWCP elevation is a direct reaction to the cryoballoon occlusion of PV; (2) PAWCP remained significantly elevated up to 20 minutes after cryoballoon deflation in the RIPV; (3) right heart pressure is affected by CB‐PVI; (4) there is no elevation of the LA pressure, thus right heart pressure increase is not due to LA changes; and (5) the PV wall is affected by low‐temperature blood far more distal than just at the ostium.
Previous studies regarding ablation for AF and effects on pulmonary pressure dealt only with radiofrequency ablation. Witt et al15 found that ≈8% of patients developed an increase in PA pressure after AF ablation; however, they measured pressures indirectly using echocardiography and not direct catheterization. They also suggested that one of the mechanisms was the development or unmasking of left ventricular diastolic dysfunction. Others speculated16 that multiple mechanisms may cause elevated pulmonary pressures. These include the involvement of the lungs due to PV stenosis,17 PV occlusion, and, rarely, pulmonary embolism.18 Radiofrequency catheter ablation can also lead to scarring of the atrium, which can cause LA diastolic dysfunction, known as LA stiffness, leading to elevated pulmonary pressures.19 One study evaluated cryoballoon‐related scar in the left atrium and found that only ≈27% of the posterior wall remained unablated.20 Consequently, the phenomenon of LA stiffness may be as frequent in CB‐PVI as in radiofrequency ablation.
Nevertheless, LA scarring cannot be responsible for the findings of our study. All measurements were taken online during cryoballoon inflation and showed immediate pressure changes. We assume that pulmonary capillaries were affected both functionally and structurally by increased transmural pressure caused by blood trapped in the PV due to cryoballoon occlusion and ice formation in the PV. Moreover, we think that cryoenergy is delivered deeper inside the PV than it should be and not only perpendicular to the PV toward the esophagus or bronchi but also parallel toward the distal PV. This is mainly caused by low temperature transmitted through cooled or frozen blood blocked in the PV. Further physiological studies are warranted to confirm our speculations. In addition, we found that pressures in the right heart remained elevated after CB‐PVI, even when LA pressure was relatively normal. This is another reason to consider pulmonary capillaries as the origin of PA pressure elevation.
IVUS provides in vivo visualization of the morphology and motility of small intraluminal structures that cannot be revealed by traditional diagnostic methods21 and may reveal intraluminal or mural details that are undetected with venography. Moreover, IVUS is the most precise imaging method for measuring the inner diameters of vessels.22 In the literature, there are descriptions of morphologic changes recorded in PVs as wall thickening due to thrombosis, periphlebitic edema, or frozen valves. In anatomic human specimens, wall thickening in the PV was demonstrated as muscle sleeves infiltrating the PV from the left atrium.12
Using IVUS, we found 2 main types of morphologic changes caused by CB‐PVI. One is the intravein edema that is seen as hypoechogenic abnormal tissue after ablation and is not present before CB‐PVI. The second finding is formation of dissection‐like space inside the edema that is seen in IVUS as black and anechoic space. To date, no pathomorphologic examination of these changes has been performed; therefore, we are not able to confirm that our findings represent true vein dissection.
At sites where the first morphologic change was observed, vein area was increased. Despite the fact that edema decreased relative vein area, true PV lumen increased. This may be the effect of elevation of blood pressure in a blocked vein when a new portion of blood was flowing from the PA. It also may be speculated that low temperature might “paralyze” the PV wall, and in this way, PV distension occurred.
In summary, the results of IVUS examinations suggest that cryoenergy affects not only the ostium of PVs but reaches far deeper inside PVs (3–4 cm), probably by cooling effects of frozen blood trapped in the PV during cryoapplication.
Our findings may have important clinical implications. The CB‐PVI is a rapidly expanding method for AF ablation because, being a single‐shot device, is much easier to use than point‐by‐point radiofrequency ablation. Already, >220 000 CB‐PVI procedures have been performed all over the world (Medtronic data, unpublished commercial data); therefore, the safety issue is of utmost importance. Although recent studies showed that the efficacy and safety of CB‐PVI is similar to that of radiofrequency ablation, the follow‐up duration rarely exceeds 2 or 3 years. In contrast, recent reports suggested new complications of CB‐PVI such as PV stenosis and bronchial and esophageal injury.23, 24, 25 Consequently, we believe that further research on the mechanisms of CB‐PVI and longer follow‐up are needed. Other issues such as whether we should exclude from CB‐PVI patients with a history of pulmonary embolism or chronic obstructive pulmonary disease should also be addressed.
Limitations
The study group was very small, and the study is only hypothesis generating. It was not possible to measure PV pressures during cryoapplication, but this could give additional important data. No long‐term follow‐up data are available; therefore, the clinical significance of our findings is unclear. PAWCP in the right lower lung PA segment stayed elevated longer after CB‐PVI than in other locations, which may be explained in part by the fact that the measurements in this artery were always taken after all veins were ablated. Consequently, all post–CB‐PVI changes of pulmonary capillaries in the left lung and superior and middle lobe in the right lung might affected measurements.
Conclusions
CB‐PVI causes unexpectedly high transient rises in PA and right atrial pressures. Cryoenergy affects the PV wall, resulting in acute edema or dissection‐like changes as far as 3 to 4 cm from the PV ostium. Whether these findings are of clinical significance has to be examined in larger studies.
Sources of Funding
This study was funded by the Polish Society of Cardiology research grant for young investigators (“Grant Klubu 30”) and by support from Volcano Europe BVBA/SPRL for supply and use of the IVUS system free of charge.
Disclosures
Baran and Kulakowski attended as proctor in learning sessions supported by Medtronic Company. The remaining authors have no disclosures to report.
Supporting information
Video S1. Intra‐vein visualization with IVUS before cryoballoon ablation.
Video S2. Intra‐vein visualization with IVUS after cryoballoon ablation. Areas of intramural hematoma and intra‐vein edema is displayed.
(J Am Heart Assoc. 2017;6:e005988 DOI: 10.1161/JAHA.117.005988.)28649087
References
- 1. Kuck KH, Brugada J, Fürnkranz A, Metzner A, Ouyang F, Chun KR, Elvan A, Arentz T, Bestehorn K, Pocock SJ, Albenque JP, Tondo C. Cryoballoon or radiofrequency ablation for paroxysmal atrial fibrillation. N Engl J Med. 2016;374:2235–2245. [DOI] [PubMed] [Google Scholar]
- 2. Buiatti A, von Olshausen G, Barthel P, Schneider S, Luik A, Kaess B, Laugwitz KL, Hoppmann P. Cryoballoon vs. radiofrequency ablation for paroxysmal atrial fibrillation: an updated meta‐analysis of randomized and observational studies. Europace. 2016;19:378–384. pii: euw262. [DOI] [PubMed] [Google Scholar]
- 3. Mugnai G, de Asmundis C, Ciconte G, Irfan G, Saitoh Y, Velagic V, Ströker E, Wauters K, Hünük B, Brugada P, Chierchia GB. Incidence and characteristics of complications in the setting of second‐generation cryoballoon ablation: a large single‐center study of 500 consecutive patients. Heart Rhythm. 2015;12:1476–1482. [DOI] [PubMed] [Google Scholar]
- 4. Barbhaiya CR, Kumar S, John RM, Tedrow UB, Koplan BA, Epstein LM, Stevenson WG, Michaud GF. Global survey of esophageal injury in atrial fibrillation ablation. J Am Coll Cardiol. 2015;65:1377–1378. [DOI] [PubMed] [Google Scholar]
- 5. Thomas D, Katus HA, Voss F. Asymptomatic pulmonary vein stenosis after cryoballoon catheter ablation of paroxysmal atrial fibrillation. J Electrocardiol. 2011;44:473–486. [DOI] [PubMed] [Google Scholar]
- 6. Martí‐Almor J, Jauregui‐Abularach ME, Benito B, Vallès E, Bazan V, Sánchez‐Font A, Vollmer I, Altaba C, Guijo MA, Hervas M, Bruguera‐Cortada J. Pulmonary hemorrhage after cryoballoon ablation for pulmonary vein isolation in the treatment of atrial fibrillation. Chest. 2014;145:156. [DOI] [PubMed] [Google Scholar]
- 7. Aryana A, Bowers MR, Hayatdavoudi SM, Zhang Y, Afify A, D'Avila A, O'Neill PG. Impact of pulmonary vein cryoballoon ablation on bronchial injury. J Cardiovasc Electrophysiol. 2016;27:861–867. [DOI] [PubMed] [Google Scholar]
- 8. Verma N, Gillespie CT, Argento AC, Tomson T, Dandamudi S, Piña P, Ringwala S, Lin AC, Chicos AB, Kim S, Arora R, Passman RS, Knight BP. Bronchial effects of cryoballoon ablation for atrial fibrillation. Heart Rhythm. 2017;14:12–16. [DOI] [PubMed] [Google Scholar]
- 9. Kasper Ł, Gross‐Sondej I, Machalica B, Soja J, Pawlik W, Sładek K. Hemoptysis and lung disease as a manifestation of pulmonary vein stenosis after cryoballoon catheter ablation for atrial fibrillation. Pol Arch Med Wewn. 2016;126:94–96. [PubMed] [Google Scholar]
- 10. van Opstal JM, Timmermans C, Blaauw Y, Pison L. Bronchial erosion and hemoptysis after pulmonary vein isolation by cryoballoon ablation. Heart Rhythm. 2011;8:1459. [DOI] [PubMed] [Google Scholar]
- 11. Baran J, Lewandowski P, Piotrowski R, Kulakowski P. Cryoballoon ablation for atrial fibrillation—is cryoenergy applied only to the pulmonary vein ostium? Clin Respir J. 2016; DOI: 10.1111/crj.12466. Available at: http://onlinelibrary.wiley.com/wol1/doi/10.1111/crj.12466/full. Accessed June 8, 2017. [DOI] [PubMed] [Google Scholar]
- 12. Guerra PG, Thibault B, Dubuc M, Talajic M, Roy D, Crépeau J, Nattel S, Tardif JC. Identification of atrial tissue in pulmonary veins using intravascular ultrasound. J Am Soc Echocardiogr. 2003;16:982–987. [DOI] [PubMed] [Google Scholar]
- 13. Cabrera JA, Sánchez‐Quintana D, Farré J, Navarro F, Rubio JM, Cabestrero F, Anderson RH, Ho SY. Ultrasonic characterization of the pulmonary venous wall: echographic and histological correlation. Circulation. 2002;106:968–973. [DOI] [PubMed] [Google Scholar]
- 14. Mitchell‐Heggs L, Lim P, Bensaid A, Kloeckner M, Monin JL, Castanie JB, Hosseini H, Nahum J, Teiger E, Dubois‐Randé JL, Gueret P. Usefulness of trans‐oesophageal echocardiography using intracardiac echography probe in guiding patent foramen ovale percutaneous closure. Eur J Echocardiogr. 2010;11:394–400. [DOI] [PubMed] [Google Scholar]
- 15. Witt CM, Fenstad ER, Cha YM, Kane GC, Kushwaha SS, Hodge DO, Asirvatham SJ, Oh JK, Packer DL, Powell BD. Increase in pulmonary arterial pressure after atrial fibrillation ablation: incidence and associated findings. J Interv Card Electrophysiol. 2014;40:47–52. [DOI] [PubMed] [Google Scholar]
- 16. Verma I, Tripathi H, Sikachi RR, Agrawal A. Pulmonary hypertension due to radiofrequency catheter ablation (RFCA) for atrial fibrillation: the lungs, the atrium or the ventricle? Heart Lung Circ. 2016;25:1177–1183. [DOI] [PubMed] [Google Scholar]
- 17. De Greef Y, Tavernier R, Raeymaeckers S, Schwagten B, Desurgeloose D, De Keulenaer G, Stockman D, De Buyzere M, Duytschaever M. Prevalence, characteristics, and predictors of pulmonary vein narrowing after isolation using the pulmonary vein ablation catheter. Circ Arrhythm Electrophysiol. 2012;5:52–60. [DOI] [PubMed] [Google Scholar]
- 18. Li YC, Lin J, Wu L, Li J, Chen P, Guang XQ. Clinical features of acute massive pulmonary embolism complicated by radiofrequency ablation: an observational study. Medicine (Baltimore). 2015;94:e1711. [DOI] [PMC free article] [PubMed] [Google Scholar]
- 19. Jeevanantham V, Ntim W, Navaneethan SD, Shah S, Johnson AC, Hall B, Shah A, Hundley WG, Daubert JP, Fitzgerald D. Meta‐analysis of the effect of radiofrequency catheter ablation on left atrial size, volumes and function in patients with atrial fibrillation. Am J Cardiol. 2010;105:1317–1326. [DOI] [PubMed] [Google Scholar]
- 20. Kenigsberg DN, Martin N, Lim HW, Kowalski M, Ellenbogen KA. Quantification of the cryoablation zone demarcated by pre‐ and postprocedural electroanatomic mapping in patients with atrial fibrillation using the 28‐mm second‐generation cryoballoon. Heart Rhythm. 2015;12:283–290. [DOI] [PubMed] [Google Scholar]
- 21. Bolz KD, Myhre HO, Angelsen BA, Nordby A. Intravascular ultrasonography. Normal and pathologic findings in the great veins. Acta Radiol. 1993;34:329–334. [PubMed] [Google Scholar]
- 22. Neglén P, Raju S. Intravascular ultrasound scan evaluation of the obstructed vein. J Vasc Surg. 2002;35:694–700. [DOI] [PubMed] [Google Scholar]
- 23. Metzner A, Burchard A, Wohlmuth P, Rausch P, Bardyszewski A, Gienapp C, Tilz RR, Rillig A, Mathew S, Deiss S, Makimoto H, Ouyang F, Kuck KH, Wissner E. Increased incidence of esophageal thermal lesions using the second‐generation 28‐mm cryoballoon clinical perspective. Circ Arrhythm Electrophysiol. 2013;6:769–775. [DOI] [PubMed] [Google Scholar]
- 24. Miyazaki S, Nakamura H, Taniguchi H, Takagi T, Iwasawa J, Watanabe T, Hachiya H, Hirao K, Iesaka Y. Esophagus‐related complications during second‐generation cryoballoon ablation‐insight from simultaneous esophageal temperature monitoring from 2 esophageal probes. J Cardiovasc Electrophysiol. 2016;27:1038–1044. [DOI] [PubMed] [Google Scholar]
- 25. John RM, Kapur S, Ellenbogen KA, Koneru JN. Atrioesophageal fistula formation with cryoballoon ablation is most commonly related to the left inferior pulmonary vein. Heart Rhythm. 2017;14:184–189. [DOI] [PubMed] [Google Scholar]
Associated Data
This section collects any data citations, data availability statements, or supplementary materials included in this article.
Supplementary Materials
Video S1. Intra‐vein visualization with IVUS before cryoballoon ablation.
Video S2. Intra‐vein visualization with IVUS after cryoballoon ablation. Areas of intramural hematoma and intra‐vein edema is displayed.