

Abstract
Background
Antihypertension medication (antihypertensive) adherence lowers risk of cardiovascular disease (CVD); few studies have examined this association among older adults.
Methods and Results
We assessed this association among Medicare fee‐for‐service beneficiaries aged 66 to 79 years who were newly diagnosed with hypertension and initiated on antihypertensives in 2008–2009 (n=155 597). We calculated proportion of days covered (PDC) during follow‐up, using proportional subdistribution hazard models, to examine association between antihypertensive adherence and a composite CVD outcomes, including first incident of fatal/nonfatal acute myocardial infarction, ischemic heart disease, stroke/transient ischemic attack, and heart failure. During follow‐up (median 5.8 years and 798 621 person‐years), we documented 47 198 CVD events. Among beneficiaries, 60.8%, 30.3%, and 8.9% had PDC ≥80%, 40% to 79%, and <40%. Crude incidence of CVD events were 40.1 (95% CI, 40.0–40.1), 93.9 (93.8–93.9), and 98.1 (98.1–98.2) per 1000 person‐years for PDC ≥80%, 40% to 79%, and <40%, respectively. Adjusted hazard ratios for CVD events were 1.0 (<40% as reference), 1.0 (0.97–1.03) for 40% to 79%, and 0.44 (0.42–0.45) for ≥80% (P<0.001). Dose‐response analysis suggested a nonlinear relationship between PDC and risk for CVD events with a protective effect of ≥80%. The pattern of associations between PDC and ischemic heart disease, stroke/transient ischemic attack, and heart failure were largely consistent as for CVD events and across different groups.
Conclusions
Antihypertensive adherence was associated with a significantly lower risk of CVD events among older adults. There appeared to be a threshold effect in reducing CVD events at around PDC 80%, above which the risk for CVD reduced substantially.
Keywords: cardiovascular disease, hypertension, Medicare, medication adherence, prevention
Subject Categories: Hypertension, Cardiovascular Disease, Epidemiology, Risk Factors
Clinical Perspective
What is New?
Among 155 597 Medicare beneficiaries aged 66 to 79 years newly diagnosed with hypertension and initiated on antihypertensive medication, around 60% were classified as being highly adherent to taking their medication (access to medication on ≥80% of days).
Those classified as being highly adherent had less than half the risk of having a cardiovascular event compared with those classified as having moderate or low adherence over a median of 5.8 years.
Our results suggest that assessment of long‐term adherence is more strongly associated with cardiovascular outcomes compared with first‐year adherence among older beneficiaries.
What are the Clinical Implications?
High levels of adherence to antihypertensive medication regimens significantly reduces risk for suffering a cardiovascular event among older adults.
There appears to be a threshold effect in reducing cardiovascular event risk for medication adherence at about 80%, above which the risk for an event reduces substantially.
Adherence to antihypertensive medication is not optimal among Medicare beneficiaries newly diagnosed with and treated for hypertension, and interventions to improve adherence should be a priority for clinicians, public health, and insurers to improve cardiovascular disease outcomes.
Introduction
Hypertension is a leading risk factor for development of cardiovascular disease (CVD) and is a significant contributor to morbidity and mortality in the United States.1 Many randomized, control trials demonstrated the benefit of antihypertensive medications (antihypertensives) on reduction of risk for CVD morbidity and mortality.2, 3 Despite the benefit of antihypertensive therapies, many studies suggested suboptimal adherence to these medications, particularly among older adults with multiple chronic conditions.4, 5, 6, 7, 8, 9, 10, 11 Nonadherence to antihypertensives is associated with increased risk for CVD, hospitalization, and healthcare costs.5, 12, 13, 14, 15, 16, 17 Many observational studies examined the relationship between antihypertensive adherence and CVD outcomes in the general hypertension population.5, 13, 17 While some focused on older adults,4, 9, 18, 19, 20 few examined this relationship among older adults who were newly initiated on antihypertensives without previous CVD.
Assessing antihypertensive adherence and CVD outcomes among older adults with newly diagnosed hypertension might have important public health implications.7, 8 It is estimated that the proportion of the US population aged ≥65 years will increase from 13.7% (43 million) in 2012 to 21.0% (80 million) in 2040.21 The incidence of hypertension increases with age, with >65% of people aged ≥65 years having hypertension.1, 22 Therefore, the total numbers of people diagnosed with hypertension might be expected to increase over time, although this might be mitigated somewhat by improvements in certain risk factors for hypertension including decreased prevalence of smoking,23 improved diet quality24 and leveling off in the prevalence of obesity.25, 26 However, it was estimated that, on average, >137 000 Medicare beneficiaries aged ≥65 years newly initiated antihypertensive medication each year from 2007 to 2012.20
The present study examined the association between antihypertensive adherence and composite CVD outcomes among a cohort of Medicare fee‐for‐service beneficiaries aged 66 to 79 years who were newly initiated on antihypertensives in 2008–2009.
Methods
Study Cohort
We identified all Medicare fee‐for‐service beneficiaries aged 66 to 79 years enrolled during 2007–2008 who met the criteria: (1) did not have a CVD claim in the previous 12 months; (2) had a claim for hypertension during the years 2008–2009 (International Classification of Diseases, Ninth Revision, Clinical Modification [ICD‐9‐CM] codes, 362.11, 401.0 through 405.9 and 437.2); (3) were newly initiated on antihypertensive treatment with at least 1 prescription fill after the diagnosis; and (4) had continuous enrollment in Medicare Parts A, B, and D during follow‐up. Part A included data on hospital stays, Part B included data on outpatient claims, and Part D included data on prescription drugs. A hypertension diagnosis was based on the Chronic Conditions Warehouse definition used by Centers for Medicare and Medicaid Services (www.ccwdata.org/web/guest/condition-categories). Beneficiaries were considered newly initiated on treatment for hypertension if they had not taken any antihypertensive 12 months before the date of the first recorded diagnosis of hypertension.27 Among 7 176 637 Medicare fee‐for‐service beneficiaries aged 66 to 79 years in 2008–2009 who had been enrolled for at least 12 months, we excluded 5 713 892 beneficiaries who had a history of CVD or hypertension, including acute myocardial infarction, ischemic heart disease (IHD), atrial fibrillation, stroke or transient ischemic attack (TIA), and heart failure. The history of CVD and hypertension were determined by using Centers for Medicare and Medicaid Services Chronic Condition Warehouse Algorithms (https://www.ccwdata.org/web/guest/condition-categories). Among remaining 1 462 892 beneficiaries, we identified 285 830 beneficiaries who were newly diagnosed with hypertension in 2008 or 2009. Among beneficiaries with newly diagnosed hypertension, we excluded 64 885 with no information on fills of antihypertensive medications, 29 012 who had a CVD event or who died of CVD before the date of the first fill of antihypertensives, 33 520 who had a CVD event or died within 12 months from the date of hypertension recorded, 2628 who were in long‐term care facilities before first CVD event, and 188 with missing covariates. The final analytical cohort included 155 597 beneficiaries (Figure 1).
Figure 1.
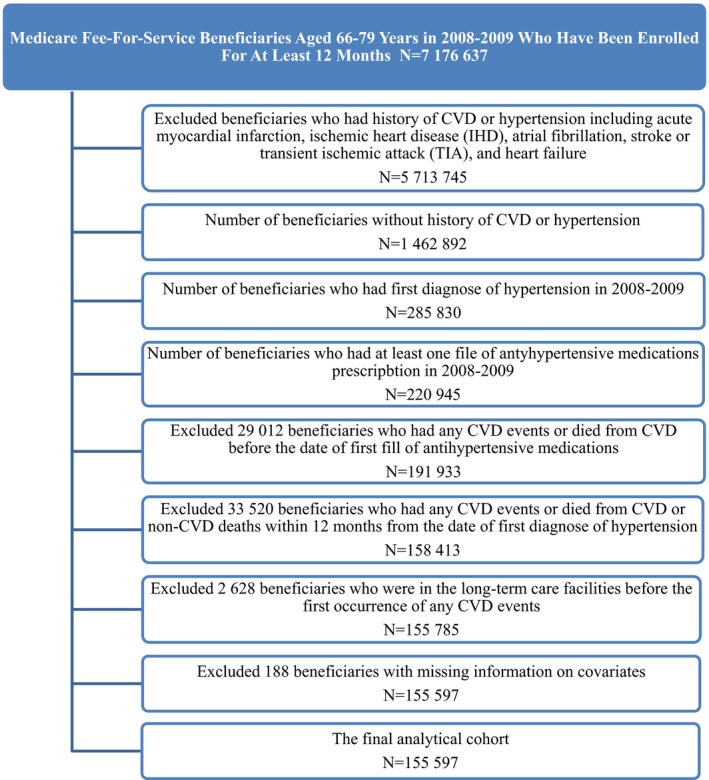
Medicare fee‐for‐service beneficiaries aged 66 to 79 years in 2008–2009 who were newly diagnosed with hypertension and newly initiated antihypertension medications, Medicare 2008–2014 cohort. CVD indicates cardiovascular disease.
Proportion of Days Covered by Medicare for Antihypertensive Medications
We defined antihypertensives as being: alpha blocker; angiotensin II receptor blocker; angiotensin‐converting enzyme inhibitor; beta‐blocker; calcium‐channel blocker; vasodilating agents; or diuretics defined by the national drug codes, or any combination of the above classes of medications (https://www.imshealth.com/files/web/IMSH%20Institute/USC_Classiification_Process_2011.pdf).
Adherence to antihypertensives was measured through proportion of days covered (PDC). PDC is the proportion of days during the follow‐up period for which the beneficiary had their prescribed antihypertensive on hand. PDC is used by the Centers for Medicare and Medicaid Services as a quality metric, endorsed by the National Quality Forum in 2011 (www.qualityforum.org/Publications/2010/05/National_Voluntary_Consensus_Standards_for_Medication_Management.aspx), and is the preferred adherence method of the Pharmacy Quality Alliance.28
We calculated the interval‐based cumulative PDC of 1 or more (≥1) antihypertensives on hand during the follow‐up using information in Medicare Part D drug claim data.29 First, we determined the beneficiaries' follow‐up in months from index prescription date to either first occurrence of a CVD event (fatal or nonfatal), death from a cause other than CVD, or the end of the follow‐up period (December 31, 2014). Second, within the defined follow‐up period, we counted the number of days the beneficiary had at least 1 antihypertensive on hand (covered days) based on the prescription fill date and days' supply. If prescriptions for the same medication overlapped, then we adjusted the prescription start date to be the day after the previous days' supply ended. Third, we divided the number of covered days by the total number of days during the follow‐up and multiplied this number by 100 to obtain the PDC as a percentage. We defined this PDC as ≥1 antihypertensive available PDC. The PDC was used as a proxy measure for antihypertensive use behavior. Our analysis uses this ≥1 antihypertensive available PDC, the preferred Pharmacy Quality Alliance method,28 as our primary exposure. In some parts of the analysis, we used PDC as a categorical variable (low [<40%], intermediate [40–79%], and high adherence [≥80%]). This categorization has been used previously.14, 20 The categorical form was used to examine and compare the patterns of antihypertensive adherence by the selected sociodemographic variables. We also used PDC as a continuous variable to examine the shape of the relationship between antihypertensive adherence and risk for CVD events. This was done to retain information that would have been lost though categorization.
Incident CVD or CVD‐Related Death
The primary outcome is a composite end point of incident CVD or CVD‐related death (CVD event). The first occurrence of CVD event was determined by using Centers for Medicare and Medicaid Services Chronic Condition Warehouse Algorithms (https://www.ccwdata.org/web/guest/condition-categories). The CVD events included acute myocardial infarction (ICD‐9 codes 410.0–410.9); IHD (ICD‐9 codes 410.0–414.9); stroke/TIA (ICD‐9 codes 430.0–436.9); and heart failure (ICD‐9 codes 398.9, 402.0–402.9, 404.0–404.9; 428.0–428.9). Cause‐specific mortality data are not available for Medicare beneficiaries. Therefore, we classified deaths as being CVD related if they occurred within 30 days of a hospitalization where the primary or secondary admission code was CVD related (ICD‐9 codes defined as above). For the secondary analysis, we examined the relationship between antihypertensive adherence and risk for first occurrence of IHD, stroke/TIA, and heart failure events separately. Follow‐up of beneficiaries continued until first occurrence of CVD event (fatal or nonfatal), with censoring at the time of death for those who died from causes other than CVD. Beneficiaries who were not matched with CVD events were considered alive and free of CVD through follow‐up period (December 31, 2014).
Baseline Covariates
The baseline characteristics include age, sex, race/ethnicity (non‐Hispanic white, black, Hispanic, and other), urban or rural residence, status of low‐income subsidy (yes/no), statins use (yes/no), and number of classes of antihypertensives on hand during follow‐up. To account for the effects of comorbidity levels on risk of CVD event, we calculated the Charlson Comorbidity Index at baseline (0, 1, 2, 3, 4, and ≥5).30, 31 We included the following chronic conditions as dichotomous variables in our models: Alzheimer's disease, asthma, chronic kidney disease, chronic obstructive pulmonary disease and bronchiectasis, depression, diabetes mellitus, hyperlipidemia, lung or colorectal cancer, and rheumatoid arthritis/osteoarthritis. We also calculated the average out‐of‐pocket antihypertensive expenditures per day during follow‐up.
Statistical Analysis
We estimated means and percentages of the selected covariates by PDC categories and used t tests for continuous and χ2 test for categorical variables to test for the differences across PDC categories. We used Cox proportional hazards regression to estimate hazards ratios (HRs) and 95% CIs for the composite CVD events associated with PDC categories with <40% category as the referent. We presented age, sex, and race/ethnicity adjusted HRs as well as fully adjusted HRs that also included urban‐rural residence, status of low‐income subsidy, statin use, average out‐of‐pocket expenditure on antihypertensives/day, Charlson Comorbidity Index, number of antihypertensives, and 10 chronic conditions. We calculated the crude incidence rates as well as the adjusted cumulative incidence function of CVD events over time by PDC categories. We calculated the adjusted population attributable fraction to provide an estimate of the proportion of CVD events in this cohort that hypothetically would have been avoided or postponed, assuming a causal relationship between lack of antihypertensive use and CVD events, during the follow‐up, if all beneficiaries had sustained ≥80% medication adherence.32
Using PDC as a continuous variable, we examined the dose‐response relationship between PDC and CVD events using the restricted cubic spline with 5 knots (at 10th, 25th, 50th, 75th, and 90th percentiles of PDC) in multivariable Cox proportional models with 20th percentile PDC as the referent, tested for nonlinearity using t tests, and used Joinpoint regression to identify the percentage point of PDC where the significant changing point occurred.33
For all Cox proportional models analyses, we used the Fine–Gray proportional subdistribution hazard model to account for competing risks attributed to death from causes other than CVD.34 The proportional hazards assumption of the Cox models was evaluated with Schoenfeld residuals, which revealed no important departures from proportionality in hazards. Data were analyzed using SAS software (release 9.4; SAS Institute Inc, Cary, NC). All tests were 2‐sided, and P<0.05 was considered significant.
We conducted several sensitivity analyses. First, we conducted stratified analyses of PDC and CVD events by age (<75 versus ≥75 years), sex, race/ethnicity, Charlson Comorbidity Index (0, 1–3, and ≥4), diabetes mellitus (yes/no), chronic kidney disease (yes/no), and low‐income subsidy status (yes/no), and tested for interactions of PDC with these covariates by including interactions terms in analysis. Second, to control for the baseline imbalances in the covariates, we estimated the propensity score weights by the generalized boosted models that included all covariates in the fully adjusted Cox models. The propensity score weights were estimated by using a SAS TWANG macro that calls mnps function in R (http://www.rand.org/statistics/twang/mnps-sas-tutorial.html). Third, we calculated PDC for beneficiaries who took 1 versus 2 or more antihypertensives during follow‐up and examined these PDC's association with CVD outcomes separately. Fourth, we calculated the first‐year PDC and examined its association with CVD outcomes. Fifth, there were some variations to calculate interval‐based PDC for multiple medications use.29, 35 We also calculated the interval‐based average PDC (average PDC) as described by Choudhry et al.29 Briefly, it calculates PDC for each medication separately, then averages each individual PDC to get the overall PDC. For example, for beneficiaries taking 2 classes of antihypertensive medications, the interval‐based average PDC for each medication was calculated, and then 2 PDCs were averaged to get overall average PDC. We calculated the average PDC for each beneficiary on a yearly basis during follow‐up and averaged each annual PDC to obtain the overall average PDC in sensitivity analysis.
Data were analyzed through the CMS Virtual Research Data Center, which provided access to approved privacy‐protected data files within the security of the virtual CMS environment. Therefore, the requirement of informed consent was waived.
Results
Overall, 8.9% (95% CI, 8.8–9.1%) of beneficiaries had PDC below 40% (low adherence), 30.3% (95% CI 30.0–30.5%) had 40% to 79% PDC (intermediate adherence), and 60.8% (95% CI 60.6–61.1%) had ≥80% PDC (high adherence) during follow‐up from 2008 to 2014. Compared with those who were low or intermediate adherent (PDC <80%), the high adherent beneficiaries were slightly younger and were more likely to be women, non‐Hispanic white, and more likely to take >1 antihypertensive and use statins. In addition, high adherent beneficiaries had fewer comorbidities and were less likely to receive a low‐income subsidy, or to have chronic conditions other than hyperlipidemia and diabetes mellitus (P<0.001; Table 1).
Table 1.
Characteristics of Medicare Beneficiaries Aged 66 to 79 Years Newly Diagnosed with Hypertension and Initiated On Antihypertensive Medication by Status of PDC, Medicare 2008–2014 Cohort
| Characteristics | No. of Medicare Beneficiaries | Total | PDC Category | ||
|---|---|---|---|---|---|
| <40% (Low Adherence) | 40% to 79% (Intermediate Adherence) | ≥80% (High Adherence) | |||
| All, N (%) | 155 597 | 100% | 13 899 (8.9) | 47 081 (30.3) | 94 617 (60.8) |
| Age, mean | 155 597 | 69.9 | 70.7 | 70.1 | 69.7 |
| Sex, N (%) | |||||
| Male | 56 463 | 100% | 5695 (10.1) | 17 841 (31.6) | 32 927 (58.3) |
| Female | 99 134 | 100% | 8204 (8.28) | 29 240 (29.5) | 61 690 (62.2) |
| P valuea | <0.001 | <0.001 | <0.001 | ||
| Race, N (%) | |||||
| Non‐Hispanic white | 129 216 | 100% | 9744 (7.5) | 36 646 (28.4) | 82 826 (64.1) |
| Black | 8220 | 100% | 1273 (15.5) | 3183 (38.7) | 3764 (45.8) |
| Hispanic | 10 894 | 100% | 2006 (18.4) | 4606 (42.3) | 4282 (39.3) |
| Others | 7267 | 100% | 876 (12.1) | 2646 (36.4) | 3745 (51.5) |
| P valuea | <0.001 | <0.001 | <0.001 | ||
| No. of antihypertension medications, N (%)b | |||||
| 1 | 96 467 | 100% | 10 306 (10.7) | 32 353 (33.5) | 53 808 (55.8) |
| 2 | 39 438 | 100% | 1551 (3.9) | 9191 (23.3) | 28 696 (72.8) |
| ≥3 | 10 099 | 100% | 170 (10.4) | 1349 (28.1) | 8580 (61.5) |
| Other | 9593 | 100% | 1872 (19.5) | 4188 (43.7) | 3533 (36.8) |
| P valuea | <0.001 | <0.001 | <0.001 | ||
| Charlson Comorbidity Index, N (%) | |||||
| 0 | 96 510 | 100% | 8337 (8.6) | 28 356 (29.4) | 59 817 (62.0) |
| 1 | 32 720 | 100% | 2973 (9.1) | 10 366 (31.7) | 19 381 (59.2) |
| 2 | 14 821 | 100% | 1414 (9.5) | 4 575 (30.9) | 8832 (59.6) |
| 3 | 7169 | 100% | 674 (9.4) | 2326 (32.4) | 4169 (58.2) |
| ≥4 | 4377 | 100% | 501 (11.4) | 1458 (33.3) | 2418 (55.2) |
| P valuea | <0.001 | <0.001 | <0.001 | ||
| Low‐income subsidy, N (%) | |||||
| Yes | 27 714 | 100% | 4212 (15.2) | 10 199 (36.8) | 13 303 (48.0) |
| No | 127 883 | 100% | 9687 (7.6) | 36 882 (28.8) | 81 314 (63.6) |
| P valuea | <0.001 | <0.001 | <0.001 | ||
| Out‐of‐pocket medication expenditure/per day, mean (95% CI) | 155 597 | 0.21 (0.21–0.22) | 0.20 (0.20–0.21) | 0.22 (0.22–0.22) | 0.21 (0.21–0.21) |
| Statin‐use status, N (%) | |||||
| User | 59 682 | 100% | 3768 (6.3) | 17 092 (28.6) | 38 822 (65.0) |
| Nonuser | 95 915 | 100% | 10 131 (10.6) | 29 989 (31.3) | 55 795 (58.2) |
| P valuea | <0.001 | <0.001 | <0.001 | ||
| Chronic conditions at baseline, N (%)c | |||||
| Alzheimer's | 1089 | 100% | 164 (15.1) | 379 (34.8) | 546 (50.1) |
| Asthma | 5794 | 100% | 674 (11.6) | 1946 (33.6) | 3174 (54.8) |
| Chronic kidney disease | 6301 | 100% | 717 (11.4) | 2053 (32.6) | 3531 (56.0) |
| Chronic obstructive pulmonary disease | 11 287 | 100% | 1547 (13.7) | 3867 (34.3) | 5873 (52.0) |
| Colorectal cancer | 1768 | 100% | 237 (13.4) | 573 (32.4) | 958 (54.2) |
| Hyperlipidemia | 72 425 | 100% | 5610 (7.8) | 21 684 (29.9) | 45 131 (62.3) |
| Lung cancer | 940 | 100% | 149 (15.9) | 317 (33.7) | 474 (50.4) |
| Depression | 13 594 | 100% | 1543 (11.4) | 4643 (34.2) | 7408 (54.5) |
| Diabetes mellitus | 29 575 | 100% | 2527 (8.5) | 9437 (31.9) | 17 611 (59.6) |
| Rheumatoid arthritis/osteoarthritis | 36 938 | 100% | 3900 (10.6) | 11 837 (32.0) | 21 201 (57.4) |
N indicates number; PDC, proportion days covered.
P value for significant difference within categories of selected factors based on t test for dichotomous variable, ANOVA for continuous variable, and χ2 for categorical variable; all tests 2‐tailed.
For the number of antihypertensive medications use, first, we calculated the total days of antihypertensive medications coverage for beneficiaries who took 1, 2, 3, or more medications during the period of follow‐up, respectively, and, second, we classified the beneficiaries into 1, 2, 3, or more medications use groups if he or she took 1, 2, 3, or more medications for ≥75% of days during the follow‐up. The beneficiaries who did not fall into the above‐defined 1, 2, 3, or more medications use groups were classified as “Other.”
The chronic conditions at the baseline line.
For CVD events, the crude incidence rates were 98.1 (95% CI, 98.1–98.2), 93.9 (95% CI, 93.8–93.9), and 40.1 (95% CI 40.0–40.1) per 1000 person‐years among beneficiaries who had <40%, 40% to 79%, and ≥80% PDC, respectively. Comparing beneficiaries with <40% PDC, the adjusted HR was 1.00 (95% CI, 0.97–1.03) for 40% to 79% and 0.44 (95% CI, 0.42–0.45) for ≥80% PDC. The adjusted PAF was 32.5% (95% CI, 31.5–33.5%; Table 2). The patterns of associations for IHD and heart failure events were similar to that of overall CVD events. For stroke/TIA, the crude incidence rates were 13.2 (95% CI, 13.2–13.2), 11.0 (95% CI, 11.0–11.1) and 5.11 (95% CI, 5.11–5.12) per 1000 person‐years among beneficiaries who had <40%, 40% to 79%, and ≥80% PDC, respectively. Comparing beneficiaries with <40% PDC, the adjusted HR was 0.84 (95% CI, 0.79–0.89) for 40% to 79% and 0.40 (95% CI, 0.38–0.43) for ≥80 PDC (Table 2). The patterns of association between PDC and CVD events remained largely unchanged among beneficiaries when the propensity score weights were used in the analysis (Table 3).
Table 2.
Adjusted Hazards Ratios for Risk of CVD, IHD, Stroke/TIA and Heart Failure Events, and Population Attributable Fraction Associated With PDC, Medicare 2008–2014 Cohort
| Characteristics | PDC Category | P Trenda | Adjusted PAF (95% CI)b | ||
|---|---|---|---|---|---|
| <40% (Low Adherence) | 40% to 79% (Intermediate Adherence) | ≥80% (High Adherence) | |||
| No. of Medicare beneficiaries | 13 899 | 47 081 | 94 617 | ||
| CVD | |||||
| Eventsc | 5947 (5770) | 20 391 (19 987) | 20 860 (19 969) | ||
| Total person‐y | 60 601 | 27 269 | 520 751 | ||
| Crude incidence, per 1000 person‐y (95% CI) | 98.1 (98.1–98.2) | 93.9 (93.8–93.9) | 40.1 (40.0–40.1) | ||
| HR adjusted for age, sex, and race only (95% CI) | 1.0 | 0.95 (0.93–0.98) | 0.39 (0.38–0.40) | <0.001 | |
| Fully adjusted HR (95% CI)d | 1.0 | 1.00 (0.97–1.03) | 0.44 (0.42–0.45) | <0.001 | 32.5 (31.5–33.5) |
| IHD | |||||
| IHD eventsc | 3279 (3235) | 11 603 (11 501) | 11 109 (10 870) | ||
| Total person‐y | 65 682 | 235 000 | 534 499 | ||
| Crude incidence, per 1000 person‐y (95% CI) | 49.9 (49.9–50.0) | 49.4 (49.3–49.4) | 20.8 (20.8–20.8) | ||
| HR adjusted for age, sex, and race only | 1.0 | 0.98 (0.94–1.02) | 0.40 (0.39–0.42) | <0.001 | |
| Fully adjusted HR (95% CI)d | 1.0 | 1.01 (0.97–1.06) | 0.44 (0.42–0.46) | <0.001 | 32.8 (31.5–34.2) |
| Stroke/TIA | |||||
| Stroke/TIA eventsc | 979 (959) | 2928 (2882) | 2847 (2721) | ||
| Total person‐y | 74 275 | 266 787 | 556 960 | ||
| Crude incidence, per 1000 person‐y (95% CI) | 13.2 (13.2–13.2) | 11.0 (11.0–11.1) | 5.11 (5.11–5.12) | ||
| HR adjusted for age, sex, and race only (95% CI) | 1.0 | 0.84 (0.78–0.90) | 0.39 (0.36–0.42) | <0.001 | |
| Fully adjusted HR (95% CI)d | 1.0 | 0.84 (0.79–0.89) | 0.40 (0.38–0.43) | <0.001 | 32.8 (30.5–35.1) |
| Heart failure | |||||
| Heart failure eventsc | 1269 (1235) | 3987 (3899) | 4462 (4278) | ||
| Total person‐y | 71 960 | 258 889 | 550 295 | ||
| Crude incidence, per 1000 person‐y (95% CI) | 17.6 (17.6–17.7) | 15.4 (15.4–15.5) | 8.11 (8.10–8.12) | ||
| HR adjusted for age, sex, and race only (95% CI) | 1.0 | 0.90 (0.85–0.96) | 0.49 (0.46–0.52) | <0.001 | |
| Fully adjusted HR (95% CI)d | 1.0 | 0.99 (0.92–1.05) | 0.57 (0.54–0.61) | <0.001 | 23.3 (21.0–25.6) |
CVD indicates cardiovascular disease; HR, hazard ratio; IHD, ischemic heart disease; PAF, population attributable fraction; PDC, proportion days covered; TIA, transient ischemic attack.
P value for trends across the categories of proportion days covered; all tests 2‐tailed.
PAF adjusted for age, sex, race/ethnicity, urban‐rural residence, statins use, number of antihypertensive medications, status of low‐income subsidy, out‐of‐pocket medications payment/day, Charlson Comorbidity Index, and 10 chronic conditions at baseline.
CVD events included both fatal and nonfatal events, and numbers in parentheses indicate the nonfatal events.
Adjusted for age, sex, race/ethnicity, urban‐rural residence, statins use, number of antihypertensive medications, status of low‐income subsidy, out‐of‐pocket medications payment/day, Charlson Comorbidity Index, and 10 chronic conditions at baseline.
Table 3.
Propensity Score Weights Adjusted Hazards Ratios for Risk of CVD, IHD, Stroke/TIA and Heart Failure Events, and Population Attributable Fraction Associated With PDC, Medicare 2008–2014 Cohorta
| Characteristics | PDC Category | P Trendb | Adjusted PAF (95% CI)c | ||
|---|---|---|---|---|---|
| <40% (Low Adherence) | 40% to 79% (Intermediate Adherence) | ≥80% (High Adherence) | |||
| No. of Medicare beneficiaries and percent (%) | 13 899 (8.9%) | 47 081 (30.3%) | 94 617 (60.8%) | ||
| CVD | |||||
| Eventsd | 5947 (5770) | 20 391 (19 987) | 20 860 (19 969) | ||
| Total person‐y | 60 601 | 217 269 | 520 751 | ||
| Crude incidence, per 1000 person‐y (95% CI) | 98.1 (98.1–98.2) | 93.9 (93.8–93.9) | 40.1 (40.0–40.1) | ||
| HR adjusted for propensity score weights only (95% CI) | 1.0 | 1.05 (1.00–1.11) | 0.45 (0.43–0.47) | <0.001 | |
| Fully adjusted HR (95% CI)e | 1.0 | 1.06 (1.00–1.11) | 0.45 (0.42–0.47) | <0.001 | 32.3 (31.5–33.2) |
| IHD | |||||
| IHD eventsd | 3279 (3235) | 11 603 (11 501) | 11 109 (10 870) | ||
| Total person‐y | 65 682 | 235 000 | 534 499 | ||
| Crude incidence, per 1000 person‐y (95% CI) | 49.9 (49.9–50.0) | 49.4 (49.3–49.4) | 20.8 (20.8–20.8) | ||
| HR adjusted for propensity score weights only (95% CI) | 1.0 | 1.06 (0.99–1.13) | 0.45 (0.42–0.48) | <0.001 | |
| Fully adjusted HR (95% CI)e | 1.0 | 1.06 (0.99–1.14) | 0.45 (0.42–0.48) | <0.001 | 32.8 (31.7–33.9) |
| Stroke/TIA | |||||
| Stroke/TIA eventsd | 979 (959) | 2928 (2882) | 2847 (2721) | ||
| Total person‐y | 74 275 | 266 787 | 556 960 | ||
| Crude incidence, per 1000 person‐y (95% CI) | 13.2 (13.2–13.2) | 11.0 (11.0–11.1) | 5.11 (5.11–5.12) | ||
| HR adjusted for propensity score weights only (95% CI) | 1.0 | 0.90 (0.79–1.01) | 0.44 (0.39–0.49) | <0.001 | |
| Fully adjusted HR (95% CI)e | 1.0 | 0.90 (0.80–1.02) | 0.44 (0.39–0.49) | <0.001 | 30.4 (28.1–32.6) |
| Heart failure | |||||
| Heart failure eventsd | 1269 (1235) | 3987 (3899) | 4462 (4278) | ||
| Total person‐y | 71 960 | 258 889 | 550 295 | ||
| Crude incidence, per 1000 person‐y (95% CI) | 17.6 (17.6–17.7) | 15.4 (15.4–15.4) | 8.11 (8.1–8.12) | ||
| HR adjusted for propensity score weights only (95% CI) | 1.0 | 0.95 (0.85–1.07) | 0.54 (0.48–0.61) | <0.001 | |
| Fully adjusted HR (95% CI)e | 1.0 | 0.96 (0.85–1.08) | 0.54 (0.48–0.61) | <0.001 | 23.9 (22.1–25.8) |
CVD indicates cardiovascular disease; HR, hazard ratio; IHD, ischemic heart disease; PAF, population attributable fraction; PDC, proportion days covered; TIA, transient ischemic attack.
For propensity score weights analysis, we used the SAS Proc Survey procedure with the weight statement.
P value for trends across the categories of proportion days covered; all tests 2‐tailed.
PAF, adjusted population attributable fraction, and adjusted for age, sex, race/ethnicity, urban‐rural residence, statins use, number of antihypertensive medications, status of low‐income subsidy, out‐of‐pocket medications payment/day, Charlson Comorbidity Index, and 10 chronic conditions at baseline.
CVD events included both fatal and nonfatal events, and numbers in parentheses indicate the nonfatal events.
In addition to adjusting for propensity score weights, adjusted for age, sex, race/ethnicity, urban‐rural residence, statins use, number of antihypertensive medications, status of low‐income subsidy, out‐of‐pocket medications payment/day, Charlson Comorbidity Index, and 10 chronic conditions at baseline to control for possible residual confounding.
Figure 2 shows the cumulative incidence functions for CVD, IHD, stroke/TIA, and heart failure events by PDC categories (P<0.001). The risk of CVD, IHD, and heart failure events remained largely unchanged until approximately a PDC of 80% based on Joinpoint analysis and decreased substantially at higher PDC levels (Figure 3A, 3B, and 3D). The risk declined more gradually for risk of stroke/TIA events (Figure 3C). The patterns of the reduced risk associated with PDC for CVD events were consistent across subgroups defined by age, sex, race/ethnicity, Charlson Comorbidity Index, diabetes mellitus, CKD, and low‐income subsidy status (Figure 4A through 4D). The patterns of association between PDC and CVD events remained largely unchanged among beneficiaries who took 1 versus 2 or more antihypertensives (Table S1). For the sensitivity analysis using first‐year PDC, 14.2% (95% CI, 14.0–14.3), 19.8% (95% CI, 19.6–20.0), and 66.0% (95% CI, 65.8–66.2) beneficiaries had first‐year PDC <40%, 40% to 79%, and ≥80%. The association between first‐year PDC and CVD outcomes was attenuated substantially and became insignificant for heart failure (Table S2). For the average PDC used in sensitivity analyses, 10.3% (95% CI, 10.2–10.5), 50.7% (95% CI, 50.5–51.0), and 38.9% (95% CI, 38.7–39.2) beneficiaries had PDC <40%, 40% to 79%, and ≥80%. For CVD events, the crude incidence rates declined gradually from 102.0 (95% CI, 102.0–102.1) to 75.0 (95% CI, 75.0–75.1) and 32.1 (95% CI, 32.1–32.1) per 1000 person‐years from low‐ to high‐adherence groups. Comparing beneficiaries with <40% average PDC, the adjusted HR was 0.77 (95% CI, 0.75–0.79) for 40% to 79% and 0.34 (95% CI, 0.33–0.35) for ≥80% average PDC (Table S3 and Figure S1). The patterns of association were similar for IHD, stroke, and heart failure events (Table S3 and Figure S1B through S1D).
Figure 2.
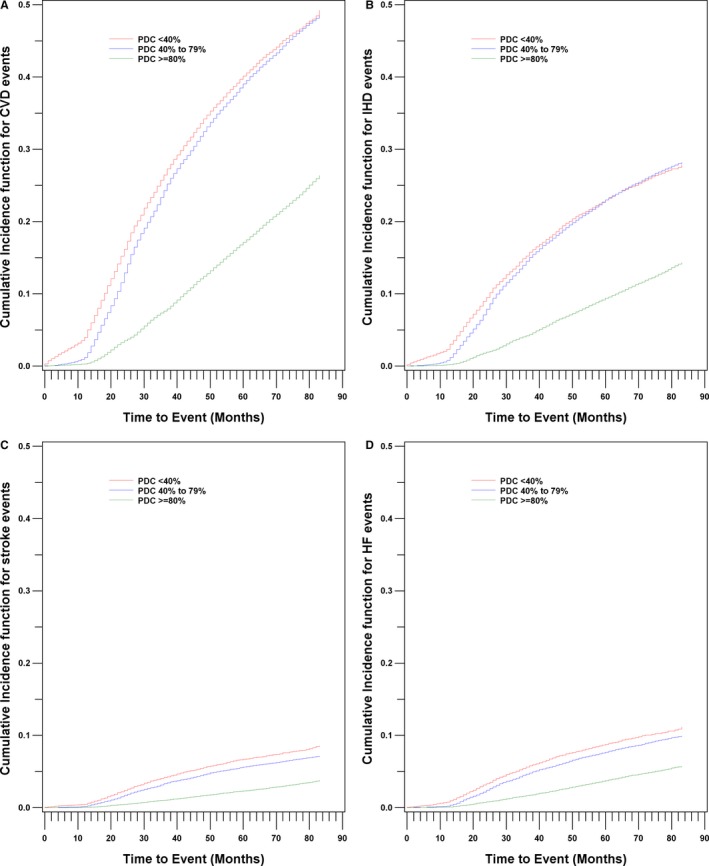
Cumulative incidence function for CVD (A), IHD (B), stroke/TIA (C), and heart failure (D) by PDC category, Medicare 2008–2014 cohort. CVD indicates cardiovascular disease; HF, heart failure; IHD, ischemic heart disease; PDC, proportion days covered; TIA, transient ischemic attack.
Figure 3.
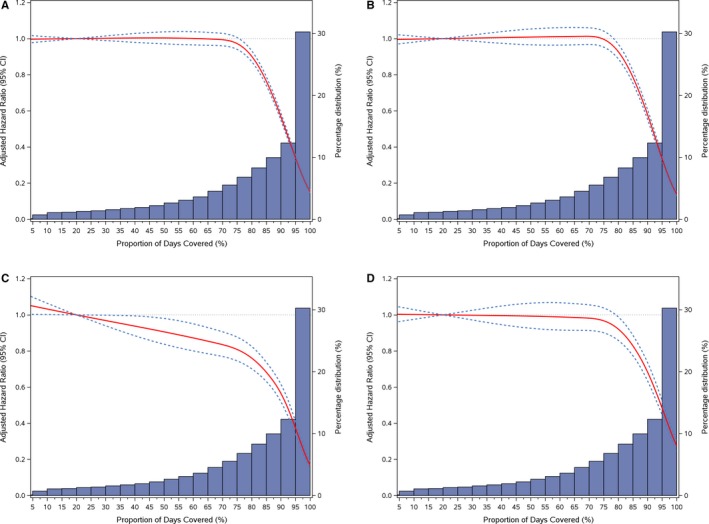
Adjusted hazard ratios (95% CI) for CVD events (A), IHD (B), stroke/TIA (C), and heart failure events (D) associated with PDC and its distribution, Medicare 2008–2014 cohort. CVD indicates cardiovascular disease; IHD, ischemic heart disease; PDC, proportion days covered; TIA, transient ischemic attack.
Figure 4.
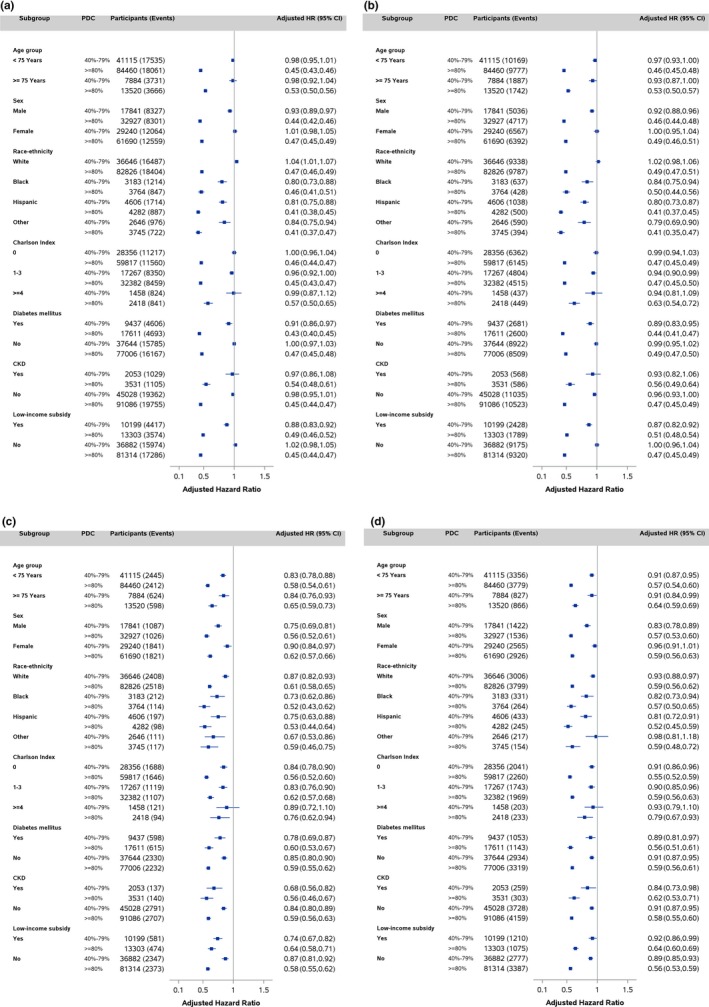
Adjusted hazard ratios (95% CI) for CVD (A), IHD (B), stroke/TIA (C), and heart failure events (D) associated with PDC by age group, sex, race, Charlson Comorbidity Index, diabetes mellitus, CKD, and status of low‐income subsidy, Medicare 2008–2014 cohort. CVD indicates cardiovascular disease; CKD, chronic kidney disease; HR, hazard ratio; IHD, ischemic heart disease; PDC, proportion days covered; TIA, transient ischemic attack.
Discussion
In this population‐based cohort of older adults with newly diagnosed hypertension and initiated antihypertensive therapy, around 40% were low or intermediate adherent (PDC <80%) as measured by ≥1 antihypertensive available PDC. Compared with low‐adherent (PDC <40%) beneficiaries, high‐adherent (PDC ≥80%) beneficiaries had a 56% lower risk for CVD and IHD events, 61% lower risk for stroke/TIA, and 43% lower risk for heart failure events during an average of 5.8 years of follow‐up. There appeared to be a threshold effect of PDC at ≈80% with minimal gain in being only low or intermediate adherent, above which the risk of CVD events was substantially lower, except for stroke/TIA events, which demonstrated a more‐gradual risk reduction across PDC values. The patterns of association between PDC and CVD events were largely consistent across age, sex, race/ethnicity, and Charlson Comorbidity Index groups.
Many studies demonstrated improved outcomes associated with better adherence to antihypertensives,5, 36 and nonadherence has been associated with increased risk for CVD, hospitalizations, and healthcare costs.5, 13, 14, 15, 16, 17, 37, 38, 39, 40, 41 In our study, around 60% of beneficiaries had PDC ≥80%, which is consistent with previous studies.9, 19 However, in this analysis, we observed a greater risk reduction associated with antihypertensive adherence than in other studies.13, 19, 42 In addition, our dose‐response analysis of PDC and risk for CVD events suggested a threshold effect of PDC at around 80%. Some studies also reported insignificant risk reduction comparing the intermediate adherence (40–79%) to low adherence (<40%),13, 19, 38 but others reported more‐gradual risk reduction associated with increased adherence.39, 40, 41 The reasons for the discrepancies in risk reduction are not clear. Differences in study design, duration of follow‐up, sample size, measurements of medication adherence, and the participants of the study (our cohort of older adults who initiated antihypertensives after age 65 years) might contribute to the observed discrepancies. For example, it is well known that different methods of calculating PDC resulted in different classification of patients' medication adherence attributed to the complex patterns of multiple medication use and assumptions used.29, 35 Our study focused on ≥1 antihypertensive available PDC because this is the Pharmacy Quality Alliance preferred method of measuring medication adherence.28 In our sensitivity analysis, using the interval‐based average PDC method29 produced a significantly lower percent of beneficiaries with ≥80% adherence (39.0% versus 60.8%) and showed a more‐gradual risk reduction across PDC categories. This gradual risk reduction might be mainly attributed to the reclassification of beneficiaries with ≥80% adherence under ≥1 antihypertensive available PDC to 40% to 79% category under the average PDC. Of the 94 617 beneficiaries with ≥80% adherence under ≥1 antihypertensive available PDC, 35 988 (38%) had been reclassified to 40% to 79% category under the average PDC, which might result in the gradual risk reduction under average PDC method. The prevalence of discontinuation or switching to different classes of antihypertensives were common among newly initiated patients, especially during the first year.5, 8, 9, 11, 20 Many of those patients, especially the older patients, might likely be adherent, but discontinued the initial medications because of the side effects or switching to other medications for better blood pressure control, and the average PDC method might misclassify as nonadherent some adherent patients.29 The ≥1 antihypertensive available PDC method might capture better the underlying medication adherence among those beneficiaries.29 In addition, the association between the first‐year PDC and CVD outcomes was attenuated substantially. The attenuation in risk reduction was mainly attributed to the reclassification of 44% (n=20 735) of beneficiaries with intermediate adherence (40–79%) under ≥1 antihypertensive available PDC to ≥80% category using the first‐year PDC. Many studies suggested that the average medication adherence declined significantly over time with the greatest changes within first year of treatment.5, 8, 9, 11, 20 Our results suggested that the use of first‐year PDC might not reflect well the long‐term adherence behavior, and the longer‐term PDC might capture better the association between PDC and CVD outcomes among the older beneficiaries. Our study provided an estimate of the adjusted population attributable fraction associated with low or intermediate adherence to antihypertensive medications, suggesting that, assuming free of other unobserved confounding effect, a noticeable proportion of CVD events might be prevented or postponed if all beneficiaries sustained PDC ≥80%.
Hypertension is a leading risk factor for CVD, affects around one third US adults,1 and >65% older adults (≥65 years) have hypertension.22 Although around 80% of adults aged 65 years or older were treated, around 55% have their blood pressure under control.43 Controlling high blood pressure requires sustained adherence to prescribed antihypertensives.10, 19 Antihypertensive adherence might be a particular concern for older adults who have multiple chronic conditions.4, 5, 6, 8, 20 Many studies have examined major barriers and predictors of nonadherence among hypertensive patients,5, 7, 9, 11, 44, 45 and some focused on older adults.6, 46 Potential barriers to adherence among older adults can be classified into 3 categories: (1) patient‐related factors, including sociodemographics, psychosocial factors, comorbidities, cognitive ability, and health beliefs; (2) medication‐related factors, including the number of medications taken, adverse side effects, and complex medication regimens; and (3) other factors, including the patient‐prescriber relationship, access to medication and cost, and social support.6, 46 Many randomized, control trials and observational studies have evaluated interventions among patients and healthcare professionals to improve adherence.47, 48, 49, 50 Interventions range from those that are patient focused and promote behavioral and educational change, clinician‐directed strategies, to multifaceted programs combining several adherence‐enhancing strategies. Some study suggested that pharmacist‐led hypertension management for systolic blood pressure significantly improved medication adherence and improved CVD outcome,50 and the interventions aimed at improving patients' knowledge of their health conditions, reasons for medication use, and better understanding of the long‐term risk of hypertension are of potential clinical value in improving antihypertensive adherence.47 The Million Hearts initiative brings together communities, health systems, nonprofit organizations, federal agencies, and private‐sector partners from across the country with the ambitious goal of preventing 1 million heart attacks and strokes over the course of 5 years.51 Improvement of blood pressure control is a critical part of the Million Hearts initiative, and 1 recommended strategy is to implement standardized hypertension treatment approaches that enlist the entire healthcare team in regularly assessing patients' blood pressure and medication adherence so that the medication regimen can be adjusted or barriers to adherence can be addressed.
The strengths of our study include a population‐based cohort study of older adults with detailed information on antihypertensives fills during follow‐up and adjustments for a large number of covariates at baseline. Our study has several limitations. We identified Medicare beneficiaries aged 66 to 79 years who were newly initiated on antihypertensives and had no previous CVD with 1‐year‐“clean” period, but we could not rule out the possibility that some beneficiaries might have a history of CVD or been on antihypertensives previously. Also, our cohort likely includes some beneficiaries who had undiagnosed hypertension before enrolling in Medicare, but initiated medication treatment after enrolling. The effect of antihypertensives on CVD risk for those beneficiaries might be different. Although we excluded any CVD events within 12 months from the date of initiating antihypertensives to reduce this possible bias, the findings from this cohort might not be generalizable to the general population. Second, some antihypertensives could be used for conditions other than hypertension; we were not able to determine why the drugs were prescribed. However, these medications are commonly used for treatment of hypertension. Third, there were no blood pressure measurements data available, we could not determine the status of the blood pressure control during follow‐up. Fourth, we determined CVD‐related deaths by using inpatient information, relying on the primary and secondary diagnosis codes that may have missed some CVD‐related deaths and misclassified those cases as competing risk. Last, the PDC method to estimate adherence using administrative claims data assumes refills are associated with actual use of medication, and has been noted as an acceptable proxy for adherence, yet the measure may overestimate adherence.
Conclusions
In this population‐based, cohort study of 155 597 Medicare beneficiaries aged 66 to 79 years who were newly diagnosed with hypertension and initiated on antihypertensive medications, around 60% were classified as being highly adherent to their medication (access to medication on ≥80% of days) according to the PDC methodology. Those classified as being highly adherent had a significantly lower risk of having a cardiovascular event during a median of 5.8 years of follow‐up compared with those classified as having low or moderate adherence. There appeared to be a threshold effect in reducing cardiovascular events for adherence at around 80%, above which the risk for an event reduced substantially. High levels of antihypertensive medication adherence significantly reduce CVD events in older adults. Adherence to these medications is not optimal and interventions to improve adherence should be a priority for clinicians, public health, and insurers.
Author Contributions
Yang and Chang had full access to all the data in the study and take responsibility for the integrity of the data and the accuracy of the data analysis. Study concept and design: Yang. Analysis and interpretation of the data: Yang; Chang; Ritchey; Loustalot. Drafting of the manuscript: Yang. Critical revision of the manuscript for important intellectual content: Yang; Ritchey; Loustalot. Statistical expertise: Yang. Study supervision: Yang.
Disclosures
None.
Supporting information
Table S1. Adjusted Hazards Ratios for Risk of CVD, IHD, Stroke/TIA and Heart Failure Events, and Population Attributable Fraction Associated With PDC by Beneficiaries Taking 1 vs 2 or More Antihypertensives, Medicare 2008–2014 Cohort
Table S2. Adjusted Hazards Ratios for Risk of CVD, IHD, Stroke/TIA and Heart Failure Events, and Population Attributable Fraction Associated With First Year PDC, Medicare 2008–2014 Cohort
Table S3. Adjusted Hazards Ratios for Risk of CVD, IHD, Stroke/TIA and Heart Failure Events, and Population Attributable Fraction Associated With Interval‐Based Average PDC, Medicare 2008–2014 Cohort
Figure S1. Adjusted hazard ratios (95% CI) for CVD events (A), IHD (B), stroke/TIA (C), and heart failure events (D) associated with interval‐based average PDC, Medicare 2008–2014 cohort. CVD indicates cardiovascular disease; IHD, ischemic heart disease; PDC, proportion days covered; TIA, transient ischemic attack.
Acknowledgments
We thank Robert Merritt, Division for Heart Disease and Stroke Prevention, Centers for Disease Control and Prevention, Dr Lawrence Barker, National Center for Chronic Disease Prevention and Health Promotion, Centers for Disease Control and Prevention, and Dr Barbara B. Bowman for their helpful comments. The findings and conclusions in this report are those of the authors and do not necessarily represent the official position of the Centers for Disease Control and Prevention.
(J Am Heart Assoc. 2017;6:e006056 DOI: 10.1161/JAHA.117.006056.)28647688
References
- 1. Mozaffarian D, Benjamin EJ, Go AS, Arnett DK, Blaha MJ, Cushman M, Das SR, de Ferranti S, Despres JP, Fullerton HJ, Howard VJ, Huffman MD, Isasi CR, Jimenez MC, Judd SE, Kissela BM, Lichtman JH, Lisabeth LD, Liu S, Mackey RH, Magid DJ, McGuire DK, Mohler ER III, Moy CS, Muntner P, Mussolino ME, Nasir K, Neumar RW, Nichol G, Palaniappan L, Pandey DK, Reeves MJ, Rodriguez CJ, Rosamond W, Sorlie PD, Stein J, Towfighi A, Turan TN, Virani SS, Woo D, Yeh RW, Turner MB; American Heart Association Statistics C and Stroke Statistics S . Heart disease and stroke statistics—2016 update: a report from the American Heart Association. Circulation. 2016;133:e38–e360. [DOI] [PubMed] [Google Scholar]
- 2. Chobanian AV, Bakris GL, Black HR, Cushman WC, Green LA, Izzo JL Jr, Jones DW, Materson BJ, Oparil S, Wright JT Jr, Roccella EJ. The seventh report of the Joint National Committee on prevention, detection, evaluation, and treatment of high blood pressure: the JNC 7 report. JAMA. 2003;289:2560–2572. [DOI] [PubMed] [Google Scholar]
- 3. James PA, Oparil S, Carter BL, Cushman WC, Dennison‐Himmelfarb C, Handler J, Lackland DT, LeFevre ML, MacKenzie TD, Ogedegbe O, Smith SC Jr, Svetkey LP, Taler SJ, Townsend RR, Wright JT Jr, Narva AS, Ortiz E. 2014 evidence‐based guideline for the management of high blood pressure in adults: report from the panel members appointed to the Eighth Joint National Committee (JNC 8). JAMA. 2014;311:507–520. [DOI] [PubMed] [Google Scholar]
- 4. van Eijken M, Tsang S, Wensing M, de Smet PA, Grol RP. Interventions to improve medication compliance in older patients living in the community: a systematic review of the literature. Drugs Aging. 2003;20:229–240. [DOI] [PubMed] [Google Scholar]
- 5. Ho PM, Bryson CL, Rumsfeld JS. Medication adherence: its importance in cardiovascular outcomes. Circulation. 2009;119:3028–3035. [DOI] [PubMed] [Google Scholar]
- 6. Gellad WF, Grenard JL, Marcum ZA. A systematic review of barriers to medication adherence in the elderly: looking beyond cost and regimen complexity. Am J Geriatr Pharmacother. 2011;9:11–23. [DOI] [PMC free article] [PubMed] [Google Scholar]
- 7. Aronow WS, Fleg JL, Pepine CJ, Artinian NT, Bakris G, Brown AS, Ferdinand KC, Ann Forciea M, Frishman WH, Jaigobin C, Kostis JB, Mancia G, Oparil S, Ortiz E, Reisin E, Rich MW, Schocken DD, Weber MA, Wesley DJ. ACCF/AHA 2011 expert consensus document on hypertension in the elderly: a report of the American College of Cardiology Foundation Task Force on Clinical Expert Consensus documents developed in collaboration with the American Academy of Neurology, American Geriatrics Society, American Society for Preventive Cardiology, American Society of Hypertension, American Society of Nephrology, Association of Black Cardiologists, and European Society of Hypertension. J Am Coll Cardiol. 2011;57:2037–2114. [DOI] [PubMed] [Google Scholar]
- 8. Fleg JL, Aronow WS, Frishman WH. Cardiovascular drug therapy in the elderly: benefits and challenges. Nat Rev Cardiol. 2011;8:13–28. [DOI] [PubMed] [Google Scholar]
- 9. Krousel‐Wood M, Joyce C, Holt E, Muntner P, Webber LS, Morisky DE, Frohlich ED, Re RN. Predictors of decline in medication adherence: results from the cohort study of medication adherence among older adults. Hypertension. 2011;58:804–810. [DOI] [PMC free article] [PubMed] [Google Scholar]
- 10. Krousel‐Wood M, Thomas S, Muntner P, Morisky D. Medication adherence: a key factor in achieving blood pressure control and good clinical outcomes in hypertensive patients. Curr Opin Cardiol. 2004;19:357–362. [DOI] [PubMed] [Google Scholar]
- 11. Krousel‐Wood MA, Muntner P, Islam T, Morisky DE, Webber LS. Barriers to and determinants of medication adherence in hypertension management: perspective of the cohort study of medication adherence among older adults. Med Clin North Am. 2009;93:753–769. [DOI] [PMC free article] [PubMed] [Google Scholar]
- 12. Ho PM, Magid DJ, Shetterly SM, Olson KL, Maddox TM, Peterson PN, Masoudi FA, Rumsfeld JS. Medication nonadherence is associated with a broad range of adverse outcomes in patients with coronary artery disease. Am Heart J. 2008;155:772–779. [DOI] [PubMed] [Google Scholar]
- 13. Mazzaglia G, Ambrosioni E, Alacqua M, Filippi A, Sessa E, Immordino V, Borghi C, Brignoli O, Caputi AP, Cricelli C, Mantovani LG. Adherence to antihypertensive medications and cardiovascular morbidity among newly diagnosed hypertensive patients. Circulation. 2009;120:1598–1605. [DOI] [PubMed] [Google Scholar]
- 14. Rasmussen JN, Chong A, Alter DA. Relationship between adherence to evidence‐based pharmacotherapy and long‐term mortality after acute myocardial infarction. JAMA. 2007;297:177–186. [DOI] [PubMed] [Google Scholar]
- 15. Simpson SH, Eurich DT, Majumdar SR, Padwal RS, Tsuyuki RT, Varney J, Johnson JA. A meta‐analysis of the association between adherence to drug therapy and mortality. BMJ. 2006;333:15. [DOI] [PMC free article] [PubMed] [Google Scholar]
- 16. Sokol MC, McGuigan KA, Verbrugge RR, Epstein RS. Impact of medication adherence on hospitalization risk and healthcare cost. Med Care. 2005;43:521–530. [DOI] [PubMed] [Google Scholar]
- 17. Will JC, Zhang Z, Ritchey MD, Loustalot F. Medication adherence and incident preventable hospitalizations for hypertension. Am J Prev Med. 2016;50:489–499. [DOI] [PubMed] [Google Scholar]
- 18. Tinetti ME, Han L, McAvay GJ, Lee DS, Peduzzi P, Dodson JA, Gross CP, Zhou B, Lin H. Anti‐hypertensive medications and cardiovascular events in older adults with multiple chronic conditions. PLoS One. 2014;9:e90733.24614535 [Google Scholar]
- 19. Krousel‐Wood M, Holt E, Joyce C, Ruiz R, Dornelles A, Webber LS, Morisky DE, Frohlich ED, Re RN, He J, Whelton PK, Muntner P. Differences in cardiovascular disease risk when antihypertensive medication adherence is assessed by pharmacy fill versus self‐report: the Cohort Study of Medication Adherence among Older Adults (CoSMO). J Hypertens. 2015;33:412–420. [DOI] [PMC free article] [PubMed] [Google Scholar]
- 20. Tajeu GS, Kent ST, Kronish IM, Huang L, Krousel‐Wood M, Bress AP, Shimbo D, Muntner P. Trends in antihypertensive medication discontinuation and low adherence among Medicare beneficiaries initiating treatment from 2007 to 2012. Hypertension. 2016;68:565–575. [DOI] [PMC free article] [PubMed] [Google Scholar]
- 21. Ortman JM, Velkoff VA, Hogan H. An aging nation: the older population in the United States. Population Estimates and Projections. 2014. Available at: https://www.census.gov/prod/2014pubs/p25-1140.pdf. Accessed January 8, 2017.
- 22. Gillespie CD, Hurvitz KA; Centers for Disease C and Prevention . Prevalence of hypertension and controlled hypertension—United States, 2007–2010. MMWR Suppl. 2013;62:144–148. [PubMed] [Google Scholar]
- 23. Jamal A, King BA, Neff LJ, Whitmill J, Babb SD, Graffunder CM. Current cigarette smoking among adults—United States, 2005–2015. MMWR Morb Mortal Wkly Rep. 2016;65:1205–1211. [DOI] [PubMed] [Google Scholar]
- 24. Wang DD, Leung CW, Li Y, Ding EL, Chiuve SE, Hu FB, Willett WC. Trends in dietary quality among adults in the United States, 1999 through 2010. JAMA Intern Med. 2014;174:1587–1595. [DOI] [PMC free article] [PubMed] [Google Scholar]
- 25. Flegal KM, Carroll MD, Kit BK, Ogden CL. Prevalence of obesity and trends in the distribution of body mass index among US adults, 1999–2010. JAMA. 2012;307:491–497. [DOI] [PubMed] [Google Scholar]
- 26. Ogden CL, Carroll MD, Fryar CD, Flegal KM. Prevalence of obesity among adults and youth: United States, 2011–2014. NCHS Data Brief. 2015;219:1–8. [PubMed] [Google Scholar]
- 27. Ray WA. Evaluating medication effects outside of clinical trials: new‐user designs. Am J Epidemiol. 2003;158:915–920. [DOI] [PubMed] [Google Scholar]
- 28. Nau DP. Proportion of days covered (PDC) as a preferred method of measuring medication adherence. Available at: http://pqaalliance.org/resources/adherence.asp. Accessed May 22, 2017.
- 29. Choudhry NK, Shrank WH, Levin RL, Lee JL, Jan SA, Brookhart MA, Solomon DH. Measuring concurrent adherence to multiple related medications. Am J Manag Care. 2009;15:457–464. [PMC free article] [PubMed] [Google Scholar]
- 30. Charlson ME, Pompei P, Ales KL, MacKenzie CR. A new method of classifying prognostic comorbidity in longitudinal studies: development and validation. J Chronic Dis. 1987;40:373–383. [DOI] [PubMed] [Google Scholar]
- 31. Quan H, Sundararajan V, Halfon P, Fong A, Burnand B, Luthi JC, Saunders LD, Beck CA, Feasby TE, Ghali WA. Coding algorithms for defining comorbidities in ICD‐9‐CM and ICD‐10 administrative data. Med Care. 2005;43:1130–1139. [DOI] [PubMed] [Google Scholar]
- 32. Spiegelman D, Hertzmark E, Wand HC. Point and interval estimates of partial population attributable risks in cohort studies: examples and software. Cancer Causes Control. 2007;18:571–579. [DOI] [PubMed] [Google Scholar]
- 33. Kim HJ, Fay MP, Feuer EJ, Midthune DN. Permutation tests for joinpoint regression with applications to cancer rates. Stat Med. 2000;19:335–351. [DOI] [PubMed] [Google Scholar]
- 34. Fine JP, Gray RJ. A proportional hazards model for the subdistribution of a competing risk. J Am Stat Assoc. 1999;94:496–509. [Google Scholar]
- 35. Basak R, McCaffrey Iii DJ, Bentley JP, Przybyla SM, West‐Strum D, Banahan BF. Adherence to multiple medications prescribed for a chronic disease: a methodological investigation. J Manag Care Spec Pharm. 2014;20:815–823. [DOI] [PMC free article] [PubMed] [Google Scholar]
- 36. Bramley TJ, Gerbino PP, Nightengale BS, Frech‐Tamas F. Relationship of blood pressure control to adherence with antihypertensive monotherapy in 13 managed care organizations. J Manag Care Pharm. 2006;12:239–245. [DOI] [PMC free article] [PubMed] [Google Scholar]
- 37. Ali MK, Bullard KM, Beckles GL, Stevens MR, Barker L, Narayan KM, Imperatore G. Household income and cardiovascular disease risks in U.S. children and young adults: analyses from NHANES 1999–2008. Diabetes Care. 2011;34:1998–2004. [DOI] [PMC free article] [PubMed] [Google Scholar]
- 38. Kim S, Shin DW, Yun JM, Hwang Y, Park SK, Ko YJ, Cho B. Medication adherence and the risk of cardiovascular mortality and hospitalization among patients with newly prescribed antihypertensive medications. Hypertension. 2016;67:506–512. [DOI] [PubMed] [Google Scholar]
- 39. Wong MC, Tam WW, Cheung CS, Wang HH, Tong EL, Sek AC, Yan BP, Cheung NT, Leeder S, Yu CM, Griffiths S. Drug adherence and the incidence of coronary heart disease‐ and stroke‐specific mortality among 218,047 patients newly prescribed an antihypertensive medication: a five‐year cohort study. Int J Cardiol. 2013;168:928–933. [DOI] [PMC free article] [PubMed] [Google Scholar]
- 40. Degli Esposti L, Saragoni S, Benemei S, Batacchi P, Geppetti P, Di Bari M, Marchionni N, Sturani A, Buda S, Degli Esposti E. Adherence to antihypertensive medications and health outcomes among newly treated hypertensive patients. Clinicoecon Outcomes Res. 2011;3:47–54. [DOI] [PMC free article] [PubMed] [Google Scholar]
- 41. Corrao G, Parodi A, Nicotra F, Zambon A, Merlino L, Cesana G, Mancia G. Better compliance to antihypertensive medications reduces cardiovascular risk. J Hypertens. 2011;29:610–618. [DOI] [PubMed] [Google Scholar]
- 42. Chowdhury R, Khan H, Heydon E, Shroufi A, Fahimi S, Moore C, Stricker B, Mendis S, Hofman A, Mant J, Franco OH. Adherence to cardiovascular therapy: a meta‐analysis of prevalence and clinical consequences. Eur Heart J. 2013;34:2940–2948. [DOI] [PubMed] [Google Scholar]
- 43. Egan BM, Li J, Hutchison FN, Ferdinand KC. Hypertension in the United States, 1999 to 2012: progress toward Healthy People 2020 goals. Circulation. 2014;130:1692–1699. [DOI] [PMC free article] [PubMed] [Google Scholar]
- 44. Holt E, Joyce C, Dornelles A, Morisky D, Webber LS, Muntner P, Krousel‐Wood M. Sex differences in barriers to antihypertensive medication adherence: findings from the cohort study of medication adherence among older adults. J Am Geriatr Soc. 2013;61:558–564. [DOI] [PMC free article] [PubMed] [Google Scholar]
- 45. Kardas P, Lewek P, Matyjaszczyk M. Determinants of patient adherence: a review of systematic reviews. Front Pharmacol. 2013;4:91. [DOI] [PMC free article] [PubMed] [Google Scholar]
- 46. Hughes CM. Medication non‐adherence in the elderly: how big is the problem? Drugs Aging. 2004;21:793–811. [DOI] [PubMed] [Google Scholar]
- 47. Gwadry‐Sridhar FH, Manias E, Lal L, Salas M, Hughes DA, Ratzki‐Leewing A, Grubisic M. Impact of interventions on medication adherence and blood pressure control in patients with essential hypertension: a systematic review by the ISPOR medication adherence and persistence special interest group. Value Health. 2013;16:863–871. [DOI] [PubMed] [Google Scholar]
- 48. Nieuwlaat R, Wilczynski N, Navarro T, Hobson N, Jeffery R, Keepanasseril A, Agoritsas T, Mistry N, Iorio A, Jack S, Sivaramalingam B, Iserman E, Mustafa RA, Jedraszewski D, Cotoi C, Haynes RB. Interventions for enhancing medication adherence. Cochrane Database Syst Rev. 2014;11:CD000011. [DOI] [PMC free article] [PubMed] [Google Scholar]
- 49. Takiya LN, Peterson AM, Finley RS. Meta‐analysis of interventions for medication adherence to antihypertensives. Ann Pharmacother. 2004;38:1617–1624. [DOI] [PubMed] [Google Scholar]
- 50. Viswanathan M, Kahwati LC, Golin CE, Blalock SJ, Coker‐Schwimmer E, Posey R, Lohr KN. Medication therapy management interventions in outpatient settings: a systematic review and meta‐analysis. JAMA Intern Med. 2015;175:76–87. [DOI] [PubMed] [Google Scholar]
- 51. Frieden TR, Berwick DM. The “Million Hearts” initiative—preventing heart attacks and strokes. N Engl J Med. 2011;365:e27. [DOI] [PubMed] [Google Scholar]
Associated Data
This section collects any data citations, data availability statements, or supplementary materials included in this article.
Supplementary Materials
Table S1. Adjusted Hazards Ratios for Risk of CVD, IHD, Stroke/TIA and Heart Failure Events, and Population Attributable Fraction Associated With PDC by Beneficiaries Taking 1 vs 2 or More Antihypertensives, Medicare 2008–2014 Cohort
Table S2. Adjusted Hazards Ratios for Risk of CVD, IHD, Stroke/TIA and Heart Failure Events, and Population Attributable Fraction Associated With First Year PDC, Medicare 2008–2014 Cohort
Table S3. Adjusted Hazards Ratios for Risk of CVD, IHD, Stroke/TIA and Heart Failure Events, and Population Attributable Fraction Associated With Interval‐Based Average PDC, Medicare 2008–2014 Cohort
Figure S1. Adjusted hazard ratios (95% CI) for CVD events (A), IHD (B), stroke/TIA (C), and heart failure events (D) associated with interval‐based average PDC, Medicare 2008–2014 cohort. CVD indicates cardiovascular disease; IHD, ischemic heart disease; PDC, proportion days covered; TIA, transient ischemic attack.