

Abstract
Recent large-scale genetic sequencing efforts have identified rare coding variants in genes in the triglyceride-rich lipoprotein (TRL) clearance pathway that are protective against coronary heart disease (CHD), independently of LDL cholesterol (LDL-C) levels1. Insight into the mechanisms of protection of these variants may facilitate the development of new therapies for lowering TRL levels. The gene APOC3 encodes apoC-III, a critical inhibitor of triglyceride (TG) lipolysis and remnant TRL clearance2. Here we report a detailed interrogation of the mechanism of TRL lowering by the APOC3 Ala43Thr (A43T) variant, the only missense (rather than protein-truncating) variant in APOC3 reported to be TG lowering and protective against CHD3–5. We found that both human APOC3 A43T heterozygotes and mice expressing human APOC3 A43T display markedly reduced circulating apoC-III levels. In mice, this reduction is due to impaired binding of A43T apoC-III to lipoproteins and accelerated renal catabolism of free apoC-III. Moreover, the reduced content of apoC-III in TRLs resulted in accelerated clearance of circulating TRLs. On the basis of this protective mechanism, we developed a monoclonal antibody targeting lipoprotein-bound human apoC-III that promotes circulating apoC-III clearance in mice expressing human APOC3 and enhances TRL catabolism in vivo. These data reveal the molecular mechanism by which a missense variant in APOC3 causes reduced circulating TG levels and, hence, protects from CHD. This protective mechanism has the potential to be exploited as a new therapeutic approach to reduce apoC-III levels and circulating TRL burden.
ApoC-III is a small apolipoprotein (∼8.8 kDa) secreted from the liver and small intestine that circulates on TRLs such as VLDL and chylomicrons, as well as on HDLs. In biochemical studies and experimental animals, apoC-III has been shown to increase plasma TG levels by both direct inhibition of the activity of lipoprotein lipase (LPL) on TRLs and inhibition of the clearance of TRLs by the liver, possibly through competitive interactions with apoE, a critical ligand on TRLs for receptor-mediated clearance of TRLs6–9. In an early study using a mouse model of delayed apoB clearance due to LDL receptor deficiency, human apoC-III overexpression increased circulating TRL levels and exacerbated the development of atherosclerosis10, providing initial support for the notion that apoC-III may be a positive mediator of CHD risk.
In humans, several studies of the metabolism of TRLs have implicated apoC-III as a critical contributor to hypertriglyceridemia11–14. Dyslipidemia, metabolic syndrome, insulin resistance, visceral adiposity, chronic renal insufficiency, and several other systemic metabolic diseases are associated with elevated apoC-III levels, which may be due to both increased apoC-III production and apoC-III secretion on VLDL15–18, as well as to delayed TRL clearance11–14. ApoC-III exchanges rapidly among TRLs, lipoprotein remnants, and HDLs in humans19,20, which has made accurate assessment of the kinetics and metabolism of apoC-III in humans challenging14,21,22. Some studies have identified apoC-III on LDLs as a marker of a small, dense proath-erogenic phenotype for LDL23,24. ApoC-III has also been identified as a constituent of lipoprotein(a) and may alter the metabolism of this lipoprotein particle through as-yet-undetermined mechanisms25. Analyses of plasma apoC-III levels and lipoprotein-subfraction-associated apoC-III levels have suggested a direct relationship between apoC-III levels in the circulation and cardiovascular events26,27, although large prospective studies verifying this relationship have yet to be reported. Moreover, multiple lipid-lowering drugs, such as statins, fenofibrates, and pioglitazone, potently reduce circulating apoC-III plasma levels through either reducing apoC-III production or increasing its clearance2,28.
Genetic discoveries of the last decade have highlighted the potential importance of apoC-III to CHD risk in humans. Genome-wide association studies (GWAS) have demonstrated that common noncoding polymorphisms in APOC3 are associated with the levels of plasma TG, HDL cholesterol (HDL-C), and non-HDL-C, as well as with CHD risk29. In 2008, the Lancaster Amish were reported to have a relatively high frequency of a truncating variant in APOC3, Arg19Ter (R19*), associated with reduced levels of serum apoC-III, reduced fasting and postprandial TG levels, and reduced coronary artery calcification, a surrogate measure of coronary atherosclerosis5. More recently, two large sequencing efforts3,4 have identified several rare coding variants in APOC3 associated, in aggregate, with a ∼40% reduction in TG levels and a similar magnitude of reduction in the risk of CHD3,4. These efforts identified four protective APOC3 variants, of which three were classic loss-of-function variants: a nonsense variant (R19*) and two splice-site variants (IVS2+1G>A and IVS3+1G>T). Of these variants, the R19* variant is predicted to disrupt protein expression through premature termination, and the two splice-site variants are predicted to abolish splice-donor sites and cause retention of adjacent introns by altering the RNA thermodynamic properties required for processing (Supplementary Table 1). In contrast, the fourth APOC3 variant identified was a missense variant (A43T; also known as A23T on the basis of amino acid sequence numbering for the mature form of the protein). When grouped together, carriers of any of these variants displayed significantly lower apoC-III and TG levels, as compared to non-carriers.
These genetic data suggested that reducing circulating apoC-III levels might be a therapeutic approach to reduce circulating TRL levels and CHD risk. Indeed, an antisense oligonucleotide targeting APOC3 mRNA—in essence mimicking the loss-of-function mutations—has been shown to reduce apoC-III and TG levels in preclinical models30 and in humans with hypertriglyceridemia31. On the basis of these results, we hypothesized that intensive investigation of the mechanism of protection by the missense variant A43T might offer insights into alternative therapeutic approaches to reduce apoC-III levels.
To better understand the specific phenotypic consequences of the A43T variant, we searched for A43T carriers using exome-wide genotyping. Because carriers of APOC3 loss-of-function variants have been reported to have high HDL-C levels, we hypothesized that these variants, including A43T, would be enriched in frequency in individuals with extremely high HDL-C levels. We genotyped for the A43T variant in 1,056 participants of the Penn High HDL-C study (HHDL), a cohort of individuals whose HDL-C levels are above the 90th percentile of the general population, and identified 13 A43T carriers (all heterozygous). We also genotyped a cohort of 5,744 individuals with a normal HDL-C distribution, from the Penn Medicine BioBank, and identified an additional six A43T carriers (all heterozygous). These results indicate that the A43T variant was present at a significantly higher frequency in the cohort with high HDL-C versus the one with a normal HDL-C distribution (1.2% versus 0.1%, P < 0.0001, Fisher's exact test; Fig. 1a). Using the 19 A43T carriers and 76 non-carrier controls matched by age, sex, and ancestry (Online Methods), we examined the levels of plasma lipids and apolipoproteins, including measurements that had not been previously made in the few earlier studies of this variant, such as measurements of apoA-I, non-HDL-C, and apoB levels. APOC3 A43T heterozygotes displayed decreased fasting TG levels (Fig. 1b) and increased apoA-I and HDL-C levels (Supplementary Fig. 1a,b), but no significant differences in LDL-C, non-HDL-C, or apoB levels (Supplementary Fig. 1c–e). In addition, A43T carriers displayed significantly reduced levels of plasma apoC-III that were approximately 50% of those measured in non-carriers (Fig. 1c). As the A43T variant is not predicted to have an impact on RNA binding, splicing, or expression of APOC3 mRNA (Supplementary Table 1), we next investigated the mechanism responsible for the lower circulating apoC-III levels observed in the heterozygous A43T carriers.
Figure 1.

Human APOC3 A43T carriers exhibit lower apoC-III levels than non-carriers. (a) APOC3 A43T carriers were identified from exome-wide genotyping in the HHDL and Penn Medicine BioBank cohorts. The significance of the difference in A43T carrier frequency between the two cohorts was assessed by a Fisher's exact test. (b) TG concentration in overnight-fasted plasma of A43T carriers versus age-, sex-, and ancestry-matched controls (non-carriers) from the two cohorts. (c) Total apoC-III concentration in fasting plasma from A43T carriers and non-carrier controls. (d) A43T apoC-III concentrations in plasma samples of non-carriers and A43T carriers. (e) WT apoC-III concentrations in plasma samples of non-carriers and A43T carriers. (f) The mutant:WT apoC-III ratio of non-carriers and A43T carriers was compared to an expected ratio of 1:1 for no imbalance by a one-sample t test with an expected mean of 1.0. For b and c, n = 19 for A43T carriers and 76 for matched non-carriers. For d–f, n = 19 for A43T carriers and 21 for matched non-carriers. All measurements in b–f were replicated twice in the same plasma samples. All measurements are shown as mean ± s.d., and each data point depicts a single measure from an individual human participant plasma sample. **P < 0.01, ***P < 0.001, ****P < 0.0001, Student's unpaired two-sided t test. For f, ****P < 0.0001, one-sample t test.
To quantify the relative concentrations of mutant and wild-type (WT) apoC-III in the plasma of A43T heterozygotes, we developed a sequence-specific liquid chromatography and tandem mass spectrometry (LC–MS/MS) assay (illustrated in Supplementary Fig. 2). The LC–MS/MS assay measures peptides generated by proteolytic digestion of plasma with the endoproteinase AspN, followed by oxidation of methionine residues with hydrogen peroxide. Selective reaction monitoring was used to measure the relative abundance of peptides (DASL LSFMoxQGYMoxKHATKTAK and DASLLSFMoxQGYMoxKHATKTTK, where the variant residue is underlined), corresponding to the WT and mutant forms of apoC-III, respectively, that contain alanine (Supplementary Fig. 3a) or threonine (Supplementary Fig. 3b) at position 43 of the protein sequence. Internal-standard peptides, synthesized with isotopically labeled leucine, were added to each sample to facilitate quantification of WT and mutant apoC-III protein over a range of concentrations, based on comparison of the product ion intensities for the light versus heavy peptide (Supplementary Fig. 4 and Supplementary Tables 2 and 3). Using this assay, A43T carrier plasma contained clearly detectable levels of A43T mutant apoC-III peptide, whereas non-carrier plasma did not (Fig. 1d). Additionally, the levels of WT apoC-III were substantially lower in the plasma of the A43T carriers than in non-carriers (Fig. 1e). Notably, in A43T carriers, the levels of mutant apoC-III were markedly lower than those of WT apoC-III, as assessed by the ratio of peptide abundance, with a mutant:WT ratio of 0.14:1 (as compared with the expected 1:1 ratio anticipated for heterozygotes) (Fig. 1f). This result indicates that a significant imbalance exists in the ratio of circulating mutant to WT apoC-III in the plasma of A43T carriers (P < 0.0001, one-sample t test).
To study the mechanism underlying the reduced levels of circulating mutant and total apoC-III in A43T carriers, we developed a mouse model using administration of adeno-associated virus (AAV) vectors encoding either WT or A43T human APOC3. AAV-mediated WT APOC3 expression caused a dose-dependent elevation in circulating human apoC-III levels, as well as an increase in plasma TG levels (Supplementary Fig. 5). A dose of 3 × 10¹¹ genome copies (GC) of the AAV encoding WT APOC3 resulted in circulating human apoC-III levels of 10–15 mg/dl, mirroring the range of normal apoC-III concentrations in humans, and also significantly increased fasting TG levels (Supplementary Fig. 5). We therefore used this AAV dose to compare the effects of WT and A43T APOC3 expression in subsequent experiments. Although the effects on TG metabolism of WT and mutant apoC-III expression using this approach may not correspond to the effects of endogenous WT and mutant apoC-III expression, this approach allowed us to compare the relative effects of WT versus mutant apoC-III in multiple normolipidemic and hyperlipidemic models, including WT mice, Apoc3-knockout mice, and several ‘humanized’ hyperlipidemic models, with relatively consistent levels of circulating apoC-III across these models (Supplementary Table 4).
Administration of WT and A43T APOC3 AAV at the selected dose conferred equal hepatic AAV vector DNA levels and APOC3 transcript expression (Fig. 2a,b). Despite equal mRNA levels, WT APOC3 expression raised fasting plasma TG levels, whereas A43T APOC3 expression did not affect fasting plasma TG levels in all mouse models studied (Fig. 2c–e and Supplementary Table 4). For example, in WT mice coexpressing human cholesteryl ester transfer protein (CETP), a key mediator of lipid exchange between TRLs and HDL in humans, which is absent in rodents, WT apoC-III expression raised TG and non-HDL-C levels and reduced HDL-C levels, whereas A43T apoC-III expression had no effect on TG, non-HDL-C, or HDL-C levels (Fig. 2e–g). This difference between the groups expressing WT and A43T apoC-III in WT mice coexpressing CETP was confirmed using lipoprotein fractions isolated from plasma by fast protein liquid chromatography (FPLC) (Fig. 2h,i). In addition to elevated HDL-C levels, A43T-expressing mice displayed reduced VLDL-TG and VLDL-C levels. The overall atheroprotective phenotype in this humanized model thus partially recapitulates the findings observed in human carriers of the A43T variant, who display reduced TG and increased HDL-C levels.
Figure 2.
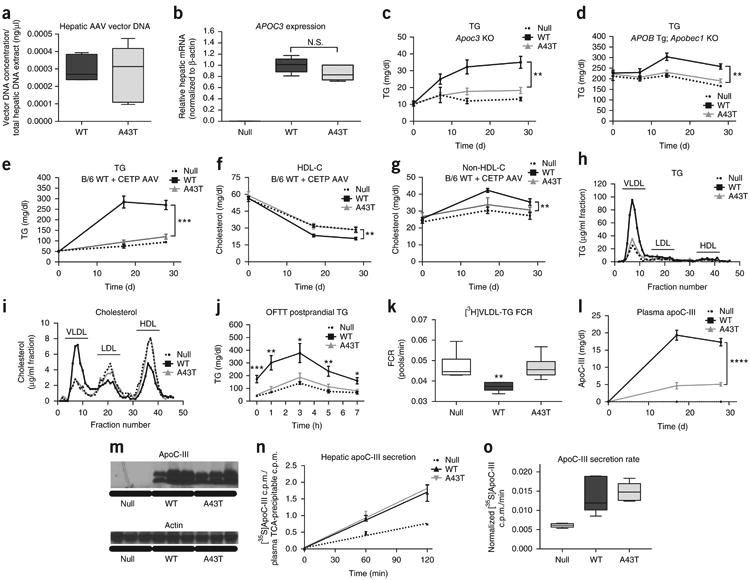
Mice expressing APOC3 A43T have reduced TRL and circulating apoC-III levels. (a) Hepatic AAV vector levels, as assessed by qRT–PCR for the rabbit β-globin poly(A) sequence, from 25 mg of liver tissue from mice treated with WT or A43T APOC3 AAV. (b) Hepatic APOC3 mRNA levels (normalized to those of actin) in mice treated with WT or A43T APOC3 AAV. (c) Fasting plasma TG concentrations in Apoc3-knockout mice treated with Null, WT APOC3, or A43T APOC3 AAV at the indicated time points after AAV injection. (d) Fasting plasma TG concentrations in human-APOB-transgenic/Apobec1-knockout mice treated with the indicated AAVs. (e–g) Fasting plasma TG concentrations (e), plasma HDL-C concentrations (f), and plasma non-HDL-C concentrations (g) in WT mice treated with the indicated AAVs and co-treated with AAV encoding human CETP. (h,i) TG (h) and cholesterol (i) concentrations in FPLC-separated plasma fractions from day 28 plasma from the mice in e–g. Lipoprotein fractions are indicated above the fraction numbers. (j) Postprandial TG concentrations in Apoc3-knockout mice treated with the indicated AAVs and co-treated with AAV encoding human CETP, following olive oil gavage (OFTT, oral fat tolerance test). (k) Plasma [3H]TRL-TG FCR in WT mice treated with the indicated AAVs, 2 h after intravenous administration of [3H]triolein-labeled human TRLs. (l) Fasting plasma apoC-III concentrations in mice from e–g. (m) Immunoblots for apoC-I II using total protein from liver lysates of WT mice, 28 d after AAV administration. β-actin was used as a loading control. Cropped immunoblots are shown; corresponding uncropped blots are shown in Supplementary Figure 8. (n) Hepatic apoC-III secretion in WT mice treated with the indicated AAVs, 35 d after AAV administration and after treatment with [35S]methionine tracer. ApoC-III secretion is defined as [35S]methionine radioactivity in apoC-III bands isolated from protein electrophoresis, normalized to [35S]methionine radioactivity in total TCA-precipitable protein from 2 μl of plasma. (o) ApoC-III secretion rates as measured by the slope of the curves in n. In c, data are shown from n = 5 Null mice, n = 7 WT mice, and n = 7 A43T mice. In a, b, d–g, and j–l, data are shown from n = 6 mice in each group. In n and o, data are shown from n = 5 mice from each group. Data show results from one representative experiment, and all experiments were repeated once in independent respective cohorts of mice. For data in a, b, k, and o, box length spans the 25th to 75th percentile range of the data points, with the middle line indicating the median and whiskers indicating the minimum and maximum values for the given data set. All other measurements show mean ± s.e.m. All data points represent measures from individual mice from a single experiment, and data in all panels were replicated in two independent experiments. *P < 0.05, **P < 0.01, ***P < 0.001, ****P < 0.0001, two-way ANOVA, WT versus A43T group; N.S., not significant.
We next assessed LPL-mediated TG clearance in Apoc3-knockout mice coexpressing CETP and either WT or A43T APOC3 by measuring TG levels after intragastric administration of olive oil. Mice expressing WT APOC3 demonstrated significantly delayed postprandial TG clearance relative to control mice treated with Null virus (Fig. 2j). In contrast, mice expressing A43T APOC3 exhibited no increase in postprandial TG levels relative to control mice. This relative difference between mice expressing WT and A43T APOC3 was abolished when this experiment was repeated in the presence of intravenous Poloxamer P407 (Pluronic), a potent competitive inhibitor of LPL (Supplementary Fig. 6a), suggesting that differences in the ability of A43T and WT apoC-III to inhibit LPL account for their differential effects on postprandial TG clearance. To assess the contribution of post-absorptive TG clearance to the observed plasma TG phenotype, we administered [3H]triolein-labeled TRLs to WT mice expressing APOC3. Similarly to the results for postprandial TG clearance, we observed a significantly faster catabolic rate of TRL-TG clearance in mice expressing A43T APOC3 than in those expressing WT APOC3 (Fig. 2k). Notably, we did not observe differential effects of WT versus A43T APOC3 expression on chylomicron formation in the postprandial state, as assessed by appearance of 3H-labeled retinyl esters in plasma after [3H]retinol and olive oil gavage (Supplementary Fig. 6b). Some previous reports have suggested that apoC-III may also increase circulating TG levels by promoting hepatic VLDL-TG secretion by facilitating the fusion of cytoplasmic TG droplets with nascent VLDL particles32. To test this possibility, we measured VLDL-TG secretion into blood in mice after administration of Poloxamer P407 (Sigma-Aldrich)33, but found no differences in TG, apoB-100, or apoB-48 secretion rates in mice expressing A43T apoC-III versus WT apoC-III or Null virus (Supplementary Fig. 7). Collectively, these data indicate that WT but not A43T apoC-III impairs the in vivo lipolysis of postprandial TRLs.
Despite equal hepatic apoC-III mRNA expression in mice expressing WT versus A43T apoC-III, WT mice coexpressing CETP that were infected with A43T APOC3 AAV displayed markedly reduced steady-state levels of apoC-III in plasma relative to mice infected with WT APOC3 AAV (Fig. 2l). Because we also observed a reduced amount of A43T apoC-III in the plasma of human A43T carriers as compared to non-carriers, we explored apoC-III production and metabolism in WT mice. Mice expressing WT and A43T apoC-III had equivalent levels of total hepatic apoC-III protein, as assessed by immunoblotting (Fig. 2m and Supplementary Fig. 8). To determine whether the A43T variant affected apoC-III secretion from the liver, we administered [35S]methionine and measured the secretion of newly synthesized, metabolically labeled apoC-III into the circulation. There was no difference in the secretion rate of WT mice expressing A43T as compared to those expressing WT apoC-III (Fig. 2n,o).
Because the secretion rates for WT and A43T apoC-III did not differ, we tested the hypothesis that A43T apoC-III is more rapidly catabolized than WT apoC-III. Apobec1-knockout mice expressing WT or A43T APOC3 were administered [125I]tyramine cellobiose (TC)-modified WT or A43T apoC-III protein, respectively, after pre-incubation with plasma from the corresponding mice. A43T apoC-III exhibited markedly increased catabolism as compared to WT apoC-III (Fig. 3a), with a >3-fold increase in the fractional catabolic rate (FCR) (Fig. 3b). These results were also observed in WT mice administered 125I-labeled apoC-III protein without the TC modification (Supplementary Fig. 9a,b), suggesting that the observed differences in catabolism were not a result of conformational changes caused by the TC moiety.
Figure 3.

The A43T substitution promotes circulating apoC-III clearance and renal uptake by perturbing apoC-III binding to lipoproteins. (a) Plasma [125I]TC-modified WT or A43T apoC-III clearance in human-APOB-transgenic/Apobec1-knockout mice over the course of 24 h. Mice treated with WT APOC3 AAV were administered [125I]TC-modified WT apoC-III, and those treated with A43T APOC3 AAV were administered [125I]TC-modified A43T apoC-III. Normalized 125I activity relative to plasma activity at 1 min is shown. (b) FCR of the plasma [125I]TC-modified apoC-III shown in a. (c) Hepatic [125I]TC activity in 30 mg of tissue for the mice in a. Activity was normalized to activity at 1 min. (d) Renal [125I]TC activity in 30 mg of tissue from the mice in a. (e) 125I activity in FPLC fractions of pooled plasma from each experimental group described in a, at 1 min. Activity is expressed as the fraction of total activity in plasma before FPLC separation. (f) 125I activity in FPLC fractions after incubation of 125I-labeled WT or A43T apoC-III (1 μg) with human plasma (200 μl) for 1 h at 37 °C. Data refer to a representative experiment and were replicated three times in independent experiments. (g) Percentage of total plasma 125I activity in VLDL fractions versus unbound protein fractions after incubation of 125I-labeled WT or A43T apoC-III (1 μg) with isolated human VLDL (100 μg of protein) for 1 h at 37 °C. Points represent the percentage of 125I activity in fractions from one representative experiment of three experimental samples. (h) Percentage of total 125I activity in HDL fractions versus unbound protein fractions after incubation of 125I-labeled WT versus A43T apoC-III (1 μg) with isolated human HDL (200 μg of protein) for 1 h at 37 °C. Points indicate the 125I activity in fractions from one representative experiment of three experimental samples. (i) Dissociation constant (Kd) from measurement of association and dissociation rate constants for binding of WT or A43T apoC-III to dimyristoylphosphatidylcholine surfaces by surface plasmon resonance. Points indicate observed Kd from a representative experiment of three replicate experimental samples. For a–d, n = 6 mice per group. Data in e show n = 1 pooled sample for each group of n = 6 mice in a–d. For f–i, results show the mean of three technical replicate experiments for each panel. Data were replicated by an independent repeat experiment. For data in b–d, box length spans the 25th to 75th percentile range of the data points, with the middle line indicating the median and whiskers indicating the minimum and maximum values for the given data set. All other measurements show mean ± s.e.m. where appropriate. *P < 0.05, **P < 0.01, Student's unpaired two-tailed t test; ****P < 0.0001, two-way ANOVA (a); ****P < 0.0001, Student's unpaired t test (b).
ApoC-III clearance is thought to occur largely through two pathways: receptor-mediated remnant lipoprotein clearance by the liver and filtration of unbound apoC-III by the kidney17,34–36. However, the relative contributions of these two clearance pathways and how they affect the functional pool of circulating apoC-III that promotes TRL retention remain unclear. We compared tissue uptake of [125I]TC-modified WT and A43T apoC-III into the liver and kidney 24 h after injection and found that A43T apoC-III was cleared ∼40% less by the liver and ∼40% more by the kidney as compared to WT apoC-III (Fig. 3c,d). Additional clearance studies with [125I]apoC-III lacking the TC moiety confirmed that the WT and A43T proteins were degraded and that the degradation products of the A43T protein were cleared into the urine at a substantially higher rate than those of the WT protein (Supplementary Fig. 9c–f). Indeed, in mice injected with labeled A43T apoC-III protein, TCA-precipitable 125I counts in the plasma at 1 min, 3 h, and 6 h after injection were significantly lower than those in mice injected with WT apoC-III (Supplementary Fig. 9g,h). These data suggest that the mutant protein is degraded more rapidly than the WT protein, and that [125I]tyrosine-labeled degradation products are filtered by the kidney and excreted.
The predicted helical structure of apoC-III places the A43 residue on the hydrophobic face of an α-helix that mediates binding to lipids32 (Supplementary Fig. 10). We hypothesized that the substitution of a hydrophilic threonine residue for the relatively more hydrophobic alanine residue at this position could impair lipoprotein binding, leading to a relative increase in non-lipoprotein-bound, ‘free’ apoC-III that is more rapidly cleared. To test this, we fractionated plasma from mice administered [125I]TC-modified WT or A43T apoC-III protein and measured the distribution of apoC-III in lipoprotein. In comparison with WT apoC-III, much less A43T apoC-III was bound to TRL and HDL, and relatively more was found in the lipoprotein-free fraction (Fig. 3e). Consistent with these findings, A43T apoC-III exhibited significantly reduced binding to TRL and HDL and increased presence in the free form after in vitro incubation with human plasma at 37 °C, as compared to WT apoC-III (Fig. 3f and Supplementary Fig. 11a–c). We also tested apoC-III binding to isolated human lipoproteins and lipid emulsions. In comparison to WT apoC-III, A43T apoC-III exhibited significantly reduced binding to TRLs (Fig. 3g and Supplementary Fig. 11d), HDLs (Fig. 3h and Supplementary Fig. 11e), and apolipoprotein-free lipid emulsions (Supplementary Fig. 11f,g), suggesting that the binding defect exhibited by A43T apoC-III is related to its interaction with lipid surfaces. Consistent with this notion, we found that, as compared to WT apoC-III, A43T apoC-III exhibited a ∼4-fold higher dissociation constant for binding to an immobilized surface of phospholipids in vitro, as assessed by surface plasmon resonance (Fig. 3i). The A43T mutant was also less capable than WT apoC-III of inhibition of LPL activity on large TG-rich emulsions in vitro (Supplementary Fig. 12a,b) and an Intralipid TG substrate (2.7-fold increased half-maximal inhibitory concentration (IC50) for A43T as compared to WT apoC-III, P < 0.001, Student's unpaired t test; Supplementary Fig. 12c,d).
On the basis of these data, we postulated that it might be possible to use monoclonal antibodies to lipid-associated human apoC-III to therapeutically target apoC-III by promoting its dissociation from lipoproteins and clearance. We accordingly generated a set of humanized monoclonal antibodies and screened them for their ability to inhibit apoC-III function, as assessed by abrogation of the inhibitory effect of human apoC-III on DiI-labeled VLDL uptake by HepG2 hepatocytes. One of the antibodies tested, STT505, potently abrogated human apoC-III function in this assay (Supplementary Fig. 13a) and had no cross-reactivity to mouse apoC-III (data not shown). In WT mice expressing human WT APOC3, a single intravenous dose of STT505 (25 mg of IgG per kg body weight) resulted in a robust (∼75%) reduction in plasma apoC-III levels at 4 h after administration, relative to saline-administered mice (Fig. 4a–c and Supplementary Fig. 13b,c). This reduction in plasma apoC-III levels was maintained over the course of 7 h after dosing; at 24 h after administration, a reduction of ∼34% was still observable. The reduction in plasma apoC-III levels was also associated with a concomitant reduction in circulating apoB levels over the course of 24 h after antibody administration (Fig. 4d and Supplementary Fig. 13d). Human-APOC3-expressing mice gavaged with olive oil immediately after administration of STT505 displayed a robust suppression in postprandial plasma apoC-III (Fig. 4e,f) and TG (Fig. 4g,h) levels, suggesting that the reduced levels of circulating apoC-III following antibody administration result from enhanced postprandial TG clearance.
Figure 4.
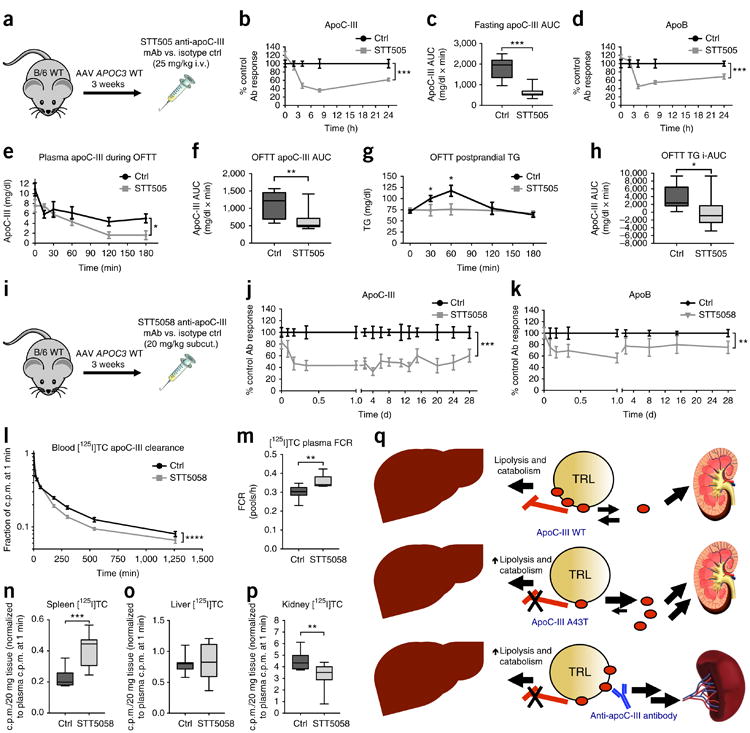
Anti-human-apoC-III monoclonal antibodies STT505 and STT5058 lower circulating apoC-III levels and promote TRL clearance. (a) Schematic of the experimental approach, in which the STT505 monoclonal antibody (mAb) or isotype control (ctrl) antibody was tested in C57BL/6 WT (B/6 WT) mice treated with WT APOC3 AAV for 3 weeks. (b) Plasma apoC-III levels over the course of 24 h following antibody administration. Values for the STT505 group are expressed as percentages of those for the control antibody group at the same time point. (c) Plasma apoC-III areas under the curve (AUCs) per mouse for each group in b. (d) Plasma apoB concentrations in mice from b over the course of 24 h. Values for the STT505 group are expressed as percentages of those for the control antibody group at the same time point. (e) Plasma apoC-III concentrations in mice after control or STT505 antibody administration and subsequent intragastric gavage of olive oil. (f) Plasma apoC-III AUCs per mouse for each group in e. (g) Postprandial plasma TG concentrations for the mice in e. (h) Postprandial TG elevation as measured by incremental AUC (i-AUC) per mouse for the groups in e. For i-AUCs, AUCs were calculated relative to a baseline defined as the mean plasma TG at time 0 for all mice in both the control and STT505 groups (72.74 mg/dl). (i) Schematic of the experimental approach, in which the STT5058 monoclonal antibody was tested in WT mice treated with WT APOC3 AAV for 3 weeks. (j,k) Plasma apoC-III (j) and apoB (k) levels over the course of 28 d following antibody administration. Values for the STT5058 group are expressed as percentages of those for the control antibody group at the same time point. (l) Clearance of [125I]TC-modified apoC-III in WT mice that had been treated with APOC3 AAV 3 weeks before administration of STT5058 or control antibody (25 mg/kg subcutaneous dosing), followed 24 h later by intravenous administration of [125I]TC-modified WT apoC-III. Clearance of radiolabeled apoC-III was measured over the course of 21 h. (m) FCR of [125I]TC-modified apoC-III estimated from clearance curves in mice treated with STT5058 versus isotype control antibody. (n–p) Uptake of radiolabeled apoC-III in 20 mg of spleen (n), liver (o), or kidney (p) tissue 21 h after protein administration (values were normalized to plasma activity at 1 min for each mouse). (q) Proposed model of the contribution of TRL-associated apoC-III to TRL clearance. Top, WT apoC-III is bound to TRLs and is capable of inhibiting lipolysis and catabolism of circulating TRLs; a smaller pool of lipoprotein-free apoC-III may be cleared renally. Middle, A43T apoC-III has impaired binding to lipoproteins, augmenting apoC-III clearance by the kidney and promoting TRL lowering. Bottom, the STT505 and STT5058 monoclonal antibodies targeting apoC-III promote clearance of circulating apoC-III partially through an alternative splenic pathway, resulting in TRL lowering. For b and d, n = 7 mice per group. For c and f, n = 8 mice per group. For e, n = 9 mice in the control group and 10 mice in the STT505 group. Each experiment was replicated in an independent group of mice. For g and h, n = 10 mice in the control group and 9 mice in the STT505 group. For j and k, n = 7 mice for each group. Each experiment was replicated once in an independent group of mice. For l–p, n = 10 mice in each group. Each experiment in l–p was performed in one cohort of mice. All data show measures from individual mice. For data in c, f, h, and m–p, box length spans the 25th to 75th percentile range of the data points, with the middle line indicating the median and whiskers indicating the minimum and maximum values for the given data set. All other measurements show mean ± s.e.m. where appropriate. For b, d, e, and j–l, *P < 0.05, **P < 0.01, ***P < 0.001, ****P < 0.0001, two-way ANOVA. For c, f–h, and m–p, *P < 0.05, **P < 0.01, ***P < 0.001, Student's unpaired two-tailed t test.
To extend the duration of the efficacy of STT505 in reducing circulating apoC-III levels, we attempted to develop a version of STT505 that has high affinity to apoC-III at pH 7.4 but that dissociates from its antigen at acidic pH, such that it could be recycled from intracellular endosomes. To achieve this, we replaced two residues in the complementarity-determining region of STT505 with histidine residues. Administration of this antibody, STT5058, to mice expressing WT APOC3 (25 mg of IgG per kg body weight, subcutaneously) resulted in a sustained ∼40–60% lowering of circulating apoC-III levels, as observed over the course of 28 d after a single dose (Fig. 4i,j and Supplementary Fig. 13e). This antibody achieved almost tenfold higher plasma IgG levels than the STT505 antibody, and STT5058 plasma levels were maintained for 20 d after administration of a single dose (Supplementary Fig. 13f). STT5058 administration also resulted in a ∼25% reduction in circulating apoB levels over the course of 28 d (Fig. 4k and Supplementary Fig. 13g). To better understand how STT5058 treatment led to a sustained reduction in circulating apoC-III levels, we measured the turnover of [125I]TC-modified WT apoC-III protein over the course of 21 h in APOC3-expressing mice treated with either STT5058 or control antibody 24 h before iodinated apoC-III administration. STT5058-treated mice displayed accelerated clearance of radiolabeled apoC-III, which was most notable at 1 h after radi-olabeled apoC-III administration (Fig. 4l,m). At 21 h after [125I]TC apoC-III administration, we measured the uptake of labeled apoC-III into the liver, kidney, and spleen and found a marked, ∼2-fold increase in splenic uptake in mice treated with STT5058 antibody relative to those treated with control antibody (Fig. 4n). In contrast, we found no difference in hepatic clearance of [125I]TC-modified apoC-III between mice treated with STT5058 antibody and control antibody and decreased renal clearance in STT5058-treated mice (Fig. 4o,p). These data suggest that the STT5058 antibody lowers circulating apoC-III through enhancement of apoC-III clearance from the circulation that can be partially explained by increased splenic uptake and results in a sustained reduction in steady-state apoC-III levels.
Taken together, our data reveal how the naturally occurring APOC3 A43T missense variant and an anti-apoC-III monoclonal antibody each reduce circulating apoC-III levels and, thereby, TRL levels (Fig. 4q). Our results have several implications regarding the mechanisms by which apoC-III is metabolized that are relevant to the therapeutic targeting of apoC-III. Previous studies of apoC-III kinetics in limited numbers of human subjects who were administered apoC-III labeled with stable isotopes have suggested a complex metabolism of circulating apoC-III (ref. 22). Here we show that the kidney and liver are the predominant mediators of both WT and A43T apoC-III uptake from the circulation in mice. Furthermore, through study of the A43T variant that promotes apoC-III dissociation from lipoproteins in vivo, we show that decreased apoC-III binding to lipoproteins increases the pool of free apoC-III and augments apoC-III catabolism, thus reducing circulating apoC-III levels. In particular, we found that the kidney is a major site of apoC-III degradation, suggesting that glomerular filtration of free apoC-III and subsequent proximal tubular cell degradation are likely critical mediators of apoC-III clearance. In contrast, hepatic apoC-III clearance is postulated to occur via internalization of TRLs and remnants that carry apoC-III (refs. 6,36). TRL-bound apoC-III has previously been demonstrated to inhibit the clearance of these particles by the liver through the LDL receptor and related receptors of the same family. Our studies using monoclonal antibodies targeting apoC-III support the notion that alternative, non-renal pathways of apoC-III clearance might also be leveraged to lower apoC-III and thereby TRL levels. The physiological fate of the apoC-III cleared by these antibodies is an important area for future study, as are the consequences of antibody-mediated apoC-III lowering on TRL production, remodeling, and turnover in vivo.
This work provides a paradigmatic example of how rare genetic variants can inform on protective mechanisms for drug development. Specifically, the discovery that A43T mutant apoC-III impairs lipo-protein binding and promotes plasma apoC-III catabolism led us to the notion that a therapeutic antibody could mimic this phenomenon. This strategy is similar to that taken for antibody targeting of PCSK9 to reduce LDL-C levels, a therapeutic approach that emerged from human genetics studies of nonsynonymous PCSK9 coding variants37. Several other nonsynonymous variants in genes regulating the LPL pathway of TRL clearance such as ANGPTL4 (refs. 38,39) and APOA5 (ref. 40) have recently been identified through similar large sequencing efforts, providing additional potential opportunities for clinical translation through exploration of the underlying mechanisms by which these variants alter protein function.
Methods
Methods, including statements of data availability and any associated accession codes and references, are available in the online version of the paper.
Online Methods
Ethics statement
This study was performed in accordance with the principles of the Declaration of Helsinki, and all procedures were approved by the Institutional Review Board (IRB) of the Perelman School of Medicine at the University of Pennsylvania. All participants provided written informed consent.
Human subject identification and ascertainment
Human participants were recruited from two independent cohorts for ascertainment of APOC3 loss-of-function variants and subsequent phenotyping. The first cohort, the Penn High HDL Study (HHDL), is a cross-sectional study of heritable factors contributing to elevated levels of HDL-C. Participants were recruited with HDL-C levels greater than the 95th percentile for age and sex by physician referrals or through the Hospital of the University of Pennsylvania clinical lipid laboratory. Relatives of probands with high HDL-C were also invited to participate in the study. Participants were consented for additional plasma lipid analysis and research genetic studies including targeted sequencing of candidate genes, exome sequencing, and SNP array genotyping under a protocol approved by the IRB of the University of Pennsylvania. Over 2,500 participants have been recruited for the HHDL study, with recruitment ongoing. The second cohort, the Penn Medicine BioBank, is a collection of banked plasma samples from participants who were treated at the University of Pennsylvania Health System and were consented for genetic analysis and biochemical studies of collected plasma for the study of heritable risk factors and novel biomarkers related to CHD risk. Approximately 50,000 participants have been recruited so far, with recruitment of additional participants ongoing through IRB-approved protocols of the University of Pennsylvania. Demographic characteristics for carriers and non-carriers from each identification cohort were as follows: Penn Medicine BioBank cohort: A43T carriers: n = 6, female n = 2, male n = 4, age = 61.7 ± 11.9 years, Caucasian n = 5, African-American n = 1; non-carriers: n = 54, female n = 18, male n = 36, age = 60.2 ± 6.6 years, Caucasian n = 48, African-American n = 6; HHDL cohort: A43T carriers: n = 13, female n = 11, male n = 2, age = 60.4 ± 9.58 years, Caucasian n = 12, African-American n = 1; non-carriers: n = 22, female n = 18, male n = 4, age = 60.9 ± 10.1 years, Caucasian n = 18 African-American n = 4. Age is expressed as mean ± s.d. for each group.
For both studies, genomic DNA was isolated from whole blood from participants and prepared for genotyping using the Exome Chip SNP genotyping array (Human Exome BeadChip v1.0, Illumina). The Exome Chip is a commercially available platform that contains more than 240,000 previously identified SNP markers, mostly corresponding to coding regions across the genome that are derived from variants found two or more times across more than one data set among 23 unique data sets of >12,000 exome or whole-genome sequences41. In particular, the Exome Chip includes the APOC3 A43T (rs147210663) variant. After removing subjects from analysis for whom genotyping quality control measures failed or for whom demographic covariates were not available, a total of 1,056 participants from the HHDL study and 5,744 subjects from the Penn Medicine BioBank cohort were genotyped. APOC3 A43T variant genotypes identified using Exome Chip genotyping were confirmed by Sanger sequencing, as follows. A 674-bp fragment of the APOC3 gene sequence was amplified by PCR from 200 ng of genomic DNA from identified variant carriers using the following oligonucleotide primers: F 5′-CTCCTTCTGGCAGACCCAGCTAAGG-3′, R 5′-CCTAGGACTGCTCCGGGGAGAAAG-3′. PCR products were purified using a QIAquick PCR purification kit (Qiagen) and Sanger sequenced by Genewiz. Sequence chromatograms were aligned to the APOC3 reference sequence in NCBI using Sequencher (Gene Codes).
Lipid phenotyping of human participants
Plasma samples of carriers of the APOC3 A43T coding variant, along with plasma samples of non-carriers from the same identification cohorts matched for age, sex, and ancestry, were selected for lipid analysis. The number of non-carrier samples analyzed was chosen on the basis of a power estimate for identifying a 50% difference in plasma apoC-III levels, with an s.d. equivalent to the difference in means. From this estimate, a minimum of 16 carriers and 16 non-carriers were required for the analysis. Given the identification of 19 A43T carriers, we searched for at least an equivalent number of matched non-carriers, and ultimately identified 76 non-carriers for the lipid and apoC-III analyses described here.
Plasma total cholesterol, HDL-C, TG, apoC-III, apoA-I, apoB, and apoE levels were measured using an Axcel clinical autoanalyzer (Alfa Wassermann Diagnostic Technologies). Non-HDL-C was calculated by the difference in the TC and HDL-C measurements. All measurements were made from overnight-fasted plasma samples.
Determination of apoC-III A43T isoforms in human plasma via LC–MS/MS
Overview of the targeted mass spectrometry assay
There is no commercially available immunoassay that is capable of distinguishing WT versus A43T mutant apoC-III. Therefore, we took advantage of the power of targeted mass spectrometry to provide allele-specific quantification of apoC-III in plasma samples. The general workflow of our targeted mass spectrometry assay and data analysis is illustrated in Supplementary Figure 2. In brief, we used AspN protease to digest plasma proteins into proteolytic peptides. Because of the presence of various levels of methionine oxidation in selected apoC-III peptides in different samples (data not shown), the resultant AspN peptides were treated with hydrogen peroxide to oxidize all methionine residues. Heavy-isotope-labeled synthetic peptides corresponding to both WT (peptide A43) and A43T (peptide T43) AspN peptides containing the A43T residue were added to each digestion to control for variability in sample preparation and mass spectrometer performance (Supplementary Fig. 3). Mouse plasma samples with known amounts of WT and A43T mutant human apoC-III were processed using the same workflow and used as external calibrators (Supplementary Fig. 4 and Supplementary Table 2). The light/heavy ratio was calculated for each peptide as the peak area of endogenous peptide divided by the peak area of internal isotope-labeled peptide (Supplementary Fig. 3). Linear regression was used to define the targeted assay response (light/heavy ratio) in comparison to the expected WT and A43T mutant apoC-III concentrations. The derived standard curves were used to determine the concentration of WT or mutant apoC-III in human plasma samples.
Sample preparation for the LC–MS/MS assay
Fasting plasma from A43T carriers (n = 19) and non-carriers (n = 21) was enzymatically digested to pep-tides and analyzed by LC–MS/MS to quantify the abundance of WT and A43T mutant peptides. Plasma samples were diluted 50-fold with 50 mM ammonium bicarbonate, and an aliquot containing the equivalent of 150 nl of plasma was biochemically processed for LC–MS/MS analysis.
Isotopically labeled internal standard peptides and exogenous proteins were added to each plasma sample before reduction with dithiothreitol (DTT), oxidation with hydrogen peroxide, and digestion with AspN. Mass-spectrometry-grade AspN (Thermo Fisher Scientific) was used to generate proteolytic peptides for LC–MS/MS analysis. For each measurement, a 150-nl equivalent of mouse or human plasma in 80 μl of 50 mM NH4HCO3 was mixed with heavy-isotope-labeled synthetic peptides covering the apoC-III A43T locus (2.5 pmol for WT A43 peptide and 5 pmol for mutant T43 peptide) (Supplementary Figs. 4 and 5, and Supplementary Table 3). 1.25 pmol of ovalbumin (SERPINB14) was spiked into each sample before digestion to monitor the reproducibility of sample digestion. The mixture was then boiled for 10 min in the presence of 10 mM DTT and alkylated by incubating in the presence of 45 mM iodoacetamide for 1 h in the dark at room temperature. 0.4 μg of AspN enzyme was then added, and digestion was performed overnight at 37 °C. PepClean C-18 spin columns (Thermo Fisher Scientific) were used for peptide cleanup. To oxidize the methionine residues of the resultant AspN peptides, the dried peptides were resuspended in 20 μl of 20 mM hydrogen peroxide and incubate at 4 °C overnight. Samples were dried again in a SpeedVac and reconstituted in 15 μl of 0.1% formic acid for LC–MS/MS assays.
LC–MS/MS assay for apoC-III
Selective reaction monitoring was performed on a TSQ Quantiva triple-stage quadrupole mass spectrometer (Thermo Fisher Scientific) coupled to an UltiMate 3000 Nano LC Systems (Thermo Fisher Scientific). Mobile phase A consisted of 0.1% formic acid in HPLC water, and mobile phase B consisted of 0.1% formic acid in 100% acetonitrile. A 3-μl injection volume of AspN peptides, equivalent to 30 nl of plasma, was loaded onto a C18 trap column (Dionex), washed with mobile phase A at 6 μl/min for 2 min. Nano-LC separation was carried out on an analytical C18 PicoChip column packed with 10.5 cm of Reprosil C18 3-μm 120-Å chromatography medium with a 75-μm-ID column and a 15-μm tip (New Objective) at a flow rate of 400 nl/min with a gradient comprising 2–8% solvent B for 1 min, 8–35% solvent B for 42 min, 35–95% solvent B for 3 min, and 95% solvent B for 10 min. Collision energies were calculated using the linear equation CE = 0.034 × m/z + 3.314. The full width at half maximum was set to be 0.7 Da for Q1 and Q3. The instrument was operated using unscheduled SRM mode with 1.5-s cycling. The majority of peptides had base peak widths of ∼30 sec/base, and ∼20 data points were acquired per chromatogram peak.
An open-source data analysis package (University of Washington, Skyline) was used to facilitate targeted SRM assay method development and data analyses42. All selected apoC-III peptides and their corresponding SRM assay parameters are listed in Supplementary Table 3. The peak area of each analyte was the sum of the peak areas of all transitions. Total mutant protein concentrations were measured by fitting LC–MS/MS selective-reaction-monitoring-derived relative amounts of mutant to WT protein to the total plasma apoC-III concentrations measured by chemical autoanalyzer.
In silico analysis of the splicing effects of the APOC3 A43T variant
The impact of the APOC3 A43T coding variant on APOC3 exon splicing was assessed using the Automated Splice Site and Exon Definition Analyses (ASSEDA) server (MutationForcaster; https://www.mutationforecaster.com/learn.php#asseda; ref. 43).
Cloning of human APOC3 cDNA and adeno-associated virus generation
The cDNA of the human APOC3 gene (NM_000040) was obtained from OriGene and cloned in the pcDNA3.1/V5-His TOPO expression plasmid (Thermo Fisher Scientific). The A43T variant was introduced into the pcDNA3.1/V5-His plasmid containing WT APOC3 cDNA using the QuikChange II Site-Directed Mutagenesis kit (Agilent Technologies) with the following primers: F 5′-GCACGCCACCAAGACCACCAAGGATGCACTGAGCAG-3′, R 5′-CTGCTCAGTGCATCCTTGGTGGTCTTGGTGGCGTGC-3′, where the underlined nucleotides indicate the position of the variant in the primer sequences. The WT and A43T variant APOC3 cDNA sequences were further amplified by PCR to introduce KpnI and SalI restriction sites using the following primers: F 5′-ACGCGTGGTACCATGCAGCCCCGGGTACTCCTTG-3′, R 5′-CCGCCCGGGTCGACTCAGGCAGCCACGGCTGAAG-3′. Amplified PCR products corresponding to the WT and A43T variant cDNA sequences of APOC3 were digested with KpnI and SalI and ligated with an AAV serotype 8 vector plasmid containing the liver-specific thyroxine-binding globulin (TBG) promoter, which was provided by the Vector Core of the University of Pennsylvania44–47. The DNA sequence after ligation of the AAV plasmid was confirmed by Sanger sequencing and by restriction digestion and agarose gel electrophoresis analysis. AAV production, purification, and titering from the cloned WT and A43T APOC3 vector plasmids were performed by the Vector Core.
125I radiolabeling of apoC-III
Full-length forms of WT and A43T variant apoC-III were produced by solid-state peptide synthesis by Pierce Custom Peptides (Thermo Fisher Scientific). Purified peptides were confirmed by matrix-assisted laser desorption/ionization time-of-flight mass spectrometry to be of >95% purity. Proteins were solubilized in 10 mM ammonium bicarbonate buffer, pH 7.4, to a concentration of approximately 0.2–0.4 mg/ml.
Solubilized proteins were iodinated with 125I directly using the iodine mono-chloride method48 or through incorporation with [125I]TC49. For direct 125I labeling of apoC-III by the ICl method, approximately 0.5 ml of apoC-III (Pierce Custom Peptides, Thermo Fisher Scientific) in 10 mM ammonium bicarbonate buffer (0.2–0.4 mg/ml) was iodinated with 1 mCi of 125I (PerkinElmer), 300 μl of 1 M glycine, and 150 μl of 1.84 M NaCl/2.84 μM ICl solution, vortexed, and applied to a PG-10 desalting column (Amersham Biosciences) that was pre-equilibrated with 0.15 M NaCl/1 mM EDTA solution. Iodinated proteins were eluted in a final volume of 2.5 ml in NaCl/EDTA solution and dialyzed against PBS before measurement of protein concentration by BCA assay and 125I activity by gamma counting.
For iodination of TC, 180 μl of 0.4 M sodium phosphate, Pierce iodination beads (Thermo Fisher Scientific), and 1 mCi of 125I were combined, and 20 μl of 0.2 μM TC (a kind gift from D. Usher and W. Cain, University of Delaware) was then added. This mixture was incubated at room temperature for 30 min with shaking every 5 min, and 10 μl of 0.1 M NaI and 20 μl of 0.1 M NaHSO3 were added to stop the reaction. Next, 40 μl of 0.2 μM cyanuric chloride was added to activate the [125I]TC. The activated [125I]TC was then added to the apoC-III protein samples (solubilized in ammonium bicarbonate buffer at a concentration of 0.2–0.4 mg/ml), and reactions were incubated at room temperature for 3 h. Finally, the reaction was fractionated over a PD-10 desalting column to remove unbound iodine, and fractions containing iodinated protein were pooled together and dialyzed against PBS for further use.
AAV WT versus A43T APOC3 expression studies in mice
C57BL/6 WT mice were purchased from The Jackson Laboratory (000664). Additionally, Apoc3-knockout mice on a C57BL/6 background (002057) were recovered from cryopreservation from The Jackson Laboratory and bred at the University of Pennsylvania. Apoc3-knockout mice were bred with Apobec1-deficient, human-APOB-transgenic mice that either were WT (LahB WT), heterozygous (LahB Het), or deficient (LahB KO) for the mouse Ldlr gene. Mice were maintained in a monitored small animal facility at the University of Pennsylvania under IACUC-approved protocols and were fed ad libitum with a standard chow diet or Western diet containing 0.21% cholesterol from OpenSource Diets (D12079B, Research Diets) for the indicated periods of time. All mice were provided access to water ad libitum and were maintained with a 12-h on/12-h off light cycle with lights off from 7:00 p.m. to 7:00 a.m. daily. All blood samples from mice were collected by retro-orbital bleeding from mice anesthetized with isoflurane using EDTA-coated glass tubes under approved protocols. For all studies, male mice approximately 10–12 weeks of age were used. Mice were not randomized for any measure before use in AAV experiments, and experimenters were not blinded to group allocation for the described experiments. Six mice per group were used for all studies, on the basis of prior requirements for group sample sizes for measuring 50% mean differences in plasma TGs from previous studies in our laboratory.
For APOC3 A AV expression experiments in mouse models, mice were initially fasted for 4 h, bled, and administered a control AAV serotype 8 vector lacking a transgene (Null), APOC3 WT AAV (WT), or APOC3 A43T (A43T), all at a dose of 3 × 10¹¹ GC of virus per mouse as determined by digital-PCR-based titering by the Vector Core. AAVs were diluted in sterile PBS in a sterile chemical hood and administered by intraperitoneal injection using insulin syringes. For some experiments, CETP AAV, which was generated as described previously 50, was co-administered with Null or APOC3 AAVs at a dose of 3 × 10¹⁰ GC per mouse; for these experiments, appropriate amounts of CETP AAV vector were mixed with Null or APOC3 AAV vectors and PBS for administration by intra-peritoneal injection. Subsequent blood collection was performed after fasting the mice for 4 h and under isoflurane anesthesia at the indicated time points. Blood was separated to obtain plasma by centrifugation in a microcentrifuge at 4 °C at 10,600g for 7 min. All mouse experiments were performed with six mice per group unless otherwise noted.
Lipid and human apolipoprotein measurements were performed on mouse plasma using an Axcel autoanalyzer. In addition, for some experiments, plasma samples were pooled by experimental group freshly after collection and 150 μl of plasma was separated by FPLC on a Superose 6 gel-filtration column (GE Healthcare Life Sciences) into fractions each 0.5 ml in volume. total cholesterol and TG were measured from FPLC-separated fractions using Infinity Liquid Stable cholesterol and triglyceride reagents (Thermo Scientific) in 96-well microplates with a Synergy Multi-Mode Microplate Reader (BioTek).
Oral fat tolerance tests
OFTTs were performed in APOC3 WT, A43T, and Null AAV treated mice 4 weeks following AAV administration. For these experiments, mice were fasted for 12 h and weighed. Olive oil (Sigma-Aldrich) was prepared in 1.0-ml syringes at a volume of 10 μl × fasting body weight (in grams) for each mouse. Mice were bled before olive oil administration to measure pre-gavage plasma TGs after fasting and were then gavaged orally with olive oil and bled subsequently at 1, 3, 5, and 7 h after gavage. Plasma TGs at each time point were measured by colorimetric assay in 96-well microplates, as described above. For measurement of [3H]retinyl ester accumulation and clearance in the mouse groups described above, gavage with olive oil was performed as described in mice after overnight fast, but instead of volumes of 10 μl olive oil × fasting body weight (in grams), 250 μl was used for each mouse and was premixed with 10 μCi of [11,12-3H]retinol (PerkinElmer). Plasma was collected at 0, 1, 3, 5, and 7 h after gavage, and 3H activity in 10 μl of each plasma sample was used to assess [3H]retinyl ester accumulation. For the measurement of OFTTs in the presence of Poloxamer P407 (Pluronic, Sigma-Aldrich) treatment, the same procedure for treating the mice as described above was used, but, just before olive oil gavage with 10 μl olive oil × fasting body weight (grams), mice were administered a solution of Pluronic in PBS at a dose of 1 mg/kg body weight, administered intravenously by tail vein injection. The time points and subsequent sample processing were otherwise the same as for the above experiments.
TRL clearance studies
For [3H]TRL clearance studies in mice, human TRLs were obtained from pooled human non-fasted plasma from the Hospital of the University of Pennsylvania by density-gradient ultracentrifugation in a Beckman XL-90 Ultracentrifuge (Beckman Coulter) using a 70.1-Ti rotor (Beckman Coulter) at a speed of 40,000 r.p.m. for 18 h. Ultracentrifugation of the plasma resulted in the formation of an upper white, cream-like TRL layer (d < 1.006), which was collected and subjected to another ultracentrifugation step, in the same conditions. The upper cream-like layer (d < 1.006) was collected, and the total protein concentration was measured using a bicinchoninic assay (Thermo Fisher Scientific). Approximately 3 mg of TRL protein was used for labeling with 0.5 mCi of [3H]triolein (PerkinElmer). 0.5 mCi of [3H]triolein in toluene was dried under a nitrogen evaporator and resolubilized in 150–200 μl of ethanol and then added dropwise to a mixture of TRLs (3 mg of protein) and lipoprotein-deficient human serum (d > 1.220, 100 mg of protein per 3 mg of TRL protein) in a glass tube. The mixture was then incubated at37 °C with gentle shaking for 12–14 h. After addition of KBr solution (d = 1.006 g/ml), the mixture was subjected to an additional ultracentrifugation step, according to the protocol detailed above. Following ultracentrifugation, the cream-like top layer (approximately 2.5–3.0 ml) was collected, dialyzed against PBS, and fractionated by FPLC to measure TG and 3H activity in the TRL fractions (5–12) relative to unincorporated 3H activity. Dialyzed [3H]TRLs were then administered by intravenous tail vein injection into mice 5 weeks after administration of Null, WT, or A43T AAVs. Mice were bled at 1, 8, 15, 30, 60, and 120 min after [3H]TRL administration. 3H activity in 10 μl of plasma from each time point was measured by scintillation counting, and the relative 3H activity remaining in the circulation was calculated by normalizing the activity from each time point by that at 1 min for each mouse.
VLDL-TG, apoC-III, and apoB secretion studies
Hepatic VLDL secretion was measured in mice treated with Null or APOC3 AAVs using [35S]methionine metabolic labeling as previously described51. Briefly, mice injected with Nullor APOC3 AAVs at 4 weeks after AAV administration were fasted for 4 h and then administered the surfactant Poloxamer P407 (Sigma-Aldrich) (25 mg in 0.4 ml of PBS) by intraperitoneal injection to inhibit peripheral lipolysis.15 min after P407 administration, each mouse was administered 35S-labeled methionine (0.5 mCi in 0.2 ml of PBS, PerkinElmer) by intravenous tail vein injection. Mice were bled at 0, 30, 60, 90, and 120 min after radioisotope administration for plasma collection. Plasma TGs were measured at each time point with Infinity Triglycerides reagent (Thermo Fisher Scientific) in 96-well microplates. The plasma samples at 60 and 120 min were also used to measure the secretion rate of newly synthesized 35S-labeled apoB and apoC-III. For apoB measurements, 2 μl of each plasma sample from these time points was subjected to SDS–PAGE under reducing conditions using NuPAGE 3–8% Tris-acetate gels (Thermo Fisher Scientific). Gels were fixed in 25% methanol/20% acetic acid solution for 30 min and then with AutoFluor intensifier solution (National Diagnostics) for 30 min. Gels were dried using a vacuum pump for 4 h at 65 °C and exposed to autoradiography film for 1 week at −80 °C, and films were then developed. Visible bands on the film corresponding to apoB-100 and apoB-48 were marked and positions correlated on the dried gels, and those bands were excised from the gels, solubilized with Solvable reagent (0.5 ml; PerkinElmer) at 55 °C for 3 h, and 35S activity was measured by liquid scintillation counting. The activity of each band was normalized to the activity measured after trichloroacetic acid precipitation of proteins from 5 μl of plasma from the same plasma sample used for apoB SDS–PAGE. Normalized 35S activity from the time points at 60 and 120 min was used to calculate the relative apoB-100 and apoB-48 secretion rates. For apoC-III secretion measurements, the procedure followed was the same as described above for measurement of apoB secretion, except NuPAGE 4–12% Bis-Tris gels were used for SDS–PAGE instead of 3–8% Tris-acetate gels.
ApoC-III kinetic studies
For [125I]apoC-III clearance studies, iodinated apoC-III (specific activity of approximately 300,000–500,000 counts per minute (c.p.m.)/μg protein) was mixed with plasma from recipient mice at a ratio of 1 μg of 125I-labeled protein/200 μl of plasma. Iodinated apoC-III and mouse plasma mixtures were incubated at 37 °C for 1 h and were then administered by intravenous tail vein injection into mice treated with either WT or A43T variant APOC3 4 weeks after they were administered APOC3 AAVs. Mice expressing WT APOC3 received 125I-labeled WT apoC-III protein, and those expressing A43T APOC3 received 125I-labeled A43T apoC-III. Mice were bled 1 min, 15 min, 30 min, 1 h, 3 h, 5 h, 9 h, and 24 h after radioisotope administration and sacrificed at 24 h. 125I activity was measured from 10 μl of each plasma sample by counting on a Packard Cobra II Auto-Gamma counter. The relative activity at each time point was determined as the fraction of activity at 1 min for each mouse respectively. For experiments with [125I]TC-modified apoC-III, the above procedure was followed, and in addition liver and kidney were collected from mice at 24 h after perfusion with 10 ml of cold PBS. 30 mg of each tissue was homogenized in PBS and measured for 125I activity. Tissue 125I activity was normalized to the plasma 125I activity at 1 min for each mouse respectively. For experiments measuring urinary clearance of [125I]apoC-III, mice were administered 125I-labeled proteins in the manner above and mice were bled at 1 min, 3 h, 6 h, and 24 h after administration. For these experiments, mice were housed singly in rodent metabolic cages (Tecniplast) and urine was collected from 0–6 h, 6–12 h, and 12–24 h during the course of the study. Plasma and urine samples (20 μl of each sample) were counted for total 125I activity by gamma counting. In addition, proteins were separated by TCA precipitation from 20 μl of each sample, and the TCA-soluble (degraded) and TCA pellet (intact protein) fractions were counted for 125I activity.
Hepatic gene expression
For gene expression measurements, approximately 20 ng of liver tissues from each mouse was snap-frozen at −80 °C. Total RNA was extracted from tissues using TRIzol reagent (Thermo Fisher Scientific) according to the manufacturer's protocol. Synthesis of cDNA was completed using 1 μg of RNA following extraction using the High-Capacity cDNA Reverse Transcription kit (Thermo Fisher Scientific). Quantitative real-time PCR was performed on the synthesized cDNA using a QuantStudio 7 Real-Time PCR System with the following TaqMan primer sets (Thermo Fisher Scientific): human APOC3, Hs00163644_m1; mouse Apoc3, Mm00445670_m1; mouse Actb (actin), Mm00607939_s1. The relative expression of human APOC3 and mouse Apoc3 in the liver was analyzed for each mouse by normalizing to actin gene expression from the same sample.
Hepatic AAV vector DNA content in each mouse was also assessed by quantitative real-time PCR. Total hepatic DNA was isolated from 25 mg of liver for each mouse using the QIAamp DNA Mini kit (Qiagen). Isolated liver DNA was used for quantitative real-time PCR with TaqMan primers targeting the rabbit beta-globin poly(A) sequence of the AAV vector backbone. Cycle numbers from this assay were compared to those from a standard curve of serial dilutions of a linearized AAV plasmid of known quantity.
Immunoblotting
For immunoblotting of apoC-III from mouse liver samples, 30 μg of liver was separated on 10% Bis-Tris NuPAGE gels using MES buffer by one-dimensional SDS–PAGE. Separated proteins were transferred to nitrocellulose membranes, and membranes were blocked with 5% fat-free milk in PBS (0.05% Tween-20) for 3 h. Membranes were then incubated for 2 h at room temperature with a rabbit polyclonal antibody against human apoC-III (33A-R1a, Academy Biomedical) at a dilution of 1:2,000, followed by three 15-min washes with PBS/Tween solution and incubation with goat anti-rabbit IgG HRP conjugate (sc-2030, Santa Cruz Biotechnology) for 30 min at room temperature. Membranes were again washed 3 × 15 min, and proteins were visualized with Luminata Crescendo chemiluminescent reagent (Millipore). Mouse β-actin, used as a loading control, was detected using mouse anti-actin primary antibody (sc-81178, Santa Cruz Biotechnology) at a dilution of 1:2,000; membranes were incubated with the antibody for 2 h at room temperature, washed, and then incubated with goat anti-mouse IgG HRP conjugate (sc-2302, Santa Cruz Biotechnology) at a dilution of 1:5,000 for 30 min at room temperature.
Expression and purification of recombinant monoclonal antibodies to apoC-III (STT505 and STT5058)
After selection from phage Fab antibody libraries, genes encoding the variable regions of antibodies scored positive for binding a central epitope of human apoC-III were sequenced and compared with each other (using Clone manager software, DeLano Scientific). Codon-optimized synthetic fragments encoding the different variable domains (VH and Vκ or Vλ) were ordered from Geneart. Recombinant antibodies were produced by U-Protein Express BV as follows: the synthetic DNA fragments encoding the variable domains were ligated into in-house-constructed expression vectors, resulting in heavy chain–, Igκ- and Igλ-encoding expression constructs. Equal amounts of the heavy chain–encoding vector were mixed with the light chain–encoding vector for cotransfection of HEK293E cells (ATCC). Cell lines were authenticated by ATCC by short-tandem-repeat profiling and karyotyping and were tested by both ATCC and our facility for mycoplasma contamination. Full-length recombinant antibodies were produced by transient transfection of HEK293E cells grown in suspension at 0.1–15 l scale. Six days after transfection, conditioned medium was collected by centrifugation and concentrated. The recombinant antibodies were purified via affinity chromatography using rmp Protein A Sepharose Fast Flow (GE Healthcare) and gel filtration chromatography using HiLoad 26/60 Superdex 200 pg (GE Healthcare), according to the manufacturer's recommendations. Purity was determined using SDS–PAGE, and the concentration was determined by measurement of the optical density at 280 nm. Endotoxin levels were determined using a Limulus Amebocyte Lysate (LAL) assay (Thermo Fisher Scientific). Typical yields of the recombinant antibodies varied between 20 and 80 mg/l with a purity of at least 98% and with an endotoxin level below the detection limit. The STT5058 antibody is a modified version of the STT505 antibody, in which a serine-to-histidine substitution in the third residue of the heavy chain complementarity-determining region 2 (HCDR2) and a glutamine-to-histidine substitution in the second residue of the light chain complementarity-determining region 3 (LCDR3) were introduced. These modifications were incorporated to allow differential affinity of the antibody for the apoC-III epitope at pH 7.4 versus pH 5.5.
In vivo studies with STT505 and STT5058
All animal studies using STT505 and STT5058 were carried out in accordance with the recommendations in the Guide for the Care and Use of Laboratory Animals of the National Institutes of Health. All procedures were approved by the Institutional Animal Care and Use Committee of Vascumab, LLC, and the University of Pennsylvania. For STT505 antibody studies, 24 male C57Bl/6 mice (Charles River) weighing 20–25 g were maintained on a constant 12-h light/12-h dark cycle with free access to water and ad libitum access to a standard chow diet (Lab Diet, 5001). For overexpression of human WT APOC3, mice were injected intraperitoneally with an AAV vector expressing human APOC3 as described above. Twelve days after administration of 3 × 10¹¹ GC/mouse, mice were bled via retro-orbital sinus and assigned to groups to achieve equivalent starting mean plasma apoC-III levels between groups. On day 14, mice were fasted for 6 h and retro-orbital sinus bled to measure lipid levels before antibody administration. The experiment was initiated by an intravenous tail injection of test antibody followed immediately by a 10 ml/kg oral bolus of olive oil (Sigma-Aldrich, 01514). Mice were bled via retro-orbital sinus to determine levels of plasma TGs, apoC-III, and test antibody at 15, 30, 60, 120, and 240 min following olive oil challenge. Measured values were plotted as a function of time and the AUC for plasma TGs was calculated using GraphPad Prism 6. For STT5058 antibody studies, 20 male C57Bl/6 mice were treated with WT APOC3 AAV and maintained as described above for the mice in the STT505 antibody studies. [125I]TC-modified apoC-III was prepared as described above for the WT versus A43T studies, and the experiment was performed as follows. Three weeks after injection with WT APOC3 AAV, mice were administered STT5058 antibody or isotype control antibody (anti–hen egg lysozyme antibody; HyHEL-5, U-Protein Express) (25 mg/kg body weight at time of dosing, in PBS) by injection into the subcutaneous layer of the back. 24 h later, the mice were administered [125I]TC-modified WT apoC-III via tail vein injection as described above. Plasma was collected from these mice at 1 min, 15 min, 30 min, 60 min, 3 h, 5 h, 9 h, and 21 h after radioiodinated apoC-III administration. At 21 h after apoC-III administration, mice were sacrificed, perfused with 10 ml of cold PBS, and the liver, kidneys, and spleen were dissected for 125I activity measurements from 20 mg of each tissue in the manner described above for the A43T experiments. Tissue 125I activity was normalized to the plasma 125I activity at 1 min for each mouse respectively.
TGs were analyzed by incubating 5 μl of serum with 150 μl of Thermo Fisher Scientific Triglycerides Reagent (TR22421) supplemented with 200 μM Amplex Red (AAT Bioquest) in a black 96-well plate (Costar, 3915). After incubation for 10 min at 30 °C, the plate was read (excitation 560 nm, emission 585 nm), and the TG concentration was calculated from a four-parameter fit (Molecular Devices) of a glycerol standard curve.
A 96-well plate (Greiner, 655061) was coated overnight at 4 °C with 50 μl of primary antibody to apoC-III (Abcam rabbit polyclonal anti–human apoC-III, ab21032) diluted in PBS. The plate was washed four times with 200 μl of TBS-T and blocked with 200 μl of blocking buffer (Pierce Clear Milk Blocker, 37587; in PBS) for 90 min at 30 °C. The blocking buffer was removed, and 50 μl of test sample diluted in blocking buffer was added and allowed to incubate for 2 h at room temperature with mixing at 300 r.p.m. The plate was washed four times with 200 μl of TBS-T, and 50 μl of secondary antibody (Abcam goat polyclonal biotin-conjugate apoC-III, ab21024) diluted in blocking buffer was added and allowed to incubate for 1 h at room temperature with rotation at 300 r.p.m. The plate was washed once with TBS-T, and 50 μl of SA-HRP (Abcam, 34028) diluted 100-fold in PBS was added and allowed to incubate for 30 min at room temperature with mixing at 300 r.p.m. The plate was washed four times with 200 μl of TBS-T and developed with 80 μl of TMB (Thermo Ultra-TMB ELISA, 34028) followed by 50 μl of 0.5 N HCl. Plates were read at 450 nm. The amount of apoC-III in test wells was calculated from a four-parameter fit of a standard curve (Molecular Devices) constructed using purified apoC-III (Athens Research and Technology).
For in vivo studies of anti-apoC-III monoclonal antibodies, apoB levels were determined with an ELISA assay. A 96-well plate (Greiner, 655061) was coated overnight at 4 °C with 50 μl of primary antibody to apoB (Meridian Life Sciences goat polyclonal anti–human ApoB, K45253G) diluted in PBS. The plate was washed four times with 200 μl of TBS-T and blocked with 200 μl of blocking buffer (Pierce Clear Milk Blocker, 37587; in PBS) for 90 min at 30 °C. The blocking buffer was removed, and 50 μl of test sample diluted in blocking buffer was added and allowed to incubate for 2 h at room temperature with rotation at 300 r.p.m. The plate was washed four times with 200 μl of TBS-T, and 50 μl of secondary antibody (Meridian Life Sciences goat polyclonal biotin-conjugate ApoB48/100, 34003G) diluted in blocking buffer was added and allowed to incubate for 1 h at room temperature with rotation at 300 r.p.m. The plate was washed once with TBS-T, and 50 μl of SA-HRP (Abcam, 64269) diluted 100-fold in PBS was added and allowed to incubate for 30 min at room temperature with rotation at 300 r.p.m. The plate was washed four times with 200 μl of TBS-T and developed with 80 μl of TMB (Thermo Ultra-TMB ELISA, 34028) followed by 50 μl of 0.5 N HCl. Absorbance was read at 450 nm. The amount of apoB in test wells was calculated from a four-parameter fit of a standard curve (Molecular Devices) constructed using mouse VLDL isolated by centrifugation (apoB content is assumed to be 20% of the total protein content).
The plasma levels of the STT505 and STT5058 antibodies were determined with an ELISA assay. A 96-well plate (Greiner, 655061) was coated overnight at 4 °C with 50 μl of primary IgG antibody (Fitzgerald 41-XG57 goat anti–human IgG Fc polyclonal) diluted in PBS. The plate was washed four times with 200 μl of TBS-T and blocked with 200 μl of blocking buffer consisting of 3% BSA (Roche BSA Fraction V Protease Free, 03 117 332 001) plus clear milk (Pierce Clear Milk Blocker, 37587) in PBS for 90 min at 30 °C. The blocking buffer was removed, and 50 μl of test sample diluted in blocking buffer was added and allowed to incubate for 2 h at room temperature with rotation at 300 r.p.m. The plate was washed four times with 200 μl of TBS-T, and 50 μl of secondary antibody (Abcam, goat anti-human IgG Fc (biotin) polyclonal, ab97223) diluted in blocking buffer was added and allowed to incubate for 1 h at room temperature with rotation at 300 r.p.m. The plate was washed once with TBS-T, and 50 μl of SA-HRP (Abcam, 64269) diluted 100-fold in PBS was added and allowed to incubate for 30 min at room temperature with rotation at 300 r.p.m. The plate was washed four times with 200 μl of TBS-T and developed with 80 μl of TMB (Thermo Ultra-TMB ELISA, 34028) followed by 50 μl of 0.5 N HCl. The absorbance was read at 450 nm. The amount of IgG in test wells was calculated from a four-parameter fit of a standard curve (Molecular Devices) constructed using the purified test antibody.
ApoC-III lipoprotein-binding measurements
Human TRLs and HDL3 were isolated from pooled human plasma by density-gradient ultracentrifugation. Isolated lipoproteins were dialyzed against PBS, and protein concentration was measured by BCA assay. Radioiodinated WT or A43T apoC-III, generated as described above, was solubilized in 10 mM ammonium bicarbonate buffer and dialyzed against PBS. For binding studies of apoC-III with plasma lipoproteins, 1 μg of [125I]apoC-III was combined with 200 μl of pooled donor plasma and incubated at 37 °C for 1, 5, or 24 h with gentle shaking. Immediately after incubation, mixtures were fractionated on a Superose 6 gel-filtration column. TG and cholesterol concentrations were measured in 0.1 ml of each FPLC fraction by colorimetric assay in a 96-well microplate, and [125I]apoC-III abundance was measured by gamma counting. The activity in each FPLC fraction was expressed as the percentage of the total activity (the sum of the activity in all the fractions). The relative activity in lipoprotein fractions versus free protein fractions was assessed by comparing the sum of the total area for the lipoprotein fractions versus the free protein fractions. Results were compared across replicate experiments. For binding of apoC-III to TRLs or HDL3, the procedure above was followed with the exception that 200 μg of TRL protein or 100 μg of HDL3 protein was used for each experiment in combination with 1 μg of [125I]apoC-III.
Binding of [125I]apoC-III to apolipoprotein-free lipid emulsions was also measured. Large lipid emulsions were prepared as described previously52. Briefly, a mixture of 300 mg of triolein (Sigma-Aldrich) and 18 mg of egg-phosphatidylcholine (Sigma-Aldrich) was dried under a nitrogen evaporator and then sonicated after addition of 5 ml of glycerol (Thermo Fisher Scientific) using a Branson 450 microtip sonicator for 5 min. Concentrated emulsions were allowed to clear overnight. 15 μl of this concentrated emulsion was combined with 90 μl of distilled water, 15 μl of 1.0 M Tris pH 8.0, 15 μl of 15% BSA solution, and 15 μl of 3.0 M NaCl to give a final volume of 150 μl of working emulsion. 1 μg of [125I]apoC-III was combined with 150 μl of the working emulsion and incubated at 37 °C for 1 h, and mixtures were then fractionated by FPLC and analyzed for 125I activity in the emulsion-containing fractions versus the unbound protein fractions as detailed above. Preliminary FPLC fractionation experiments showed that emulsions alone eluted in fractions 5–15 of the 79 fractions obtained from gel-filtration analysis, which mirrored the fractionation pattern of human TRLs on the same Superose 6 column under the same conditions. For binding of apoC-III to TRLs in the presence of STT5058 antibody versus isotype control antibody, the procedure above was followed with the exception that 200 μg of human TRL protein was first incubated with 1 μg of [125I]TC-modified apoC-III for 1 h at 37 °C and either of the two antibodies was then added to the reaction mixture. 0.2 mg of antibody was added to the reactions to reflect the approximate concentration of antibody present in the in vivo experiment (0.54 mg of antibody per mouse). Next, the reactions were incubated for another 8 h before fractionation by FPLC and measurement of [125I]TC-modified apoC-III activity in each fraction, normalized to the total activity in the reaction mixtures as described above.
Surface plasmon resonance assay
WT or A43T human apoC-III (Thermo Fisher Scientific) were captured on a chip coated with dimyristoyl phosphatidylcholine (DMPC) (Avanti Polar Lipids), and the binding kinetics of these apoC-III forms to the coated chip were measured at pH 7.4 and pH 5.5. 60 μl of each of these proteins was diluted in HBS-EP buffer (GE, BR-1008-26; 0.010 M HEPES, 0.150 M NaCl, 3 mM EDTA, 0.05% (v/v) surfactant P20, pH 7.4) and was injected at a concentration of 1–100 nM. The proteins were passed through the flow cells at a flow rate of 30 μl/min, followed by an off-rate wash at pH 7.4 or pH 5.5 for 5 min. The resulting sensorgrams were analyzed using BIAevaluation 4.1 software applying the Langmuir 1:1 binding model to derive binding kinetics. Data were zero adjusted, and the reference cell sensorgrams were subtracted and used to calculate the on rate and off rate of apoC-III chip association over a range of apoC-III concentrations of 10, 25, and 50 μg/ml. The ratio of the off rate to the on rate at these concentrations was used as the dissociation constant (Kd) for WT versus mutant apoC-III.
LPL activity assays
In vitro LPL activity in the presence of WT versus A43T variant apoC-III was measured by two independent methods. First, activity was measured against a large lipid emulsion made as described above but with the addition of [3H]triolein (PerkinElmer; 99 μg per 300 mg of nonra-dioactive triolein) before glycerol addition and sonication as described previously52. Working emulsions were made by the method above except that 75 μl of water was used and 15 μl of heat-inactivated human serum was added to provide a source of apoC-II. The working emulsion (150 μl) was combined with conditioned medium (100 μl) from COS-7 cells expressing human LPL through adenoviral transduction, as described previously52. 50 μl of WT or A43T apoC-III (final reaction concentration of 20 μM for each) or culture medium without apoC-III was added to give a final reaction volume of 300 μl. Reactions were incubated at 37 °C for 30 min with gentle shaking before addition of 3.25 ml of methanol:chloroform:heptane solvent (1.41:1.25:1.00) to stop the reactions and subsequent addition of 1.05 ml of pH 10.0 Buffer Potassium Carbonate, Potassium Tetraborate, Potassium Hydroxide, Disodium EDTA Dihydrate (Thermo Fisher Scientific). Stopped reactions were then centrifuged at 688g for 20 min to complete the extraction, and the upper phase containing liberated fatty acids was used for scintillation counting (0.5 ml per sample). The relative amount of hydrolysis of [3H]triolein to [3H]oleic acid was calculated for each sample and compared across groups. A second LPL activity assay was performed using an Intralipid TG substrate in the presence or absence of WT versus A43T apoC-III, as described previously53. Briefly, 10% Intralipid substrate (Santa Cruz Biotechnology; 1.2 nM per reaction) and WT or A43T apoC-III (range of 0–58 μM per reaction) were combined in 96-well microplates to a volume of 40 μl and incubated at 30 °C for 15 min, followed by the addition of purified LPL (Sigma-Aldrich; 40 nM per reaction) to give a final reaction volume of 60 μl. Reactions were incubated at 30 °C for 30 min, and 100 μl of Wako NEFA-HR(2) R1 reagent (Wako Chemicals) was added along with Orlistat (Santa Cruz Biotechnology; 20 μM final reaction concentration) to inhibit further lipolysis and the reactions were incubated for another 15 min at 30 °C. Then, 50 μl of Wako NEFA-HR(2) R2 reagent was added, and the reactions were incubated for another 5 min at 30 °C and the absorbance was measured at 550 nm for each sample. All LPL assays were performed using three independent replicate experiments.
ApoC-III-depleted VLDL and DiI labeling
To float chylomicrons, pooled human plasma (Innovative Research) was centrifuged at 100,000g for 10 min at 4 °C. Chylomicrons were removed by pipetting, and the resulting plasma was gently mixed with goat anti-human apoC-III Sepharose 4b (Academy Biomedical) overnight at 4 °C. The unbound fraction was collected, mixed with OptiPrep (12% iodixanol final concentration), and centrifuged for 3.5 h at 350,000g at 4 °C. VLDL particles were removed from the top of the gradient. For DiIC12(3) labeling, a 6 mM stock of DiIC12(3) (Molecular Probes) in DMSO was slowly added to a 1.5 μg/μl sample of VLDL to give a final concentration of 100 μM DiIC12(3). The sample was kept in the dark for 7 h at 37 °C, and unincorporated DiIC12(3) was removed through an 8-μm PSE filter.
DiI-VLDL uptake assays
HepG2 cells (ATCC, HB-8065) were seeded on poly(d-lysine)-coated 96-well tissue culture plates (Greiner Bio-One, 655940) in 100 μl of complete MEM (Life Technologies) plus with 10% FCS (Seradigm) and grown at 37 °C in 5% CO2. After 24 h, the medium was removed and the cell monolayer was washed once with 200 μl of complete MEM plus with 0.0125% BSA (Roche) and replaced with 100 μl of complete MEM plus with 0.0125% BSA. After 24 h at 37 °C and 5% CO2, the medium was removed and replaced with 50 μl of a test component mixture assembled as follows: apoC-III (Athens Research and Technology) and test antibody were mixed in MEM plus 0.0125% BSA and incubated for 15 min at 37 °C, followed by 30 μg/μl apoC-III-depleted DiI-VLDL (see below) for 20 min at 37 °C. After 3.5 h of incubation at 37 °C and 5% CO2, the test mixture was removed and the cells were incubated with 100 μl of 1% intralipid diluted in complete MEM for 20 min at 37 °C and 5% CO2. The medium was removed, and cells were washed three times with 200 μl of 37 °C DPBS (Life Technologies, 14190-144). After washing, 100 μl of isopropanol was added to each well and the plate was incubated at room temperature for 15 min with gentle shaking. A 75-μl aliquot was transferred to a black 96-well plate (VWR, 89089-582), and fluorescence was measured (excitation 520 nm, emission 580 nm). The amount of DiI-VLDL extracted from cells per unit volume of isopropanol was determined from a DiI-VLDL standard curve. The remaining isopropanol was removed from the cell plate, 100 μl of lysis buffer (0.1 N NaOH, 0.1% SDS) was added to each well, and the plate was incubated for a minimum of 30 min. A 25-μl aliquot was used to measure protein concentration (Pierce BCA Protein Assay; Thermo Scientific, 23225), and the quantity of VLDL taken into the cell was calculated from the DiI-VLDL/protein ratio. Data were graphed using GraphPad Prism 6 and are reported as average ± s.e.m. One-way ANOVA with multiple comparisons was calculated using GraphPad Prism 6.
Statistical analysis
Data from human samples shown are represented as mean ± s.d., where error bars show s.d. All other data are shown as mean ± s.e.m., where error bars show s.e.m. Statistical comparisons between two groups were performed using a two-tailed Student's t test or one-way ANOVA as appropriate and when assumptions of distribution of the data were valid. Comparisons between three experimental groups were performed using two-way ANOVA. For all measurements, variance was estimated to be similar between groups compared. For measurement of mutant:WT apoC-III ratios in A43T heterozygous carriers, the mean of the ratios among carriers was compared to an expected theoretical mean of 1.0 using a one-sample t test. Statistical significance was defined as P < 0.05 for all analyses.
Life sciences reporting summary
Additional information regarding human participants and animals used, reagent validation and availability, statistics, software for data analysis, and reproducibility of results can be found in the Life Sciences Reporting Summary accompanying this manuscript.
Data availability
The authors declare that all data relevant to supporting the conclusions of this study are present within the manuscript and its supplementary information. Exome Chip SNP genotyping data from human participants from the Penn Medicine BioBank and HHDL cohorts were deposited in the Gene Expression Omnibus (GEO) database (accession GSE100271). Additional requests for correspondence regarding data in this study may be made to the corresponding author (D.J.R.). Source data files for Figures 1–4 are available online.
Supplementary Material
Acknowledgments
The authors thank A. Wilson, E. Edouard, J. McParland, M. McCoy, K. Trindade, S. DerOrhannessian, M. Risman, K. Burton, and M. Sun for technical expertise and M. Lazar, M. Bucan, Z. Arany, B. Garcia, N. Hand, D. Marchadier, D. Conlon, and R. Bauer for helpful discussions. This work was supported in part by NIH grants R01HL133502 and R37HL055323 and a grant from the Foundation Leducq CVGeneF(x) Transatlantic Network of Excellence to D.J.R. and by NIH grant F30HL124967 to S.A.K. This project also used the UPCI Cancer Proteomics Facility, which is supported in part by NIH award P30CA047904. Recruitment to the Penn Medicine BioBank was supported by the Penn Cardiovascular Institute, the Perelman School of Medicine of the University of Pennsylvania, and a gift from the Smilow family.
Footnotes
Note: Any Supplementary Information and Source Data files are available in the online version of the paper.
Author Contributions: S.A.K., J.S.M., C.V., A.V.H.S., and P.Z. performed experiments on the A43T variant. S.A.K., X.Z., Z.S., and N.A.Y. performed selective reaction monitoring measurements from human plasma samples. S.A.K., P.D.-J., J.A.L., N.B., W.J.Z., I.T., and H.d.H. designed and performed experiments on anti-apoC-III monoclonal antibodies. G.M.P., P.N., M.C., S.L.-K., M.C.P., A.R.T., and S.K. provided guidance with study design. S.A.K. and D.J.R. secured funding, conceived and designed experiments, interpreted all results, and wrote the manuscript. All authors provided input on the manuscript.
Competing Financial Interests: The authors declare competing financial interests: details are available in the online version of the paper.
References
- 1.Musunuru K, Kathiresan S. Surprises from genetic analyses of lipid risk factors for atherosclerosis. Circ Res. 2016;118:579–585. doi: 10.1161/CIRCRESAHA.115.306398. [DOI] [PMC free article] [PubMed] [Google Scholar]
- 2.Khetarpal SA, Qamar A, Millar JS, Rader DJ. Targeting ApoC-III to reduce coronary disease risk. Curr Atheroscler Rep. 2016;18:54. doi: 10.1007/s11883-016-0609-y. [DOI] [PubMed] [Google Scholar]
- 3.Jørgensen AB, Frikke-Schmidt R, Nordestgaard BG, Tybjærg-Hansen A. Loss-of-function mutations in APOC3 and risk of ischemic vascular disease. N Engl J Med. 2014;371:32–41. doi: 10.1056/NEJMoa1308027. [DOI] [PubMed] [Google Scholar]
- 4.Crosby J, et al. Loss-of-function mutations in APOC3, triglycerides, and coronary disease. N Engl J Med. 2014;371:22–31. doi: 10.1056/NEJMoa1307095. [DOI] [PMC free article] [PubMed] [Google Scholar]
- 5.Pollin TI, et al. A null mutation in human APOC3 confers a favorable plasma lipid profile and apparent cardioprotection. Science. 2008;322:1702–1705. doi: 10.1126/science.1161524. [DOI] [PMC free article] [PubMed] [Google Scholar]
- 6.Aalto-Setälä K, et al. Mechanism of hypertriglyceridemia in human apolipoprotein (apo) CIII transgenic mice. Diminished very low density lipoprotein fractional catabolic rate associated with increased apo CIII and reduced apo E on the particles. J Clin Invest. 1992;90:1889–1900. doi: 10.1172/JCI116066. [DOI] [PMC free article] [PubMed] [Google Scholar]
- 7.Aalto-Setälä K, et al. Further characterization of the metabolic properties of triglyceride-rich lipoproteins from human and mouse apoC-III transgenic mice. J Lipid Res. 1996;37:1802–1811. [PubMed] [Google Scholar]
- 8.de Silva HV, et al. Overexpression of human apolipoprotein C-III in transgenic mice results in an accumulation of apolipoprotein B48 remnants that is corrected by excess apolipoprotein E. J Biol Chem. 1994;269:2324–2335. [PubMed] [Google Scholar]
- 9.Eisenberg S, Patsch JR, Sparrow JT, Gotto AM, Olivecrona T. Very low density lipoprotein. Removal of apolipoproteins C-II and C-III-1 during lipolysis in vitro. J Biol Chem. 1979;254:12603–12608. [PubMed] [Google Scholar]
- 10.Masucci-Magoulas L, et al. A mouse model with features of familial combined hyperlipidemia. Science. 1997;275:391–394. doi: 10.1126/science.275.5298.391. [DOI] [PubMed] [Google Scholar]
- 11.Chan DC, Watts GF, Nguyen MN, Barrett PH. Apolipoproteins C-III and A-V as predictors of very-low-density lipoprotein triglyceride and apolipoprotein B-100 kinetics. Arterioscler Thromb Vasc Biol. 2006;26:590–596. doi: 10.1161/01.ATV.0000203519.25116.54. [DOI] [PubMed] [Google Scholar]
- 12.Chan DC, Watts GF, Redgrave TG, Mori TA, Barrett PH. Apolipoprotein B-100 kinetics in visceral obesity: associations with plasma apolipoprotein C-III concentration. Metabolism. 2002;51:1041–1046. doi: 10.1053/meta.2002.33339. [DOI] [PubMed] [Google Scholar]
- 13.Olivieri O, et al. Apolipoprotein C-III, metabolic syndrome, and risk of coronary artery disease. J Lipid Res. 2003;44:2374–2381. doi: 10.1194/jlr.M300253-JLR200. [DOI] [PubMed] [Google Scholar]
- 14.Ooi EM, Barrett PH, Chan DC, Watts GF. Apolipoprotein C-III: understanding an emerging cardiovascular risk factor. Clin Sci (Lond) 2008;114:611–624. doi: 10.1042/CS20070308. [DOI] [PubMed] [Google Scholar]
- 15.Caron S, et al. Transcriptional activation of apolipoprotein CIII expression by glucose may contribute to diabetic dyslipidemia. Arterioscler Thromb Vasc Biol. 2011;31:513–519. doi: 10.1161/ATVBAHA.110.220723. [DOI] [PubMed] [Google Scholar]
- 16.Ginsberg HN, Brown WV. Apolipoprotein CIII: 42 years old and even more interesting. Arterioscler Thromb Vasc Biol. 2011;31:471–473. doi: 10.1161/ATVBAHA.110.221846. [DOI] [PubMed] [Google Scholar]
- 17.Ooi EM, et al. Plasma apolipoprotein C-III metabolism in patients with chronic kidney disease. J Lipid Res. 2011;52:794–800. doi: 10.1194/jlr.M011163. [DOI] [PMC free article] [PubMed] [Google Scholar]
- 18.Qamar A, et al. Plasma apolipoprotein C-III levels, triglycerides, and coronary artery calcification in type 2 diabetics. Arterioscler Thromb Vasc Biol. 2015;35:1880–1888. doi: 10.1161/ATVBAHA.115.305415. [DOI] [PMC free article] [PubMed] [Google Scholar]
- 19.Cohn JS, et al. Plasma turnover of HDL apoC-I, apoC-III, and apoE in humans: in vivo evidence for a link between HDL apoC-III and apoA-I metabolism. J Lipid Res. 2003;44:1976–1983. doi: 10.1194/jlr.M300209-JLR200. [DOI] [PubMed] [Google Scholar]
- 20.Nguyen MN, et al. Use of Intralipid for kinetic analysis of HDL apoC-III: evidence for a homogeneous kinetic pool of apoC-III in plasma. J Lipid Res. 2006;47:1274–1280. doi: 10.1194/jlr.M600018-JLR200. [DOI] [PubMed] [Google Scholar]
- 21.Ginsberg HN, Ramakrishnan R. Kinetic studies of the metabolism of rapidly exchangeable apolipoproteins may leave investigators and readers with exchangeable results. Arterioscler Thromb Vasc Biol. 2008;28:1685–1686. doi: 10.1161/ATVBAHA.108.174185. [DOI] [PMC free article] [PubMed] [Google Scholar]
- 22.Ginsberg HN, Ramakrishnan R. Investigations of apoC-III metabolism using stable isotopes: what information can you acquire and how can you interpret your results? J Lipid Res. 2011;52:1071–1072. doi: 10.1194/jlr.E015958. [DOI] [PMC free article] [PubMed] [Google Scholar]
- 23.Mauger JF, Couture P, Bergeron N, Lamarche B. Apolipoprotein C-III isoforms: kinetics and relative implication in lipid metabolism. J Lipid Res. 2006;47:1212–1218. doi: 10.1194/jlr.M500455-JLR200. [DOI] [PubMed] [Google Scholar]
- 24.Shin MJ, Krauss RM. Apolipoprotein CIII bound to apoB-containing lipoproteins is associated with small, dense LDL independent of plasma triglyceride levels in healthy men. Atherosclerosis. 2010;211:337–341. doi: 10.1016/j.atherosclerosis.2010.02.025. [DOI] [PubMed] [Google Scholar]
- 25.Yang X, et al. Reduction in lipoprotein-associated apoC-III levels following volanesorsen therapy: phase 2 randomized trial results. J Lipid Res. 2016;57:706–713. doi: 10.1194/jlr.M066399. [DOI] [PMC free article] [PubMed] [Google Scholar]
- 26.Pechlaner R, et al. Very-low-density lipoprotein-associated apolipoproteins predict cardiovascular events and are lowered by inhibition of APOC-III. J Am Coll Cardiol. 2017;69:789–800. doi: 10.1016/j.jacc.2016.11.065. [DOI] [PMC free article] [PubMed] [Google Scholar]
- 27.Wyler von Ballmoos MC, Haring B, Sacks FM. The risk of cardiovascular events with increased apolipoprotein CIII: a systematic review and meta-analysis. J Clin Lipidol. 2015;9:498–510. doi: 10.1016/j.jacl.2015.05.002. [DOI] [PubMed] [Google Scholar]
- 28.Nagashima K, et al. Effects of the PPARγ agonist pioglitazone on lipoprotein metabolism in patients with type 2 diabetes mellitus. J Clin Invest. 2005;115:1323–1332. doi: 10.1172/JCI23219. [DOI] [PMC free article] [PubMed] [Google Scholar]
- 29.Willer CJ, et al. Discovery and refinement of loci associated with lipid levels. Nat Genet. 2013;45:1274–1283. doi: 10.1038/ng.2797. [DOI] [PMC free article] [PubMed] [Google Scholar]
- 30.Graham MJ, et al. Antisense oligonucleotide inhibition of apolipoprotein C-III reduces plasma triglycerides in rodents, nonhuman primates, and humans. Circ Res. 2013;112:1479–1490. doi: 10.1161/CIRCRESAHA.111.300367. [DOI] [PubMed] [Google Scholar]
- 31.Gaudet D, et al. Antisense inhibition of apolipoprotein C-III in patients with hypertriglyceridemia. N Engl J Med. 2015;373:438–447. doi: 10.1056/NEJMoa1400283. [DOI] [PubMed] [Google Scholar]
- 32.Sundaram M, et al. Functional analysis of the missense APOC3 mutation Ala23Thr associated with human hypotriglyceridemia. J Lipid Res. 2010;51:1524–1534. doi: 10.1194/jlr.M005108. [DOI] [PMC free article] [PubMed] [Google Scholar]
- 33.Millar JS, Cromley DA, McCoy MG, Rader DJ, Billheimer JT. Determining hepatic triglyceride production in mice: comparison of poloxamer 407 with Triton WR-1339. J Lipid Res. 2005;46:2023–2028. doi: 10.1194/jlr.D500019-JLR200. [DOI] [PubMed] [Google Scholar]
- 34.Malmendier CL, Lontie JF, Grutman GA, Delcroix C. Metabolism of apolipoprotein C-III in normolipemic human subjects. Atherosclerosis. 1988;69:51–59. doi: 10.1016/0021-9150(88)90288-2. [DOI] [PubMed] [Google Scholar]
- 35.Malmendier CL, et al. Apolipoproteins C-II and C-III metabolism in hypertriglyceridemic patients. Effect of a drastic triglyceride reduction by combined diet restriction and fenofibrate administration. Atherosclerosis. 1989;77:139–149. doi: 10.1016/0021-9150(89)90075-0. [DOI] [PubMed] [Google Scholar]
- 36.Gordts PL, et al. ApoC-III inhibits clearance of triglyceride-rich lipoproteins through LDL family receptors. J Clin Invest. 2016;126:2855–2866. doi: 10.1172/JCI86610. [DOI] [PMC free article] [PubMed] [Google Scholar]
- 37.Kathiresan S. Developing medicines that mimic the natural successes of the human genome: lessons from NPC1L1, HMGCR, PCSK9, APOC3, and CETP. J Am Coll Cardiol. 2015;65:1562–1566. doi: 10.1016/j.jacc.2015.02.049. [DOI] [PubMed] [Google Scholar]
- 38.Dewey FE, et al. Inactivating variants in ANGPTL4 and risk of coronary artery disease. N Engl J Med. 2016;374:1123–1133. doi: 10.1056/NEJMoa1510926. [DOI] [PMC free article] [PubMed] [Google Scholar]
- 39.Stitziel NO, et al. Coding variation in ANGPTL4, LPL, and SVEP1 and the risk of coronary disease. N Engl J Med. 2016;374:1134–1144. doi: 10.1056/NEJMoa1507652. [DOI] [PMC free article] [PubMed] [Google Scholar]
- 40.Do R, et al. Exome sequencing identifies rare LDLR and APOA5 alleles conferring risk for myocardial infarction. Nature. 2015;518:102–106. doi: 10.1038/nature13917. [DOI] [PMC free article] [PubMed] [Google Scholar]
- 41.Peloso GM, et al. Association of low-frequency and rare coding-sequence variants with blood lipids and coronary heart disease in 56,000 whites and blacks. Am J Hum Genet. 2014;94:223–232. doi: 10.1016/j.ajhg.2014.01.009. [DOI] [PMC free article] [PubMed] [Google Scholar]
- 42.MacLean B, et al. Skyline: an open source document editor for creating and analyzing targeted proteomics experiments. Bioinformatics. 2010;26:966–968. doi: 10.1093/bioinformatics/btq054. [DOI] [PMC free article] [PubMed] [Google Scholar]
- 43.Mucaki EJ, Shirley BC, Rogan PK. Prediction of mutant mRNA splice isoforms by information theory–based exon definition. Hum Mutat. 2013;34:557–565. doi: 10.1002/humu.22277. [DOI] [PubMed] [Google Scholar]
- 44.Ibrahim S, Somanathan S, Billheimer J, Wilson JM, Rader DJ. Stable liver-specific expression of human IDOL in humanized mice raises plasma cholesterol. Cardiovasc Res. 2016;110:23–29. doi: 10.1093/cvr/cvw010. [DOI] [PMC free article] [PubMed] [Google Scholar]
- 45.Somanathan S, et al. AAV vectors expressing LDLR gain-of-function variants demonstrate increased efficacy in mouse models of familial hypercholesterolemia. Circ Res. 2014;115:591–599. doi: 10.1161/CIRCRESAHA.115.304008. [DOI] [PMC free article] [PubMed] [Google Scholar]
- 46.Chen SJ, et al. Biodistribution of AAV8 vectors expressing human low-density lipoprotein receptor in a mouse model of homozygous familial hypercholesterolemia. Hum Gene Ther Clin Dev. 2013;24:154–160. doi: 10.1089/humc.2013.082. [DOI] [PMC free article] [PubMed] [Google Scholar]
- 47.Kassim SH, et al. Adeno-associated virus serotype 8 gene therapy leads to significant lowering of plasma cholesterol levels in humanized mouse models of homozygous and heterozygous familial hypercholesterolemia. Hum Gene Ther. 2013;24:19–26. doi: 10.1089/hum.2012.108. [DOI] [PMC free article] [PubMed] [Google Scholar]
- 48.Rader DJ, Castro G, Zech LA, Fruchart JC, Brewer HB., Jr In vivo metabolism of apolipoprotein A-I on high density lipoprotein particles LpA-I and LpA-I,A-II. J Lipid Res. 1991;32:1849–1859. [PubMed] [Google Scholar]
- 49.Cain WJ, et al. Lipoprotein [a] is cleared from the plasma primarily by the liver in a process mediated by apolipoprotein [a] J Lipid Res. 2005;46:2681–2691. doi: 10.1194/jlr.M500249-JLR200. [DOI] [PubMed] [Google Scholar]
- 50.Tanigawa H, et al. Expression of cholesteryl ester transfer protein in mice promotes macrophage reverse cholesterol transport. Circulation. 2007;116:1267–1273. doi: 10.1161/CIRCULATIONAHA.107.704254. [DOI] [PubMed] [Google Scholar]
- 51.Ota T, Gayet C, Ginsberg HN. Inhibition of apolipoprotein B100 secretion by lipid-induced hepatic endoplasmic reticulum stress in rodents. J Clin Invest. 2008;118:316–332. doi: 10.1172/JCI32752. [DOI] [PMC free article] [PubMed] [Google Scholar]
- 52.McCoy MG, et al. Characterization of the lipolytic activity of endothelial lipase. J Lipid Res. 2002;43:921–929. [PubMed] [Google Scholar]
- 53.Larsson M, Vorrsjö E, Talmud P, Lookene A, Olivecrona G. Apolipoproteins C-I and C-III inhibit lipoprotein lipase activity by displacement of the enzyme from lipid droplets. J Biol Chem. 2013;288:33997–34008. doi: 10.1074/jbc.M113.495366. [DOI] [PMC free article] [PubMed] [Google Scholar]
Associated Data
This section collects any data citations, data availability statements, or supplementary materials included in this article.
Supplementary Materials
Data Availability Statement
The authors declare that all data relevant to supporting the conclusions of this study are present within the manuscript and its supplementary information. Exome Chip SNP genotyping data from human participants from the Penn Medicine BioBank and HHDL cohorts were deposited in the Gene Expression Omnibus (GEO) database (accession GSE100271). Additional requests for correspondence regarding data in this study may be made to the corresponding author (D.J.R.). Source data files for Figures 1–4 are available online.