Abstract
An extensive characterization of pristine and oxidized Ti3C2Tx (T: =O, -OH, -F) MXene showed that exposure of MXene to an anodic potential in the aqueous solution oxidizes the nanomaterial forming TiO2 layer or TiO2 domains with subsequent TiO2 dissolution by F- ions, making the resulting nanomaterial less electrochemically active compared to the pristine Ti3C2Tx. The Ti3C2Tx could be thus applied for electrochemical reactions in a cathodic potential window i.e. for ultrasensitive detection of H2O2 down to nM level with a response time of approx. 10 s. The manuscript also shows electrochemical behavior of Ti3C2Tx modified electrode towards oxidation of NADH and towards oxygen reduction reactions.
Keywords: Ti3C2Tx, H2O2 sensing, oxygen reduction reactions, NADH oxidation
1. Introduction
2D nanomaterials with a high specific surface area have a variety of promising properties, making them useful as carriers, novel electronic materials and as a part of optical devices, sensors and energy storage devices [1–4]. Since the description of properties of the first 2D nanomaterial – graphene in 2004 [5], there is an explosion of papers describing other 2D nanomaterials [6–10].
In 2011, a new family of 2D MXene nanomaterials were introduced [11], exhibiting more complex (layered) structure compared to graphene, having many specific properties, like metallic conductivity and hydrophilicity due to presence of a negative charge on the surface [12–14]. MXenes belong to a family of exfoliated transition metal carbides and carbonitrides synthe-sized by hydrofluoric acid (HF) etching of the “A” group element from “MAX” phase powders [15] (where “M” is a transition metal, “A” is an element mostly from groups 13 and 14 of a periodic table, and “X” is a carbon or a nitrogen atom [16]) resulting in 2D layered structure similar to graphenes [17].
The as-obtained MXene sheets are terminated with oxygen- and/or fluorine-containing functional groups (=O, -OH, -F). However, alkalization and calcination post-treatments were shown to remove these surface groups, thus enhancing electrical conductivity of the nanomaterial [18]. Up to now, the most common applications of MXenes are high capacity electrode materials for batteries [19–25], as supercapacitors [26] and pseudocapacitive cathode materials [27,28] or as an electromag-netic interference shielding material [4]. Environmental removal of Pb(II) ions using this nanomaterial was also reported [29]. Ti3C2Tx in a colloidal solution exhibits an antimicrobial activity, which is higher compared to graphene oxide (GO) [30]. An adsorption and a photocatalytic decomposition of organic molecules in aqueous solutions were observed, as well [31].
From a sensing point of view, Ti3C2 either in a pristine form [32] or combined with TiO2 nanoparticles [33] was shown to provide an excellent immobilization matrix for hemoglobin-based mediator- free biosensor for H2O2 detection with a limit of detection (LOD) down to 14 nM and an excellent biosensor stability [33]. The same platform was also used to investigate detection of NaNO2 with LOD of 120 nM [34]. The most recent study suggests immobilization of glucose oxidase on Ti3C2Tx MXene modified by gold nanoparticles as a biointerface for sensitive detection of glucose [35]. Also, an adsorption of different gases (NH3, H2, CH4, CO, CO2, N2, NO2 and O2) on Ti2CO2 monolayer was studied, resulting in an adsorption of only NH3 molecules, making this material applicable not only as a battery material, but also as a potential gas sensor and NH3 capturer with a high selectivity [36]. The most recent study described application of MXene patterned field-effect transistor for probing neural activity by detection of dopamine [37].
In this study, we focused on investigation of electrochemical performance of Ti3C2Tx in an aqueous solution for potential sensing applications. Ti3C2Tx was investigated for its ability to detect oxygen and hydrogen peroxide and to oxidize NADH, for potential future construction of biosensors. Ti3C2Tx modified electrode proved to be extremely sensitive for detection of H2O2 with LOD of 0.7 nM. Detection of H2O2 as an analyte is of importance in chemical and food industry (applied as an oxidizing agent) and for detection in clinical, pharmaceutical and environmental samples (see an excellent paper reviewing construction of H2O2 sensors [38]). Furthermore, H2O2 is a byproduct of enzymatic action of various oxidases so efficient detection of H2O2 is very important for development of oxidase-based biosensors utilizable in numerous applications [39–42].
2. Materials and methods
2.1. Materials
All chemicals (i.e. K3[Fe(CN)6], K4[Fe(CN)6].3H2O, H2O2, H2SO4, NADH, NaOH, DMSO) and phosphate buffer (PB) components (KH2PO4 and K2HPO4, pH 7.0), were of ≥99% purity or p.a. grade and were purchased from Sigma Aldrich (USA). 50 wt% HF was obtained from Fisher Scientific, USA. All solutions were freshly prepared in 0.055 μS ultrapure deionized water (DW) and filtered prior use using 0.2 μm sterile filters.
2.2. Ti3C2Tx MXene synthesis
Ti3AlC2 was synthesized as described previously [43]. Multi-layer Ti3C2 MXene was prepared by HF treatment protocol with a minor modification. Briefly, Ti3AlC2 was added slowly to an aqueous HF solution (50 wt%) for 18 h at room temperature followed by intercalation with DMSO. The reaction mixture was washed several times with DW until pH 6 was reached. The colloidal solution of delaminated Ti3C2Tx dispersion was obtained by sonication of Ti3C2Tx powders (1 mg) in 2 mL of DW water, which was purged with argon for 60 min prior sonication, followed by centrifugation of the dispersion at 3,000 rpm for 1 h with a final collection of the supernatant.
2.3. Electrochemical procedures
All electrochemical procedures were run on a laboratory potentiostat/galvanostat Autolab PGSTAT 302N with an impedi-metric module (Ecochemie, Utrecht, Netherlands) with a glassy carbon electrode (GCE, d= 3 mm, Bioanalytical systems, USA) used as a working electrode. Chronoamperometric detection of H2O2 at 300 rpm was performed on a rotating disc electrode employed as a working electrode. An Ag/AgCl/3 M KCl reference electrode and a counter Pt electrode (Bioanalytical systems, USA) were applied in a three-electrode cell system. Measurements were run under Nova Software 1.10, and data acquired were evaluated using OriginPro 9.1.
Chronoamperometry was applied as a useful method for determination of real surface area of Ti3C2Tx modified GCE, which was calculated from a Cottrell equation:
| (eqn. 1) |
where n is the number of electrons exchanged, F is a Faraday constant (96,485 C mol-1), c0j is concentration of the electrochemical mediator i.e. ferricyanide (mol cm-3), D is the diffusion coefficient (7.6 10-6 cm2 s-1 for ferricyanide solution used in this study), t is time (in s) and A is the real surface area (in cm2). The experiment was conducted by applying two potentials (0.2 V and -0.6 V, respectively) for the reduction of 1 mM ferricyanide solution in 0.2 M KCl. Under diffusion control, a plot of i vs. t-1/2 is linear and from the slope, the value of A could be obtained. Real surface area of Ti3C2Tx modified GCE was 13.3 mm2, while a geometric surface area of GCE was 7.1 mm2.
Electrochemical impedance spectroscopy (EIS) can provide characteristics of an interfacial layer using a redox probe. The result of EIS analysis is presented in a Nyquist plot, from which such characteristics can be obtained. EIS was measured in an electrolyte containing 5 mM potassium hexacyanoferrate (III), 5 mM potassium hexacyanoferrate (II) and 0.1 M PB, pH 7.0. The analysis was run at 50 different frequencies (ranging from 0.1 Hz up to 100 kHz) under Nova Software 1.10 (Ecochemie, Netherlands). The results were presented in a form of a Nyquist plot, with an equivalent circuit R(Q[RW]) applied for data fitting.
2.4. Electrode modifications
First, the GCE was polished with a 1.0 μm alumina slurry and diamond polishing paste and sonicated in DW. The cleaned GCE was subsequently dried using a purified nitrogen stream. In order to obtain homogeneous Ti3C2Tx dispersion, Ti3C2Tx solution was sonicated for 1 min, if not specified otherwise, under Ar atmo-sphere to prevent potential oxidation of MXene. The Ti3C2Tx modified electrode was prepared by a simple drop-casting method. The final volume of 30 mL of a MXene dispersion was pipetted on the GCE in two steps (2 x 15 μL) and allowed to dry at room temperature in a laminar box.
2.5. Preparation of oxidized Ti3C2Tx (o Ti3C2Tx)
Oxidation of Ti3C2Tx was performed in 0.1 M PB pH 7.0 by a linear sweep voltammetry (LSV) running from 0 mV to 500 mV at a sweep rate of 100 mV s-1.
2.6. Characterization of Ti3C2Tx and o Ti3C2Tx
Raman spectra were measured with a DXR Raman Microscope (Thermo Scientific, USA) with 532 nm laser in the region from 3,350 to 52 cm-1 (laser power 0.5 mW, exposure time 20 s, number of exposures 10, slit: 50 μm).
Contact angle measurements were run on a portable instrument System E (Advex Instruments, Czech Republic) to reveal contact angle and free surface energy for Ti3C2Tx modified interfaces. The droplet volume was 2 μL and the testing liquid was distilled water. Free surface energy was determined using the two-liquid Owens-Wendt (OW) method, where the total surface energy γ consists of disperse γd and polar γp components. Water and diiodomethane were used as test liquids (surface tension values according to Strom). In order to minimize measurement error, 5 contact angles were measured, with the highest and the lowest value eliminated. For each sample, the water and diiodomethane contact angle was obtained as an average value of assays performed using 3 droplets.
A peak force tapping mode atomic force microscopy (AFM, Scan Asyst, Bruker, USA) in air was carried out on a Bioscope Catalyst instrument and Olympus IX71 microscope in conjunction with NanoScope 8.15 software at a scan rate of 0.5 line s-1 with the tip set automatically for optimal gain. AFM mica substrates (grade V-1, d = 12 mm, SPI Supplies, USA) modified with Ti3C2Tx were scanned using a SCANASYST-AIR silicon tip on a nitride lever (Bruker, USA, with f0 = 50–90 kHz and k = 0.4 N m-1), sharpened to a tip radius of 2 nm.
The same modified substrates i.e. modified square shaped gold chips (Arrandee, Germany) as for AFM imaging were applied for obtaining scanning electron microscopy (SEM) images using Carl Zeiss EVO 40HV apparatus (Germany) after Au CVD treatment to observe the structure of Ti3C2Tx.
XPS signals for Ti3C2Tx and o Ti3C2Tx were recorded on modified square shaped Au chips (Arrandee, Germany) using a Thermo Scientific K-Alpha XPS system (Thermo Fisher Scientific, UK) equipped with a micro-focused, monochromatic Al K alpha X-ray source (1486.6 eV). An X-ray beam of 400 μm size was used at 6 mA x 12 kV. The spectra were acquired in the constant analyzer energy mode with pass energy of 200 eV for the survey. Narrow regions were collected with pass energy of 50 eV. Charge compensation was achieved with the system flood gun that provides low energy electrons (~0 eV) and low energy argon ions (20 eV) from a single source. The argon partial pressure was 2 x 10⁻⁷ mbar in the analysis chamber. The Thermo Scientific Avantage software, version 4.84 (Thermo Fisher Scientific), was used for digital acquisition and data processing. Spectral calibra-tion was determined using the automated calibration routine and the internal Au, Ag and Cu standards supplied with the K-Alpha system. The surface compositions (in atomic %) were determined by considering the integrated peak areas of atoms and the respective sensitivity factors.
Ti3C2Tx was further characterized using X-Ray powder diffrac-tion (XRD) measurements to investigate crystal structure of the material. Typical samples were prepared by pipetting of 20 μL of Ti3C2Tx dispersion (1.5 mg mL-1 in DW, sonication for 30 min unless stated otherwise) on a glass slide, dried under reduced pressure, gently rinsed with DW to wash out any particles not incorporated into the formed Ti3C2Tx film and dried in Ar stream. The samples were characterized using XRD equipment Empyrean with irradiation source Cu Kα1 (λ=0.15406 nm) at tension 45 kV and current 40 mA and detector PIXcel1D with stage platform with adjustable Z-height (all from PANalaytical). Value of Z-height was determined for each sample using micrometer. X-ray diffraction was observed in gonio mode in 2Θ range of 4°–20° with step size 0.0066° and scan speed 0.055° s-1. Size of the main lattice distance (d) corresponds to the peak position, i.e. to the angle of the diffracted beam, according to the Bragg's law λ = 2d sin Θ, where λ is 0.15406 nm and sin Θ was calculated from the position 2Θ of the given XRD peak. The domain size can be calculated using Scherrer formula s = K λ/β cos Θ where s, K and β stands for a mean domain size, a shape factor (0.9) and a broadness of the peak in half its maximum intensity (FWHM) in radians, respectively.
Secondary Ion Mass Spectrometry (SIMS) is a technique for sensitive chemical surface analysis of samples [44]. The analysis is not limited by the origin or type of a sample, that can be substantially any, inorganic, organic and biological. SIMS employing Time-of-Flight (TOF) analyzer provides elemental, chemical state and molecular information from surface layers or thin film structures with high sensitivity on the level of ppm-ppb. Besides, TOF SIMS IV spectrometers could provide high mass resolution, lateral resolution of 100 nm and a depth resolution of 1 nm. With the primary ion beam scanning across the sample surface, even the 2D chemical imaging of elements or molecules can be obtained providing data on a spatial distribution of predefined species [44]. Mass spectrometry measurements were performed using a TOF-SIMS IV (ION-TOF, Muenster, Germany), a reflectron type of time-of-flight mass spectrometer equipped with a Bismuth ion source. Pulsed 25 keV Bi+ were used as primary ions with ion current of 1.1 pA. The TOF-SIMS spectra were measured by scanning over the 100 μm x 100 μm analysis area with a total primary ion dose density below the static limit of 1013 ions cm-2. SIMS images were measured by scanning over the 200 μm x 200 μm analysis area, with a lateral resolution of 5 mm. All assays were performed in a positive and a negative polarity.
3. Results and discussion
3.1. Microscopic characterization of Ti3C2Tx modified GCE
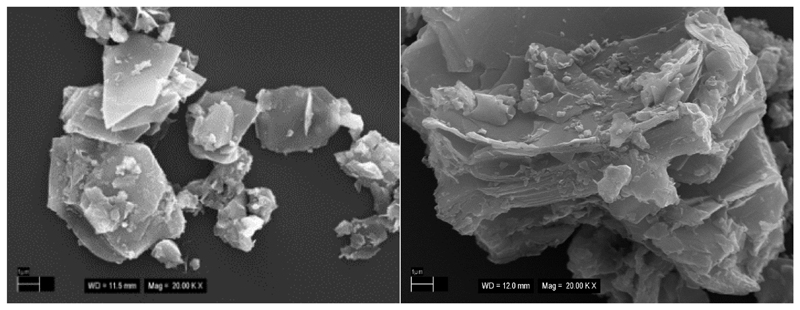
SEM images revealed formation of aggregates on the surface differing in size i.e. having few mm in size (Fig. 1 left) or with size larger than 10 μm (Fig. 1 right).
Fig. 1.
Representative SEM images of Ti3C2Tx sonicated for 1 min. Magnification: 20,000x.
3.2. Electrochemical oxidation of Ti3C2Tx (preparation of oTi3C2Tx)
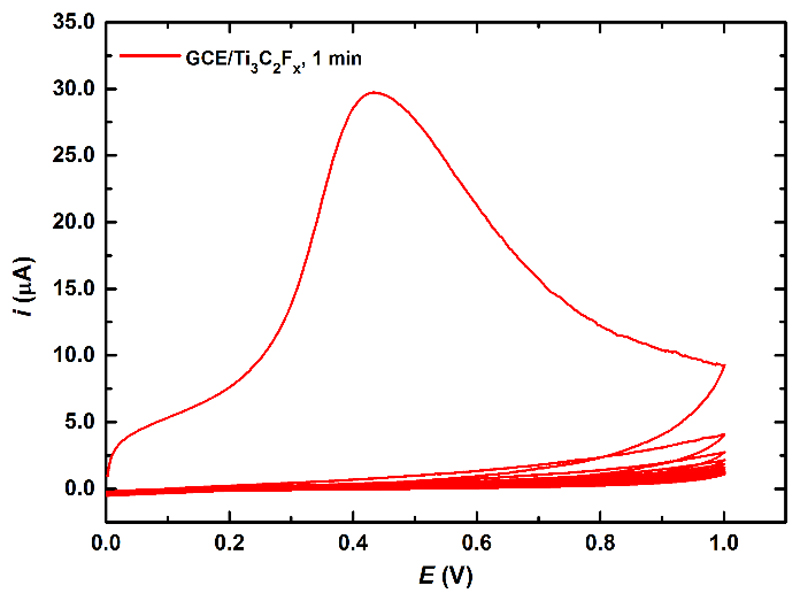
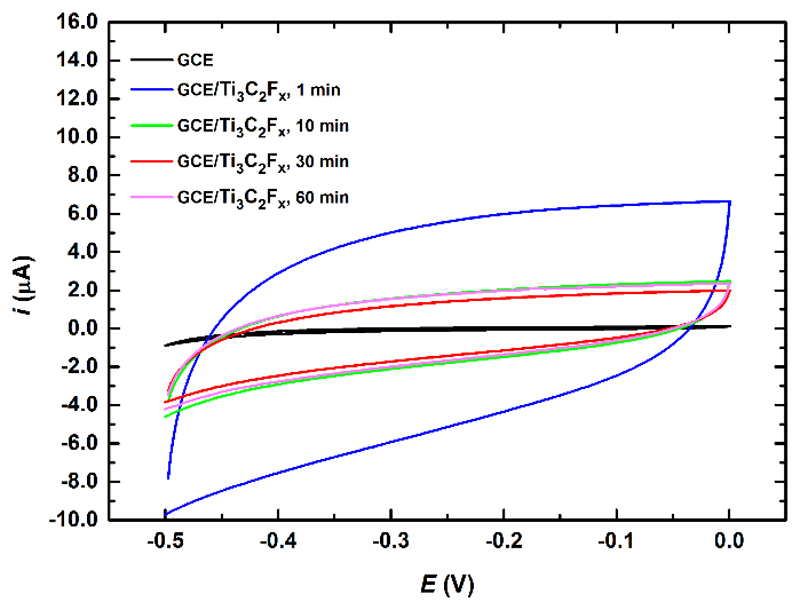
Initial cyclic voltammetry (CV) experiments confirmed that an anodic oxidation of Ti3C2Tx is an irreversible process with an anodic peak appearing only in the first CV scan at a potential of 430 mV and could not be observed in the subsequent CV scans (Fig. 2). Further experiments revealed that this anodic peak appeared only once and could not be seen if the Ti3C2Tx modified GCE was further reduced by running CV in the potential window from 0 mV to -500 mV (as shown in Fig. 3), from -500 mV to -1,000 mV (data not shown) or after the Ti3C2Tx modified GCE electrode was kept at an open circuit potential for couple of minutes. This really indicates irreversible oxidation of Ti3C2Tx upon exposure to an anodic potential, which could not be re-reduced.
Fig. 2.
CV of GCE/Ti3C2Tx showing several consecutive scans run in a potential window from 0 V to 1 V at a sweep rate of 100 mV s-1 in 0.1 M PB pH 7.0. Ti3C2Tx dispersion was prepared by 1 min sonication. Further details are provided in the Experimental section.
Fig. 3.
CVs performed in 0.1 M PB pH 7.0 at bare GCE and at GCE/Ti3C2Tx run at a scan rate of 100 mV s-1. Ti3C2Tx dispersions deposited on GCE were prepared by sonication of the mixture for 1, 10, 30 or 60 min.
Optimization of sonication time for preparation of Ti3C2Tx dispersions was performed also electrochemically either by running CV in the potential window from 0 mV to -500 mV (Fig. 3) or in the potential window from 0 mV to 1,000 mV (Fig. S1). Such CV experiments confirmed that optimal sonication time for preparation of Ti3C2Tx dispersion was 1 min. An increase of sonication time from 1 min to 10 min led to decrease of a Faradaic current (Fig. S1) or a capacitive current (Fig. 3). Sonication time longer than 10 min (up to 60 min) did not have a detrimental effect on the electrochemical behavior of Ti3C2Tx modified GCE (Fig. 3 and Fig. S1). When Ti3C2Tx modified GCE was exposed to potentials above 200 mV, it was possible to observe partial dissolution of the material from the modified GCE by a naked eye.
3.3. Raman spectra analysis
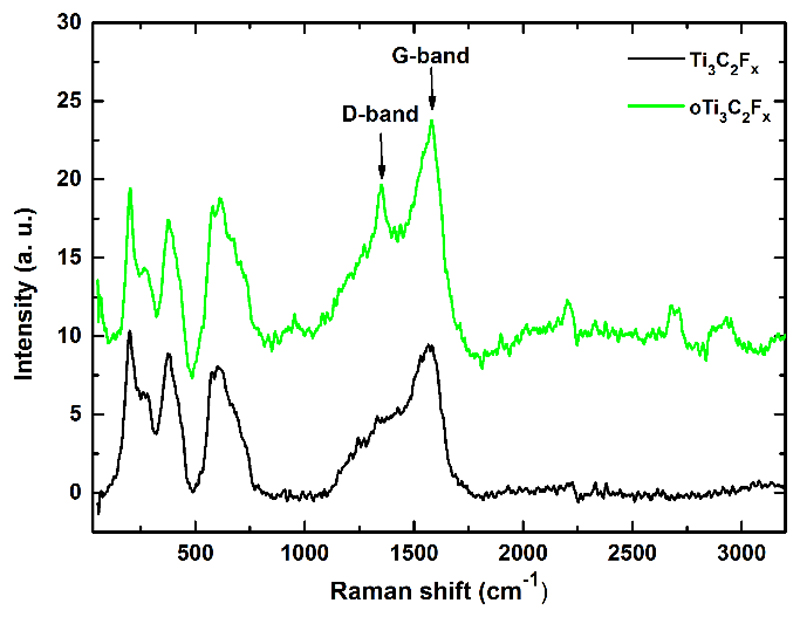
Results indicated that optimal power density for obtaining Raman spectra was 0.5 mW (Fig. S2) and an optimal sonication time was 1 min, in an agreement with results obtained from electrochemical assays. The Raman spectrum of Ti3C2Tx modified GCE showing peaks at 200, 380 and 610 cm-1 (Fig. 4) is in an agreement with results obtained in a previous study [45].
Fig. 4.
Representative Raman spectra of Ti3C2Tx and oTi3C2Tx acquired with laser power set to 0.5 mW.
Moreover, intensity of D-band (1,391 cm-1) compared to G-band (1,596 cm-1) is very low, in agreement with a previous study, as well [45]. When oTi3C2Tx was inspected by Raman spectroscopy the spectra looked very similar to Raman spectra of Ti3C2Tx, with the only difference i.e. presence of a well-developed D-band at 1,391 cm-1, indicating induction of disorder within oTi3C2Tx (Fig. 4) [46]. Interestingly, in the Raman spectrum of oMXene a major peak at 144 cm-1 and other minor peaks observed at 394, 513 and 635 cm-1 (attributed to anatase TiO2) [22,45] are not visible, indicating low density of anatase TiO2 on the surface of oTi3C2Tx.
3.4. Contact angle measurements
Contact angle measurements obtained using an Owens-Wendt- Rable-Kaeble model are summarized in Table S1. A decrease of contact angle in water (from 36° to 30°) and an increase of a polar component of a free surface energy (from 30 mJ m-2 to 35 mJ m-2) for oTi3C2Tx compared to Ti3C2Tx indicate that oxidation of the sample by LSV introduced polar functional groups into the sample of oTi3C2Tx or removed F- groups making the surface of oTi3C2Tx more hydrophilic compared to Ti3C2Tx. The contact angle of 36° measured on Ti3C2Tx is in an excellent agreement with a previous study showing a value of 34° [17]. Images from such measurements are shown in Fig. S3.
3.5. AFM measurements
AFM measurements were performed to see surface morphology of Ti3C2Tx or oTi3C2Tx layers and results indicated a substantial decrease in the value of mean square roughness (Rq) for Ti3C2Tx with a value of 1.6 nm compared to oTi3C2Tx modified interface with a value of 0.2 nm. Presence of either higher or deeper features on Ti3C2Tx interface compared to oTi3C2Tx could be anticipated when looking on a parameter of image Rmax (i.e. a value of 10.5 nm for Ti3C2Tx and a value of 1.4 nm for oTi3C2Tx) (Table S2) [22]. Typical AFM images of Ti3C2Tx and oTi3C2Tx modified gold chips are shown in Fig. 5. However, oTi3C2Tx modified gold surface is not completely flat as could be indicated from Fig. 5 right, but exhibits a moderate roughness (Fig. S4).
Fig. 5.
Typical AFM image of Ti3C2Tx (left) and oTi3C2Tx (right) modified Au chip, showing rougher surface of Ti3C2Tx compared to oTi3C2Tx. In both cases z-axis was set to 11 nm.
AFM height profile analysis of a more concentrated sample deposited compared to Fig. 5 revealed a decrease in Ti3C2Tx film thickness (correlating with a decrease observed for Rq value) from (7.8 ± 0.8) nm to (2.2 ± 0.9) nm for oTi3C2Tx, respectively. Moreover, layers of Ti3C2Tx were clearly visible at the edge of each flake (as seen on Fig. S5 left). Thickness of these layers ranges from (0.9 ± 0.1) nm for oTi3C2Tx to (1.1 ± 0.1) nm for Ti3C2Tx, respectively, what correlates well with the previously published value for a Ti3C2Tx monolayer (1.0 ± 0.2) [47–49]. Average size of the isolated flakes on the surface was (123 ± 7) nm (correlating with the value of 100–200 nm range published previously) [50,51], as shown on Fig. S5 right, and the average surface density for the MXene films prepared was G = (88 ± 10) flakes mm-2 (2D projection of the 3D surface map).
3.6. XPS spectra
Analysis of both types of samples showed a significant decrease (from (18.8 ± 0.5) atomic % to (3.8 ± 1.7) atomic %) in F1 s content resulting in an increased hydrophilicity of oTi3C2Tx (Table S3, Fig. S6). The content of Ti decreased from (9.2 ± 0.1) atomic % for Ti3C2Tx to (4.4 ± 3.2) atomic % for oTi3C2Tx (as shown in Fig. S6 left) with an increase of carbon content from (42.9 ± 0.3) atomic % for Ti3C2Tx to (62.9 ± 5.7) atomic % for oTi3C2Tx. The content of oxygen within both samples is approximately the same i.e. (29.2 ± 0.9) atomic % for Ti3C2Tx or (29.0 ± 0.8) atomic % for oTi3C2Tx. It is quite interesting to point out to the fact that measuring an atomic composition of Ti3C2Tx by XPS was more reproducible with an average RSD of 1.9%, while an average RSD for measuring atomic composition of oTi3C2Tx was 32.3%, what can indicate more heterogeneous chemical and/or morphological composition of oTi3C2Tx surface compared to Ti3C2Tx.
3.7. XRD analysis
For all samples, two major XRD peaks were observed (see Fig. S7). One at 2Θ = 6.09 ± 0.03° with calculated d lattice of 14.5 Å and an average domain size of 14 nm and the other one at 9.519 ± 0.001° with calculated d lattice of 9.28 Å and an average domain size of 143.4 nm. The former peak indices disintegration of some larger particles into smaller ones with more distant individual sheets confirming that the performed sonication leads to an exfoliation of Ti3C2Tx (see for example [17]). The former peak, on the other hand, revealed a presence of large particles (domain size of 143.4 nm, in agreement with AFM data discussed above) with smaller distance between individual sheets (i.e. 9.28 Å, again with agreement with AFM data discussed above), assigned most probably to the non-exfoliated material. This hypothesis is supported by a value of (11 ± 3) nm reported for particle size in 0001 direction for different MAXs after the HF treatment [11].
Besides the abovementioned two major peaks, small features at 19.107 ± 0.004° were detected and a pattern with one peak at 38.780 ± 0.004° and a second one at 38.876 ± 0.003°. Except for the first one, positions of all the peaks exhibited very narrow dispersions, suggesting that they should be assigned to crystallini-ty patterns which are not influenced by inevitable random variances in Ti3C2Tx exfoliation and deposition steps. On the other side, the first peak is broad with a larger position values interval, suggesting that it originated from less regular structures, probably exfoliated Ti3C2Tx sheets loosely stacked to each other via van der Walls or hydrophobic interactions. It should be also noted, that the difference between d parameters of particles represented by the two major peaks, i.e. 5.22 nm, is very close to the value reported by Lukatskaya et al. [52] for a lattice size change caused by intercalation of K+ or NH4+ ion between Ti3C2Tx sheets.
3.8. Secondary ion mass spectrometry (SIMS) analysis
SIMS is a technique for sensitive chemical surface analysis of samples [44]. In Fig. S8 and Fig. S9 there are shown representative mass spectra obtained for Ti3C2Tx and oTi3C2Tx by SIMS. LSV procedure to prepare oTi3C2Tx was performed on Ti3C2Tx deposited on bare Au chip (prepared by CVD method). In the mass spectrum of Ti3C2Tx (Fig. S8) it was possible to see peaks, which were attributed to Ti+ and TiO+, but such peaks were not observed, when oTi3C2Tx was analyzed indicating most likely removal of an outer Ti layer from Ti3C2Tx during exposure of Ti3C2Tx to an anodic potential. A closer look at data presented in Fig. S8 showed an interesting fact that from Ti3C2Tx, ions of carbon with lower amount of oxygen (i.e. C22H29O2+, C23H31O2+ and C24H33O2+) were released and such ions could not be generated from oTi3C2Tx and that oTi3C2Tx contains highly oxidized carbon molecules indicated by presence of ions such as C25H25O4+, C26H27O4+ and C27H29O4+, which were not present in Ti3C2Tx spectra. Furthermore, SIMS analysis revealed presence of F- in the spectra acquired from Ti3C2Tx, while a peak attributed to presence of F- ions in the spectra of oTi3C2Tx was less intensive in order of magnitude compared to Ti3C2Tx (Fig. S10 and Fig. S11).
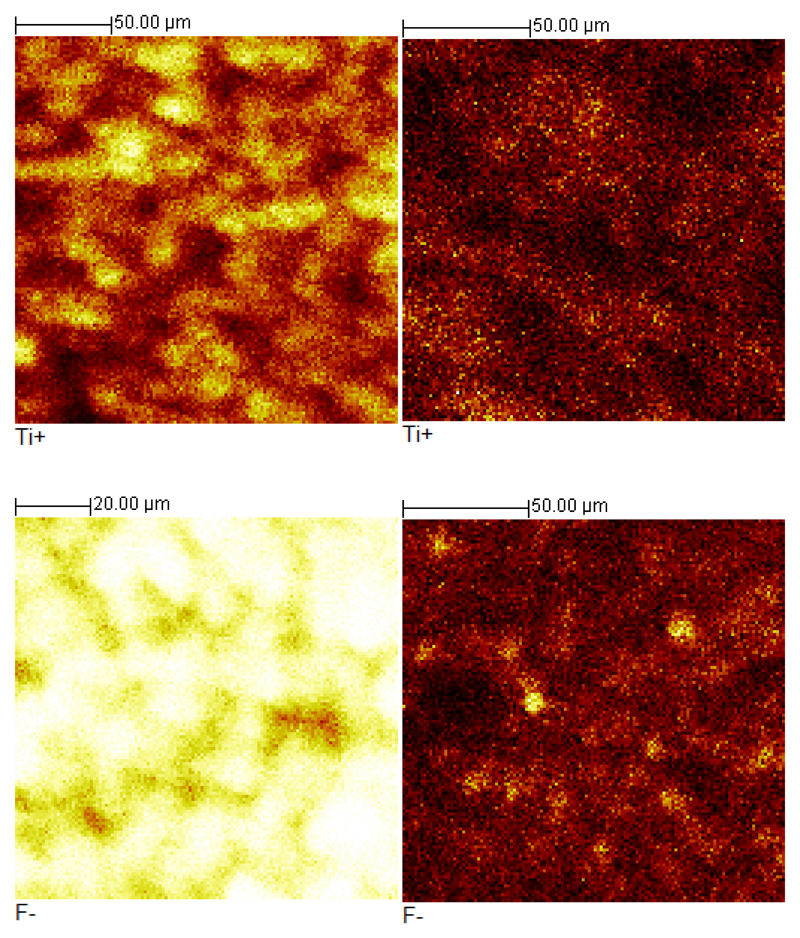
In Fig. S12 and Fig. S13 there are representative SIMS 2D images of fragments released from Ti3C2Tx and oTi3C2Tx shown. Fragments detected in both samples (from upper left to middle right) are as follows: Li+, CH3+, Na+, C2H5+, Ti+ and Au+. For bare Ti3C2Tx, isolated islets of Ti (10–20 mm) could be observed, in contrast to oTi3C2Tx, where the Ti coverage is more uniform, however, with lower Ti intensity compared to Ti3C2Tx (Fig. 6).
Fig. 6.
SIMS 2D images for Ti+ fragments of Ti3C2Tx (left) and oTi3C2Tx (right) in a positive polarity (upper row) and SIMS 2D images for F- fragments of Ti3C2Tx (left) and oTi3C2Tx (right) in a negative polarity (lower row).
From all these characterization techniques we can make some conclusions: 1) from XPS and SIMS experiments it is clear that especially outer Ti containing layer of Ti3C2Tx is influenced by application of an anodic voltage since SIMS image showed lower intensity of the upper Ti layer in the oTi3C2Tx sample compared to Ti3C2Tx, while XPS spectra with a laser beam reaching deeper into the oTi3C2Tx layer provided evidence about presence of Ti species in the sample of oTi3C2Tx; 2) XPS measurements confirmed dramatic decrease of fluoride content from (18.8 ± 0.5) atomic % for Ti3C2Tx to (3.8 ± 1.7) atomic % for oTi3C2Tx (Fig. S6 right) and SIMS experiments confirmed that the intensity of F- ions is an order of magnitude lower in oTi3C2Tx sample compared to Ti3C2Tx sample (Fig. S14 and Fig. S15), while F- were present in Ti3C2Tx sample (F- peak area of 3,243,291 for Ti3C2Tx and 284,426 for oTi3C2Tx with intensity of F- peaks normalized to total ion intensity for both samples, as shown in Fig. 6); 3) dissolution of some material from GCE/Ti3C2Tx during exposure to an anodic potential seen by a naked eye.
Based on these observations and using data already published in the literature we could propose the following equation behind oxidation of an outer layer of Ti3C2Tx during exposure to an anodic potential:
| (eqn. 2) |
When Ti3C2Fx containing F- ions is oxidized by the anodic potential it is oxidized to TiO2 and most likely CO/CO2 is emitted, an assumption based on oxidation of another type of MXene (i.e. Ti2CTx-based one) by H2O2 performed in DW [22]. After formation of TiO2 on the outer layer of Ti3C2Fx by an anodic applied voltage in presence of F- ions a further step would be a dissolution of TiO2 by forming a complex with F- ions according to this equation [53]:
| (eqn. 3) |
This proposed mechanism explains both decrease of Ti and F- content in the oTi3C2Fx sample as measured by XPS and SIMS. In a previous study formation of TiO2 layer or TiO2 islands on the surface of Ti2CTx MXene was observed, while exposing MXene to H2O2 in distilled water [22]. Since this reaction was performed in distilled water with concentration of H+ ions too low, chemical etching via F- ions destroying TiO2 layer could not proceed (i.e. eqn. (3)). In the second study, formation of either rutile or anatase TiO2 nanoparticles were formed on the surface of Ti3C2Tx MXene by exposure to flash oxidation conditions (950 °C; 1 min) or to slow heating (450 °C; 2 h) [54]. This MXene sample equally as our Ti3C2Tx sample contained F- ions [54], but the main reasons why F- did not dissolve forming TiO2 nanoparticles in the previous study most likely was that high temperature applied effectively removed F- ions, as suggested previously [18].
3.9. Electrochemical impedance spectroscopy (EIS) analysis
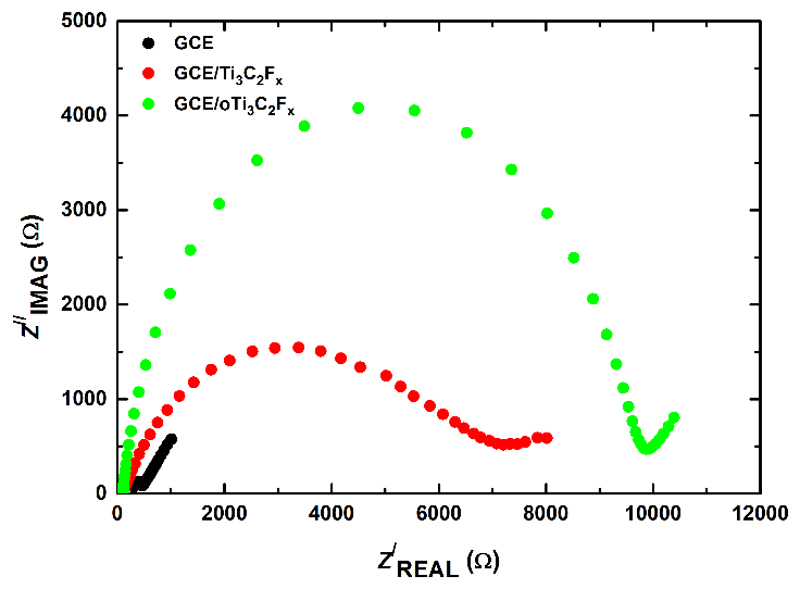
Using a R(Q[RW]) Randles equivalent circuit, the Rct values obtained for bare GCE, Ti3C2Tx modified GCE and oTi3C2Tx modified GCE were (164 ± 36) Ω, (7,130 ± 600) Ω and (8,500 ± 1,000) Ω, respectively (Fig. 7), suggesting an increase of resistivity of oTi3C2Tx compared to Ti3C2Tx indicating that oTi3C2Tx is less conductive than oTi3C2Tx.
Fig. 7.
Representative Nyquist plots at bare GCE, GCE/Ti3C2Tx and GCE/oTi3C2Tx obtained in 5 mM ferricyanide/ferrocyanide solution in 0.1 M PB pH 7.0. For the assay 50 different frequencies in the range from 1.0 Hz to 10 kHz were applied.
3.10. Electrochemical oxidation of NADH
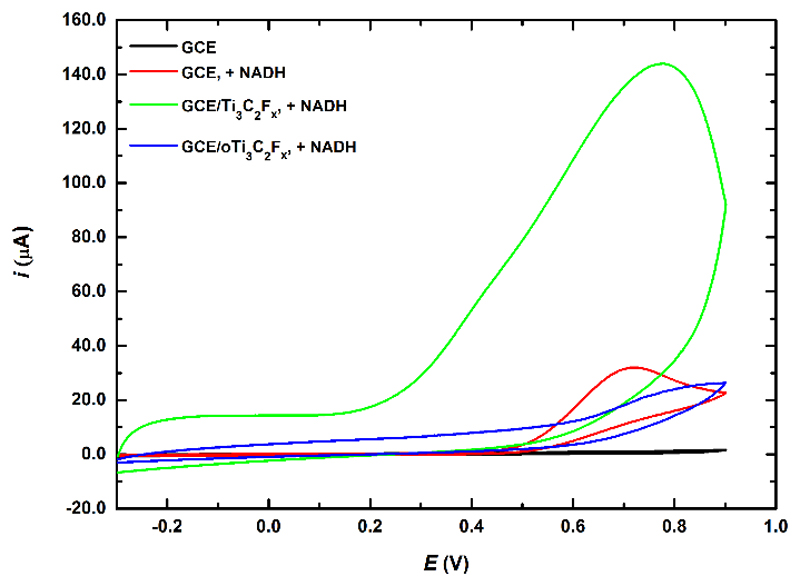
An interesting analyte applicable for proper function of enzyme-based biosensors is NADH, which is a byproduct of enzymatic action of dehydrogenases. There is a large anodic peak of NADH oxidation on Ti3C2Tx modified GCE indicating a beneficial redox behavior of Ti3C2Tx towards oxidation of NADH (Fig. 8). The onset potential for NADH oxidation is close to 200 mV, what is an attractive feature for potential construction of dehydrogenase- based biosensors operating with NADH as a cofactor and a value similar to the value obtained with the electrode modified by chemically reduced GO [55]. Oxidized Ti3C2Tx exhibited much lower oxidation current of 23 mA (325 mA cm-2, expressed per geometric surface area as usually described in the literature) compared to Ti3C2Tx with a value of 144 mA (i.e., 2.04 mA cm-2, both read at an applied potential of +780 mV) in presence of 2 mM NADH. A control experiment performed by oxidation of 2 mM NADH on GCE revealed a current of 32 mA, while a value of 19 mA (both read at a potential of 718 mV) was observed at GCE/oTi3C2Tx surface.
Fig. 8.
CVs performed in 0.1 M PB pH 7.0 and in 2 mM NADH solution at bare GCE electrode and Ti3C2Tx modified GCE run at a scan rate of 100 mV s-1.
When CV experiment was performed with several scans, the experiment revealed that the beneficial redox behavior of Ti3C2Tx substantially dropped in the 2nd scan and a further decrease of an anodic current with an increased number of scans was observed (Fig. S16). Furthermore, chronoamperometric experiment (Fig. S17) confirmed that exposure of Ti3C2Tx modified GCE to an anodic potential of 700 mV resulted in a decreased ability of Ti3C2Tx modified GCE to oxidize NADH with the same current observed after 1 h on bare GCE and on Ti3C2Tx modified GCE.
3.11. Oxygen reduction reaction (ORR)
From previous electrochemical investigations it was clear that Ti3C2Tx modified GCE was possible to apply only for redox reactions, which occur in a cathodic potential window. This is why we tested performance of Ti3C2Tx modified GCE for ORR and for reduction of H2O2, reactions, which can be applied for construction of sensors or biosensors. ORR is of high importance for many applications, e.g. hydrogen-oxygen fuel cells, metal-air batteries and biosensors, as well [56].
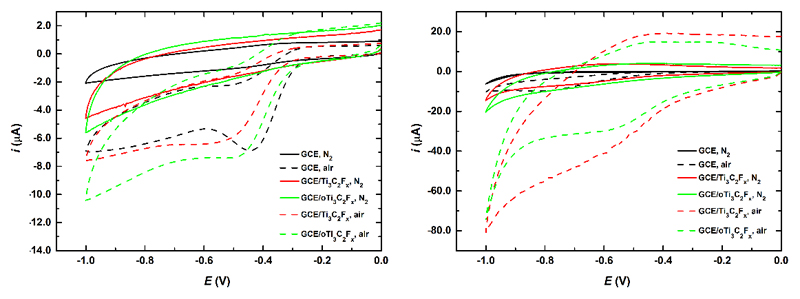
The results indicate that especially acidic environment i.e. 0.1 M H2SO4 is suitable for ORR to occur with a possibility to achieve a moderate current density in presence of oxygen and again it was confirmed that oTi3C2Tx has only a limited ability to reduce oxygen compared to Ti3C2Tx modified GCE (Fig. 9). The current density of 330 mA cm-2 (at -590 mV) for oTi3C2Tx and current density of 500 mA cm-2 (at -590 mV) for Ti3C2Tx were observed when CV assayed in presence of air were subtracted from CV obtained under N2 atmosphere.
Fig. 9.
CVs of ORR run at bare GCE, GCE/Ti3C2Tx and GCE/oTi3C2Tx in 0.1 M NaOH (left) or 0.1 M H2SO4 (right) under N2 and air atmosphere. The experiments were run at a sweep rate of 100 mV s-1.
In an alkaline solution, subtracted CV for ORR measured in 0.1 M NaOH showed an onset potentials at -500 mV for oTi3C2Tx and at -550 mV for Ti3C2Tx with a maximal current density of 80 mA cm-2 for oTi3C2Tx and 63 mA cm-2 for Ti3C2Tx. In a previous study an onset potential for ORR in 0.1 M NaOH of -450 mV and -700 mV was reported for graphene with a current density of 180 mA cm-2 using a rotating disc electrode (1,000 rpm) [57]. The same study showed that N-doped graphene showed an onset potential for ORR in 0.1 M NaOH of -200 mV with a limiting current density of ~800 mA cm-2 using a rotating disc electrode (1,000 rpm), while Pt/C electrode showed a limiting current density of ~220 mA cm-2 [57]. Furthermore, effectivity of ORR reaction can be enhanced by attachment of nanoparticles (i.e. Co nanoparticles) to N-doped graphene with an onset potential at -200 mV and a limiting current density of 4–5 mA cm-2 [58]. Thus, even though oTi3C2Tx and Ti3C2Tx without any further modifications are not as good catalysts for ORR in acidic and alkaline solutions as the best catalysts described in the literature (such are for example noble metal-free, nitrogen and sulphur co-doped graphene/carbon-nanotube material decorated with Co nanoparticles offering current density of ~7 mA cm-2 in alkaline and acidic media [59]), Ti3C2Tx or oTi3C2Tx could be a good substrate for accommodation of various types of nanoparticles for subsequent effective ORR reactions in both media. Additional possible application of Ti3C2Tx to perform ORR is in construction of enzymatic biosensors using oxidases, which upon enzymatic action consume oxygen as a co-substrate [42] for analysis of a wide range of analytes.
3.12. Electrochemical reduction of H2O2
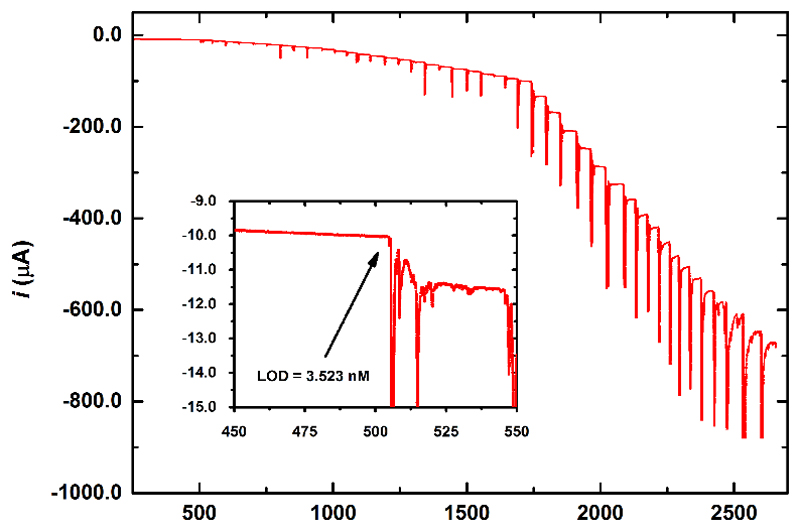
Reduction of H2O2 on Ti3C2Tx modified electrode started with an onset potential of -160 mV, comparable to the results obtained on chemically reduced GO [55] or carbon nanotube modified electrode [60]. Thus, it can be concluded that Ti3C2Tx modified electrodes could be applied in oxidase-based biosensing as effectively as graphene-based devices. The results indicated that H2O2 can be effectively reduced by Ti3C2Tx modified GCE and less effective by oTi3C2Tx modified GCE (Fig. S18). Moreover, intercalation of DMSO into Ti3C2Tx during Ti3C2Tx sonication resulted in a less effective redox behavior towards H2O2 reduction both for Ti3C2Tx and oTi3C2Tx modified GCE compared to GCE modified only by Ti3C2Tx or oTi3C2Tx without being intercalated with DMSO (Fig. S18). This is why we tested Ti3C2Tx modified GCE as a sensor for detection of H2O2 at an applied potential of -500 mV (Fig. 10). The noise of the sensor prior H2O2 addition was approx. 30 nA and if we apply S/N=3 for calculation of a limit of detection (LOD) then we could get LOD of 0.7 nM and if we take into account noise level of approx. 150 nA, after addition of H2O2, then we can calculate LOD as 3.5 nM (Fig. 10). The sensor towards H2O2 exhibited sensitivity of detection of 596 mA cm-2 mM-1 (Fig. S19). The response time for detection of H2O2 was approx. 10 s (Fig. 10). The H2O2 sensor based on Ti3C2Tx is much more sensitive compared to previously published H2O2 sensors with sensitivity up to 1.08 mA mM-1 cm-2 and LOD down to 20 nM [61–64]. There are however some papers reporting similar sensitivity or lower detection limits. For example Prussian blue based nanoelectrode array could reductively detect H2O2 down to 10 nM with a sensitivity of 60 mA μM-1 cm-2 [65], Prussian blue at Pt nanoparticles and carbon felt could detect H2O2 down to 1.2 nM with a sensitivity of 41 mA mM-1 cm-2 [66], Au-Pt nanoparticle-modified ionic liquid composite electrode could reductively detect H2O2 down to 0.3 nM with a sensitivity of 3.98 mA mM-1 cm-2 [67] and 3D porous Prussian blue layer deposited on graphene nanocomposite could detect H2O2 down to 5 nM [68].
Fig. 10.
Chronoamperogram recorded for Ti3C2Tx modified rotating disc electrode (RDE) in 0.1 M PB pH 7.0 with H2O2 additions at a working potential of -0.5 V. Arrow in the inset picture shows the first addition of stock H2O2 solution. Limit of detection was calculated as S/N = 3 from the 1st H2O2 injection.
4. Conclusions
The study showed that exposure of Ti3C2Tx to an anodic potential induces formation of TiO2, which is subsequently most likely etched from the Ti3C2Fx surface by present F- ions. However, pristine Ti3C2Tx could be effectively applied in a cathodic potential window for sensing purposes. Results suggested that Ti3C2Tx exhibits low catalytic activity for ORR run either in acidic or alkaline media, but Ti3C2Tx was proved as an excellent catalyst for reduction of H2O2, and the H2O2 sensor based on Ti3C2Tx is the most sensitive device described so far with a detection limit of 0.7 nM comparable to the best device described so far (i.e. 0.3 nM) [67]. It is possible that further modification of Ti3C2Tx by metallic nanoparticles could further enhance performance of modified Ti3C2Tx to detect H2O2.
Supplementary Material
Appendix A. Supplementary data Supplementary data associated with this article can be found, in the online version, at http://dx.doi.org/10.1016/j.electacta.2017.03.073.
Acknowledgements
Financial support received from the Slovak Scientific Grant Agency VEGA 2/0090/16 and from the Slovak Research and Development Agency APVV 14-0753 is acknowledged. The research leading to these results received funding from the European Research Council under the European Union’s Seventh Framework Program (FP/2007-2013)/ERC Grant Agreement no. 311532. This publication was made possible by NPRP grant no. 6-381-1-078 from the Qatar National Research Fund (a member of the Qatar Foundation). This publication is the result of the project implementation: Applied research in the field of industrial biocatalysis, ITMS code: 26240220079 supported by the Research & Development Operational Programme funded by the ERDF. Authors would like to thank prof. Yury Gogotsi for proving the sample of Ti3C2Tx MXene and for his valuable comments regarding the manuscript.
References
- [1].Kagan CR, Fernandez LE, Gogotsi Y, Hammond PT, Hersam MC, Nel AE, Penner RM, Willson CG, Weiss PS. Nano Day: Celebrating the Next Decade of Nanoscience and Nanotechnology. ACS Nano. 2016;10:9093–9103. doi: 10.1021/acsnano.6b06655. [DOI] [PubMed] [Google Scholar]
- [2].Wee ATS, Hersam MC, Chhowalla M, Gogotsi Y. An Update from Flatland. ACS Nano. 2016;10:8121–8123. doi: 10.1021/acsnano.6b06087. [DOI] [PubMed] [Google Scholar]
- [3].Mendoza-Sánchez B, Gogotsi Y. Synthesis of Two-Dimensional Materials for Capacitive Energy Storage. Adv Mater. 2016;28:6104–6135. doi: 10.1002/adma.201506133. [DOI] [PubMed] [Google Scholar]
- [4].Shahzad F, Alhabeb M, Hatter CB, Anasori B, Hong S Man, Koo CM, Gogotsi Y. Electromagnetic interference shielding with 2D transition metal carbides (MXenes) Science. 2016;353:1137–1140. doi: 10.1126/science.aag2421. [DOI] [PubMed] [Google Scholar]
- [5].Novoselov KS, Geim AK, Morozov SV, Jiang D, Zhang Y, Dubonos SV, Grigorieva IV, Firsov AA. Electric Field Effect in Atomically Thin Carbon Films. Science. 2004;306:666–669. doi: 10.1126/science.1102896. [DOI] [PubMed] [Google Scholar]
- [6].Pakdel A, Bando Y, Golberg D. Nano boron nitride flatland. Chem Soc Rev. 2014;43:934–959. doi: 10.1039/c3cs60260e. [DOI] [PubMed] [Google Scholar]
- [7].Sorkin V, Pan H, Shi H, Quek SY, Zhang YW. Nanoscale Transition Metal Dichalcogenides: Structures, Properties, and Applications. Crit Rev Solid State Mater Sci. 2014;39:319–367. [Google Scholar]
- [8].Halim J, Cook KM, Naguib M, Eklund P, Gogotsi Y, Rosen J, Barsoum MW. X-ray photoelectron spectroscopy of select multi-layered transition metal carbides (MXenes) Appl Surf Sci. 2016;362:406–417. [Google Scholar]
- [9].Miller DR, Akbar SA, Morris PA. Nanoscale metal oxide-based heterojunctions for gas sensing: A review. Sens Actuat B: Chem. 2014;204:250–272. [Google Scholar]
- [10].Zhang K, Han X, Hu Z, Zhang X, Tao Z, Chen J. Nanostructured Mn-based oxides for electrochemical energy storage and conversion. Chem Soc Rev. 2015;44:699–728. doi: 10.1039/c4cs00218k. [DOI] [PubMed] [Google Scholar]
- [11].Naguib M, Kurtoglu M, Presser V, Lu J, Niu J, Heon M, Hultman L, Gogotsi Y, Barsoum MW. Two-Dimensional Nanocrystals Produced by Exfoliation of Ti3AlC2. Adv Mater. 2011;23:4248–4253. doi: 10.1002/adma.201102306. [DOI] [PubMed] [Google Scholar]
- [12].Anasori B, Xie Y, Beidaghi M, Lu J, Hosler BC, Hultman L, Kent PRC, Gogotsi Y, Barsoum MW. Two-Dimensional, Ordered: Double Transition Metals Carbides (MXenes) ACS Nano. 2015;9:9507–9516. doi: 10.1021/acsnano.5b03591. [DOI] [PubMed] [Google Scholar]
- [13].Xie X, Zhao M-Q, Anasori B, Maleski K, Ren CE, Li J, Byles BW, Pomerantseva E, Wang G, Gogotsi Y. Porous heterostructured MXene/carbon nanotube composite paper with high volumetric capacity for sodium-based energy storage devices. Nano Energy. 2016;26:513–523. [Google Scholar]
- [14].Sang X, Xie Y, Lin M-W, Alhabeb M, Van Aken KL, Gogotsi Y, Kent PRC, Xiao K, Unocic RR. Atomic Defects in Monolayer Titanium Carbide (Ti3C2Tx) MXene. ACS Nano. 2016;10:9193–9200. doi: 10.1021/acsnano.6b05240. [DOI] [PubMed] [Google Scholar]
- [15].Wang K, Zhou Y, Xu W, Huang D, Wang Z, Hong M. Fabrication and thermal stability of two-dimensional carbide Ti3C2 nanosheets. Ceram Int. 2016;42:8419–8424. [Google Scholar]
- [16].Naguib M, Gogotsi Y. Synthesis of Two-Dimensional Materials by Selective Extraction. Acc Chem Res. 2015;48:128–135. doi: 10.1021/ar500346b. [DOI] [PubMed] [Google Scholar]
- [17].Naguib M, Mashtalir O, Carle J, Presser V, Lu J, Hultman L, Gogotsi Y, Barsoum MW. Two-Dimensional Transition Metal Carbides. ACS Nano. 2012;6:1322–1331. doi: 10.1021/nn204153h. [DOI] [PubMed] [Google Scholar]
- [18].Wang H, Wu Y, Zhang J, Li G, Huang H, Zhang X, Jiang Q. Enhancement of the electrical properties of MXene Ti3C2 nanosheets by post-treatments of alkalization and calcination. Mater Lett. 2015;160:537–540. [Google Scholar]
- [19].Xie Y, Dall’Agnese Y, Naguib M, Gogotsi Y, Barsoum MW, Zhuang HL, Kent PRC. Prediction and Characterization of MXene Nanosheet Anodes for Non- Lithium-Ion Batteries. ACS Nano. 2014;8:9606–9615. doi: 10.1021/nn503921j. [DOI] [PubMed] [Google Scholar]
- [20].Er D, Li J, Naguib M, Gogotsi Y, Shenoy VB. Ti3C2 MXene as a High Capacity Electrode Material for Metal (Li, Na K, Ca) Ion Batteries. ACS Appl Mater Interf. 2014;6:11173–11179. doi: 10.1021/am501144q. [DOI] [PubMed] [Google Scholar]
- [21].Liang X, Garsuch A, Nazar LF. Sulfur Cathodes Based on Conductive MXene Nanosheets for High-Performance Lithium–Sulfur Batteries. Angew Chem Int Ed. 2015;54:3907–3911. doi: 10.1002/anie.201410174. [DOI] [PubMed] [Google Scholar]
- [22].Ahmed B, Anjum DH, Hedhili MN, Gogotsi Y, Alshareef HN. H2O2 assisted room temperature oxidation of Ti2C MXene for Li-ion battery anodes. Nanoscale. 2016;8:7580–7587. doi: 10.1039/c6nr00002a. [DOI] [PubMed] [Google Scholar]
- [23].Ghidiu M, Halim J, Kota S, Bish D, Gogotsi Y, Barsoum MW. Ion-Exchange and Cation Solvation Reactions in Ti3C2 MXene. Chem Mater. 2016;28:3507–3514. [Google Scholar]
- [24].Byeon A, Zhao M-Q, Ren CE, Halim J, Kota S, Urbankowski P, Anasori B, Barsoum MW, Gogotsi Y. Two-Dimensional Titanium Carbide MXene As a Cathode Material for Hybrid Magnesium/Lithium-Ion Batteries. ACS Appl Mater Interf. 2016 doi: 10.1021/acsami.6b04198. [DOI] [PubMed] [Google Scholar]
- [25].Xu K, Ji X, Zhang B, Chen C, Ruan Y, Miao L, Jiang J. Charging/Discharging Dynamics in Two-Dimensional Titanium Carbide (MXene) Slit Nanopore: Insights from molecular dynamic study. Electrochim Acta. 2016;196:75–83. [Google Scholar]
- [26].Rakhi RB, Ahmed B, Hedhili MN, Anjum DH, Alshareef HN. Effect of Postetch Annealing Gas Composition on the Structural and Electrochemical Properties of Ti2CTx MXene Electrodes for Supercapacitor Applications. Chem Mater. 2015;27:5314–5323. [Google Scholar]
- [27].Ji X, Xu K, Chen C, Zhang B, Ruan Y, Liu J, Miao L, Jiang J. Probing the electrochemical capacitance of MXene nanosheets for high-performance pseudocapacitors. Phys Chem Chem Phys. 2016;18:4460–4467. doi: 10.1039/c5cp07311a. [DOI] [PubMed] [Google Scholar]
- [28].Wang X, Kajiyama S, Iinuma H, Hosono E, Oro S, Moriguchi I, Okubo M, Yamada A. Pseudocapacitance of MXene nanosheets for high-power sodium-ion hybrid capacitors. Nat Commun. 2015;6:6544. doi: 10.1038/ncomms7544. [DOI] [PMC free article] [PubMed] [Google Scholar]
- [29].Peng Q, Guo J, Zhang Q, Xiang J, Liu B, Zhou A, Liu R, Tian Y. Unique Lead Adsorption Behavior of Activated Hydroxyl Group in Two-Dimensional Titanium Carbide. J Am Chem Soc. 2014;136:4113–4116. doi: 10.1021/ja500506k. [DOI] [PubMed] [Google Scholar]
- [30].Rasool K, Helal M, Ali A, Ren CE, Gogotsi Y, Mahmoud KA. Antibacterial Activity of Ti3C2Tx MXene. ACS Nano. 2016;10:3674–3684. doi: 10.1021/acsnano.6b00181. [DOI] [PubMed] [Google Scholar]
- [31].Mashtalir O, Cook KM, Mochalin VN, Crowe M, Barsoum MW, Gogotsi Y. Dye adsorption and decomposition on two-dimensional titanium carbide in aqueous media. J Mater Chem A. 2014;2:14334–14338. [Google Scholar]
- [32].Wang F, Yang C, Duan C, Xiao D, Tang Y, Zhu J. An Organ-Like Titanium Carbide Material (MXene) with Multilayer Structure Encapsulating Hemoglobin for a Mediator-Free Biosensor. J Electrochem Soc. 2015;162:B16–B21. [Google Scholar]
- [33].Wang F, Yang C, Duan M, Tang Y, Zhu J. TiO2 nanoparticle modified organ-like Ti3C2 MXene nanocomposite encapsulating hemoglobin for a mediator- free biosensor with excellent performances. Biosens Bioelectron. 2015;74:1022–1028. doi: 10.1016/j.bios.2015.08.004. [DOI] [PubMed] [Google Scholar]
- [34].Liu H, Duan C, Yang C, Shen W, Wang F, Zhu Z. A novel nitrite biosensor based on the direct electrochemistry of hemoglobin immobilized on MXene- Ti3C2. Sens Actuat B: Chem. 2015;218:60–66. [Google Scholar]
- [35].Rakhi R, Nayuk P, Xia C, Alshareef HN. Novel amperometric glucose biosensor based on MXene nanocomposite. Sci Rep. 2016;6:36422. doi: 10.1038/srep36422. [DOI] [PMC free article] [PubMed] [Google Scholar]
- [36].Yu X-f, Li Y-c, Cheng J-b, Liu Z-b, Li Q-z, Li W-z, Yang X, Xiao B. Monolayer Ti2CO2: A Promising Candidate for NH3 Sensor or Capturer with High Sensitivity and Selectivity. ACS Appl Mater Interf. 2015;7:13707–13713. doi: 10.1021/acsami.5b03737. [DOI] [PubMed] [Google Scholar]
- [37].Xu B, Zhu M, Zhang W, Zhen X, Pei Z, Xue Q, Zhi C, Shi P. Ultrathin MXene- Micropattern-Based Field-Effect Transistor for Probing Neural Activity. Adv Mater. 2016;28:3333–3339. doi: 10.1002/adma.201504657. [DOI] [PubMed] [Google Scholar]
- [38].Chen XM, Wu GH, Cai ZX, Oyama M, Chen X. Advances in enzyme-free electrochemical sensors for hydrogen peroxide, glucose, and uric acid. Microchim Acta. 2014;181:689–705. [Google Scholar]
- [39].Liu XH, Nan ZH, Qiu Y, Zheng LC, Lu XQ. Hydrophobic ionic liquid immoblizing cholesterol oxidase on the electrodeposited Prussian blue on glassy carbon electrode for detection of cholesterol. Electrochim Acta. 2013;90:203–209. [Google Scholar]
- [40].Turkmen E, Bas SZ, Gulce H, Yildiz S. Glucose biosensor based on immobilization of glucose oxidase in electropolymerized poly(o-phenylenediamine) film on platinum nanoparticles-polyvinylferrocenium modified electrode. Electrochim Acta. 2014;123:93–102. [Google Scholar]
- [41].Zhou YL, Yin HS, Meng XM, Xu ZN, Fu YR, Ai SY. Direct electrochemistry of sarcosine oxidase on graphene: chitosan and silver nanoparticles modified glassy carbon electrode and its biosensing for hydrogen peroxide. Electrochim Acta. 2012;71:294–301. [Google Scholar]
- [42].Tkac J, Whittaker JW, Ruzgas T. The use of single walled carbon nanotubes dispersed in a chitosan matrix for preparation of a galactose biosensor. Biosens Bioelectron. 2007;22:1820–1824. doi: 10.1016/j.bios.2006.08.014. [DOI] [PubMed] [Google Scholar]
- [43].Zhao M-Q, Ren CE, Ling Z, Lukatskaya MR, Zhang C, Van Aken KL, Barsoum MW, Gogotsi Y. Flexible MXene/Carbon Nanotube Composite Paper with High Volumetric Capacitance. Adv Mater (Weinheim, Ger.) 2015;27:339–345. doi: 10.1002/adma.201404140. [DOI] [PubMed] [Google Scholar]
- [44].Škantárová L, Orinák A, Orináková R, Jerigová M, Stupavská M, Velic D. Functional silver nanostructured surfaces applied in SERS and SIMS. Surf Interface Anal. 2013;45:1266–1272. [Google Scholar]
- [45].Naguib M, Mashtalir O, Lukatskaya MR, Dyatkin B, Zhang C, Presser V, Gogotsi Y, Barsoum MW. One-step synthesis of nanocrystalline transition metal oxides on thin sheets of disordered graphitic carbon by oxidation of MXenes. Chem Commun. 2014;50:7420–7423. doi: 10.1039/c4cc01646g. [DOI] [PubMed] [Google Scholar]
- [46].Hu T, Wang J, Zhang H, Li Z, Hu M, Wang X. Vibrational properties of Ti3C2 and Ti3C2T2 (T = O, F: OH) monosheets by first-principles calculations: a comparative study. Phys Chem Chem Phys. 2015;17:9997–10003. doi: 10.1039/c4cp05666c. [DOI] [PubMed] [Google Scholar]
- [47].Lipatov A, Alhabeb M, Lukatskaya MR, Boson A, Gogotsi Y, Sinitskii A. Effect of Synthesis on Quality, Electronic Properties and Environmental Stability of Individual Monolayer Ti3C2 MXene Flakes. Advanced Electronic Materials. 2016;2 [Google Scholar]
- [48].Miranda A, Halim J, Lorke A, Barsoum M. Rendering Ti3C2T x (MXene) monolayers visible. Materials Research Letters. 2017:1–7. [Google Scholar]
- [49].Ren CE, Zhao M, Makaryan T, Halim J, Boota M, Kota S, Anasori B, Barsoum MW, Gogotsi Y. Porous Two-Dimensional Transition Metal Carbide (MXene) Flakes for High-Performance Li-Ion Storage. ChemElectroChem. 2016;3:689–693. [Google Scholar]
- [50].Ling Z, Ren CE, Zhao M-Q, Yang J, Giammarco JM, Qiu J, Barsoum MW, Gogotsi Y. Flexible and conductive MXene films and nanocomposites with high capacitance. Proceedings of the National Academy of Sciences. 2014;111:16676–16681. doi: 10.1073/pnas.1414215111. [DOI] [PMC free article] [PubMed] [Google Scholar]
- [51].Ali A, Belaidi A, Ali S, Helal MI, Mahmoud KA. Transparent and conductive Ti3C2Tx (MXene) thin film fabrication by electrohydrodynamic atomization technique. Journal of Materials Science: Materials in Electronics. 2016;27:5440–5445. [Google Scholar]
- [52].Lukatskaya MR, Mashtalir O, Ren CE, Dall’Agnese Y, Rozier P, Taberna PL, Naguib M, Simon P, Barsoum MW, Gogotsi Y. Cation intercalation and high volumetric capacitance of two-dimensional titanium carbide. Science. 2013;341:1502–1505. doi: 10.1126/science.1241488. [DOI] [PubMed] [Google Scholar]
- [53].Huang S, Peng W, Ning C, Hu Q, Dong H. Nanostructure Transition on Anodic Titanium: Structure Control via a Competition Strategy between Electrochemical Oxidation and Chemical Etching. J Phys Chem C. 2012;116:22359–22364. [Google Scholar]
- [54].Ghassemi H, Harlow W, Mashtalir O, Beidaghi M, Lukatskaya MR, Gogotsi Y, Taheri ML. In situ environmental transmission electron microscopy study of oxidation of two-dimensional Ti3C2 and formation of carbon-supported TiO2. J Mater Chem. A 2014;2:14339–14343. [Google Scholar]
- [55].Zhou M, Zhai Y, Dong S. Electrochemical Sensing and Biosensing Platform Based on Chemically Reduced Graphene Oxide. Anal Chem. 2009;81:5603–5613. doi: 10.1021/ac900136z. [DOI] [PubMed] [Google Scholar]
- [56.Randviir EP, Banks CE. The Oxygen Reduction Reaction at Graphene Modified Electrodes. Electroanalysis. 2014;26:76–83. [Google Scholar]
- [57].Qu L, Liu Y, Baek J-B, Dai L. Nitrogen-doped graphene as efficient metal-free electrocatalyst for oxygen reduction in fuel cells. ACS Nano. 2010;4:1321–1326. doi: 10.1021/nn901850u. [DOI] [PubMed] [Google Scholar]
- [58].Zhang G, Lu WT, Cao FF, Xiao ZD, Zheng XS. N-doped graphene coupled with Co nanoparticles as an efficient electrocatalyst for oxygen reduction in alkaline media. J Power Sources. 2016;302:114–125. [Google Scholar]
- [59].Vij V, Tiwari JN, Kim KS. Covalent versus Charge Transfer Modification of Graphene/Carbon-Nanotubes with Vitamin B1: Co/N/S-C Catalyst toward Excellent Oxygen Reduction. ACS Appl Mater Interf. 2016;8:16045–16052. doi: 10.1021/acsami.6b03546. [DOI] [PubMed] [Google Scholar]
- [60].Tkac J, Ruzgas T. Dispersion of single walled carbon nanotubes. Comparison of different dispersing strategies for preparation of modified electrodes toward hydrogen peroxide detection. Electrochem Commun. 2006;8:899–903. [Google Scholar]
- [61].Yeh MH, Li YS, Chen GL, Lin LY, Li TJ, Chuang HM, Hsieh CY, Lo SC, Chiang WH, Hoa KC. Facile Synthesis of Boron-doped Graphene Nanosheets with Hierarchical Microstructure at Atmosphere Pressure for Metal-free Electrochemical Detection of Hydrogen Peroxide. Electrochim Acta. 2015;172:52–60. [Google Scholar]
- [62].Xu WN, Liu JL, Wang MJ, Chen L, Wang X, Hu CG. Direct growth of MnOOH nanorod arrays on a carbon cloth for high-performance non-enzymatic hydrogen peroxide sensing. Anal Chim Acta. 2016;913:128–136. doi: 10.1016/j.aca.2016.01.055. [DOI] [PubMed] [Google Scholar]
- [63].Pan Y, Hou ZH, Yang H, Liu YN. Hierarchical architecture of nanographene-coated rice-like manganese dioxide nanorods/graphene for enhanced electrocatalytic activity toward hydrogen peroxide reduction. Mater Sci Semicond Process. 2015;40:176–182. [Google Scholar]
- [64].Chen W, Cai S, Ren Q-Q, Wen W, Zhao Y-D. Recent advances in electrochemical sensing for hydrogen peroxide: a review. Analyst. 2012;137:49–58. doi: 10.1039/c1an15738h. [DOI] [PubMed] [Google Scholar]
- [65].Karyakin AA, Puganova EA, Budashov IA, Kurochkin IN, Karyakina EE, Levchenko VA, Matveyenko VN, Varfolomeyev SD. Prussian blue based nanoelectrode arrays for H2O2 detection. Anal Chem. 2004;76:474–478. doi: 10.1021/ac034859l. [DOI] [PubMed] [Google Scholar]
- [66].Han L, Tricard S, Fang J, Zhao J, Shen W. Prussian blue @ platinum nanoparticles/graphite felt nanocomposite electrodes: Application as hydrogen peroxide sensor. Biosens Bioelectron. 2013;43:120–124. doi: 10.1016/j.bios.2012.12.003. [DOI] [PubMed] [Google Scholar]
- [67].Xiao F, Zhao F, Zhang Y, Guo G, Zeng B. Ultrasonic Electrodeposition of Gold- Platinum Alloy Nanoparticles on Ionic Liquid-Chitosan Composite Film and Their Application in Fabricating Nonenzyme Hydrogen Peroxide Sensors. J Phys Chem C. 2009;113:849–855. [Google Scholar]
- [68].Chen L, Wang X, Zhang X, Zhang H. 3D porous and redox-active Prussian blue-in-graphene aerogels for highly efficient electrochemical detection of H2O2. J Mater Chem. 2012;22:22090–22096. [Google Scholar]
Associated Data
This section collects any data citations, data availability statements, or supplementary materials included in this article.


