

Abstract
Data-independent acquisition is a powerful mass spectrometry technique that enables comprehensive MS and MS/MS analysis of all detectable species, providing an information rich data file that can be mined deeply. Here, we describe how to acquire high-quality SWATH® Acquisition data to be used for large quantitative proteomic studies. We specifically focus on using variable sized Q1 windows for acquisition of MS/MS data for generating higher specificity quantitative data.
Keywords: Mass spectrometry, SWATH acquisition, Data-independent acquisitions, Variable windows, Quantitation, Proteomics
1 Introduction
The goal of quantitative proteomics is to both identify and quantify a broad range of peptides and proteins. The extreme complexity and dynamic range of proteins in cells, tissues, and fluids challenges traditional data-dependent workflows to reproducibly and deeply interrogate complex samples. There has been resurgence in the use of data-independent acquisition (DIA) mass spectrometry strategies to increase the reproducibility and comprehensiveness of data collection, enabled by recent technological innovations in both MS hardware and software. This acquisition strategy can now be routinely applied to proteomic samples to collect high quality quantitative data for high numbers of peptides/proteins. These data-independent acquisitions are widely performed on orthogonal time-of-flight (QqTOF or TripleTOF®) platforms, and the workflow is referred to as SWATH Acquisition [1–4]. However, DIA acquisitions can also be executed on other platforms, such as on Q-Exactive mass spectrometers [5]. In SWATH Acquisition on TripleTOF platforms, Q1 isolation windows are stepped across the mass range in an LC timescale, transmitting populations of peptides for fragmentation, and high-resolution composite MS/MS spectra are acquired at each step. Gillet et al. [2] described their initial SWATH experiments setting the Q1 quadrupole to transmit Δ25 m/z windows, with a 1 m/z overlap between windows. The MS/MS spectra generated during a SWATH acquisition are of much greater complexity than the MS/MS spectra in typical data-dependent acquisition (DDA) experiments when using unit resolution (1 m/z) Q1 windows. In addition, an MS1 scan is typically collected in each cycle, and this cycle of MS1 and SWATH MS/MS scans is repeated throughout the entire LC-MS acquisition. Fragment ion information from the obtained SWATH MS/MS spectra can be used to uniquely confirm detection of specific peptides, typically by comparisons to reference spectra or spectral libraries as described by Gillet et al. [2] and Röst et al. (Chapter 20).
The complexity of the chimeric SWATH MS/MS spectra and the resulting specificity depends on the number of peptides eluting off the column at the same retention time within the same m/z isolation window. Initial approaches used fixed sized Q1 windows of 20–25 m/z; however, more recent work has shown that decreasing the Q1 window size, as well as varying the window width as a function of precursor ion density [6] can provide higher specificity, less interferences and improvements in the amount of quantitative data extracted to ultimately increase the depth of coverage.
Data-independent SWATH acquisitions are compatible with several downstream data processing algorithms, and recently a variety of new software tools have emerged. One widely used approach is to match SWATH data against pre-assembled MS/MS spectral libraries, using tools such as OpenSWATH [7], Skyline [5, 8], SWATH 2.0 [9], and Spectronaut [10]. These tools analyze the untargeted DIA acquisition data with targeted data processing taking advantage of existing spectral libraries. Another strategy, MSPLIT-DIA (or mixture-spectrum partitioning using libraries of identified tandem mass spectra) is a spectral matching tool for untargeted peptide identification in DIA data [11]. Lastly, two recently published algorithms DIA-Umpire [12], and Group-DIA [13] apply an untargeted data analysis approach in which SWATH or DIA data is first processed by detecting precursor and fragment ion features and subsequently assembling them into pseudo-tandem MS/MS spectra, which then can be searched by any typical database search engine.
2 Materials
2.1 Samples for Analysis
Retention Time Calibration Peptides: The iRT peptides (kit P/N Ki-3003, Biognosys, Switzerland) are spiked into complex samples, typically at dilutions of 1/10 (see Note 1).
LC-MS quality control (QC) sample: Beta-Galactosidase (BGal) Stock Solution. Add 625 μL of buffer (10 % acetonitrile/0.1 % formic acid) to the BGal vial (kit P/N 4465867, SCIEX) to create a 1 pmol/μL stock solution. Aliquot the stock solution into 10–50 μL volumes and freeze at −20 °C for future use.
SWATH system suitability sample: pre-digested cell lysate similar to the study sample described under step 4 to assess SWATH performance.
Pre-digested Cell Lysate samples: a typical study sample used here consists of a tryptic digestion of a yeast cell lysate. Proteomic samples were previously reduced, alkylated, digested, and desalted, providing a solution of ~1 μg/μL digested protein lysate for analysis.
2.2 Chromatography
LC System—nanoLC™ 425 System (SCIEX) combined with a cHiPLC® System (see Note 2).
Two analytical cHiPLC columns set up in serial mode—each 75 μm × 15 cm ChromXP™ C18-CL chip, 3 μm, 300 Å (P/N 804-00001, SCIEX).
LC Buffer A: 98 % water with 0.1 % formic acid and 2 % acetonitrile;
LC Buffer B: 98 % acetonitrile with 0.1 % formic acid and 2 % water.
2.3 Mass Spectrometry
MS analysis is performed using the NanoSpray® Source on the TripleTOF® 6600 System (see Note 3) operating with Analyst® Software TF 1.7 (SCIEX).
2.4 Data Processing
3 Methods
3.1 Set Up LC-MS System
Using the nanoLC 425 LC system with a cHiPLC System (SCIEX), set up in standard ‘trap elute’ mode, to desalt first then separate the peptides from the complex tryptic digestions. Set up the autosampler (AS-3) valve with a 10 μL sample loop, and connect to the loading pump, and the cHiPLC system. Connect the analytical gradient to the cHiPLC system, which is set up with two analytical C18 chip columns in serial mode (see below and see Note 5 and 6).
Place a trap elute jumper chip (PN 800-00389, SCIEX) in slot 1 in the cHiPLC system. Place two analytical chips in slots 2 and 3 (SCIEX), (see Note 7). Set the temperature on the cHiPLC system to 35 °C for both to maintain a constant temperature (see Note 8).
Connect the eluant from the column to the nanoflow spray tip (New Objectives FS 360-20-10-N-20) mounted on the NanoSpray Ion Source (SCIEX). The source is connected to a TripleTOF 6600 system operated using Analyst Software TF 1.7 (SCIEX).
3.2 Create a Basic LC-MS Acquisition Method
Click Build Acquisition Method to start a new method. Set experiment 1 to TOF MS and set the m/z range to 400 – 1500 and the Accumulation Time to 250 msec. Next, open the Edit Parameters and set the source conditions that were optimized for the system, these should typically be in the following ranges. On the Compound tab, ensure the Declustering Potential (DP) is set to between 80 and 100 V. On the Source/Gas tab, typical conditions will be 2300–2600 V for the IonSpray Voltage (IVSF), 3–6 for the Ion Source Gas 1 (GS1), 0 for the Ion Source Gas 2 (GS2), 20–25 for the Curtain Gas (CUR), and 100–150 for the Interface Heater Temperature (IHT).
Create a trap loading method for desalting and add this to the LC-MS acquisition method; for example using a loading pump flow rate of 0.5 μL/min of 100 % Buffer A for 30 min (see Note 6).
Create a μL-pickup method for the autosampler, injecting 2 μL of sample using a 10 μL loop and add this to the LC-MS acquisition method.
Create the analytical gradient method and add this to the LC-MS method. An example gradient for a complex sample is to use a flow rate of 300 nL/min and the following gradient: 5–30 % (v/v) solvent B with solvent A making up the difference (from 0 to 120 min), 30–80 % solvent B (from 120 to 130 min), and at 80 % solvent B (from 130 to 136 min) then back to 5 % solvent B from 136 to 138 min for mobile phase equilibration, with a total run-time of 155 min (see Note 9).
Set the MS acquisition Duration to 150 min. Save the LC-MS acquisition method.
3.3 Convert to a SWATH Acquisition Method
-
Click on the Create SWATH Exp button in the top right hand side of the LC-MS acquisition method window. The Create SWATH Experiment UI appears (Fig. 1). Click on the ‘Manual’ Tab of the UI on the right to set up a custom SWATH experiment.
Prepare the SWATH Variable Window text file that defines the Q1 isolation window strategy as shown in Fig. 1a (see Note 10). Generate the Variable Window Table manually in Excel or compute from previously acquired MS data on the specific sample of interest (see Note 11). The Variable Window excel file should be set up to define the varying windows width across the entire m/z range with 3 Excel columns ‘Q1 Start m/z’, ‘Q1 Stop m/z’, and ‘collision energy spread, CES’ (see Fig. 1a). Save the document as a *.txt file. The variable window text file is imported into the LC-MS acquisition method (described below in step 2 of Subheading 3.3), to build the Variable Window SWATH Acquisition Method in the Analyst software.
From the Manual tab of the Create SWATH Experiment UI (see Fig. 1b) check the Read SWATH Windows from Text File option at the very bottom of the UI and load the SWATH Variable Window text file using the Browse button. Note that the SWATH Analysis Parameters Section (top of window) is grayed out and not used once the Read SWATH Windows from Text File option is selected.
Next, under the Fragmentation Conditions Section click on the Rolling Collision Energy option and set the charge state to 2+ (Fig. 1b). The collision energy (CE) equations are defined in an Analyst TF 1.7 Script called ‘IDA CE Parameters’. Software defaults can be used or SWATH optimized CE equations can be downloaded (http://sciex.com/community/entity/11856).
Finally, set the SWATH Detection Parameters section to the following values, MS/MS scans acquired from m/z 100–1500 with 25 msec accumulation times in high MS/MS sensitivity mode, as shown in Fig. 1b (see Note 10). Note the overall cycle time will not be computed until after you click OK.
Click OK at the bottom to build the LC-MS acquisition method (Fig. 1c). The method shows the TOF MS scan (experiment 1), followed by all 100 Product Ion scans (variable Q1 window MS/MS scans—experiments 2–101).
After method building, click on the TOF MS experiment (Exp 1) defining the TOF MS1 scan, and confirm that the mass range is set to m/z 400–1500 and that the accumulation time is 250 msec. This ensures the MS1 scan is also of high quality for future use [14].
The total cycle time in this case is 2.8 s which allows enough measured points across an eluting peak with the given chromatographic setup (see Note 12). This completes the building of the Variable Window SWATH Acquisition method. For information on creating a fixed window acquisition method (see Note 13).
Fig. 1.

Build a Variable Window SWATH Method. Any window strategy can be constructed in text file format and loaded into the SWATH Acquisition method editor for automatic method building. (a) A text file describing the Q1 isolation window strategy can be constructed. (b) Load into SWATH Acquisition method editor and adjust the MS and MS/MS settings as shown. (c) Click OK to automatically build a SWATH Acquisition method
3.4 Creating a Practical SWATH Study Acquisition Batch
In order to obtain consistent and reliable data from study samples, regular LC-MS tests need to be performed before and during the entire SWATH study. Initially, use the pre-digested BGal standard (see Note 5) and perform QC acquisitions, or mass calibration acquisitions, that are typically used in your laboratory.
In addition to the simple LC-MS system QC checks discussed above, also use complex standard samples similar to the study samples and test the generated SWATH acquisition method and performance of the system in SWATH mode. Perform before starting the study and also intersperse such SWATH specific tests throughout the entire SWATH study. In addition, retention time calibration (iRT) peptides spiked into the SWATH test samples and the study samples by themselves can be used to monitor retention time stability (see Note 14).
Randomize study samples to avoid systematic errors in the study, block-randomization of biologically different samples often is applied in proteomics studies.
Acquire data for the study samples with the acquisition methods generated above, injecting 2 μL of samples at concentrations of ~0.5–1.5 μg/μL yielding an amount of ~1–3 μg of sample on column.
3.5 Data Processing
Once the SWATH data is acquired, several data processing pipelines can be used to process the data (see Note 4). As an example, a SWATH data set was acquired using the above methods and a number of different Q1 window strategies, then processed using a spectral library approach as previously described for the SWATH 2.0 algorithm by Lambert et al. [9], also referred to as targeted extraction. Figure 2 highlights that higher numbers of peptides are robustly identified and quantified when more, smaller (variable) Q1 windows are used for SWATH acquisitions [6].
Fig. 2.
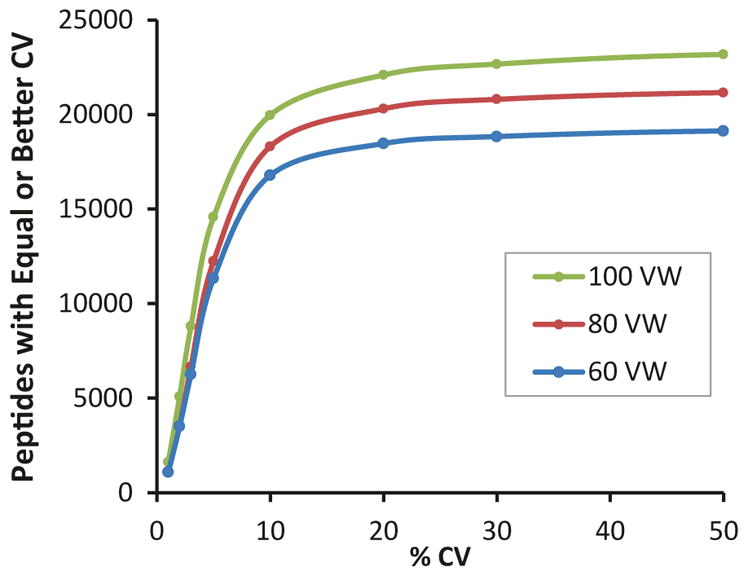
Increasing Window Numbers/Decreasing Window Size Provides More Robust Peptide Detection. Using a yeast cell lysate (3 μg on column), SWATH data was collected (five replicates) in serial column mode (2 h gradient) using variable Q1 windows. The number of windows used to cover the mass range was increased from 60 to 100 windows and the reproducibility curves were plotted. The number of confident peptide detections (<1 % FDR) with ≤20 % CV further increased as the window size decreases [6]
Fig. 3.
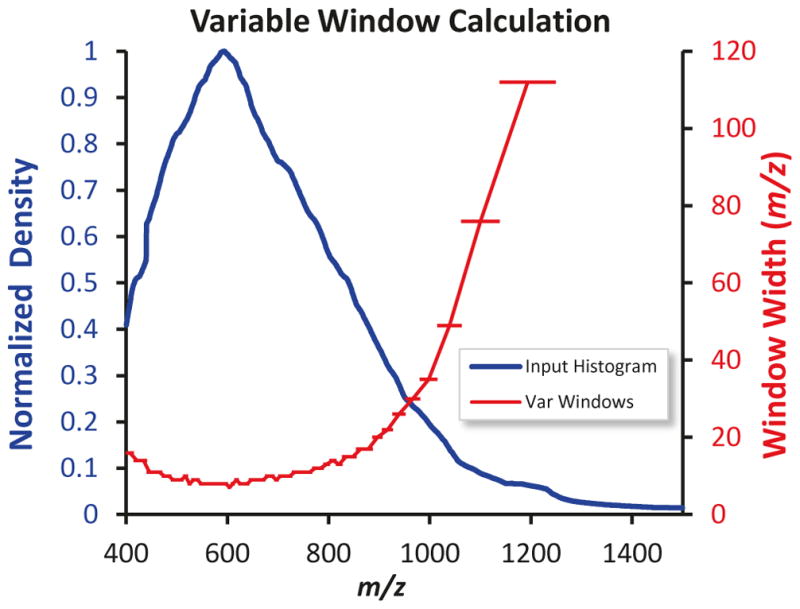
Variable Q1 Window Widths for SWATH Acquisition. To achieve better specificity in complex matrices, smaller Q1 windows are desirable especially in the m/z dense regions where many peptide precursors are measured. The m/z density histograms constructed from the TOF MS data for the proteome of interest (blue line) can be used to construct variable sized windows (red line), where the density of precursors in each of the isolation windows is equalized across the m/z range
Acknowledgments
We acknowledge support from the NIH shared instrumentation grant for the TripleTOF 6600 system at the Buck Institute (1S10 OD016281, B.W.G.).
Footnotes
iRT peptides can also be spiked at 1:20 dilution instead, depending on study sample and preference.
Different nano-flow LC systems can be used, such as NanoLC Ultra® 2Dplus (or 1D) HPLC system (Eksigent), or nano-flow LC systems from other vendors.
Method setup and acquisitions can similarly be performed on a TripleTOF 5600 or 5600+ system. All steps described will equally apply, as all of the TripleTOF systems use the same acquisition software, Analyst TF Software 1.7.
Other SWATH data processing software can be used as discussed in the introduction, i.e., OpenSWATH, Skyline, Spectronaut, DIA Umpire, and others. Please refer to the Chapter by Röst et al. in this book for a detailed description of data processing.
All instructions for operating the LC System and building pump and autosampler methods can be found in the Operators Guide (http://sciex.com/Documents/user%20guides/ekspert-nanolc-400-systems-operator-guide-eng.pdf). All protocols for performing the BetaGalactosidase tests can be found in the System Integration Test (http://sciex.com/Documents/user%20guides/nanolc-system-integration-test-en.pdf).
Here, the cHiPLC system setup consists of two analytical column chips in serial mode; in principle this is a “trap–elute” experiment, which uses the first analytical column chip for trapping and desalting of the sample with the Loading solvent, while then upon valve switching the analytical gradient will flow through both analytical column chips (in serial mode) to separate and elute the sample, providing a 30 cm column length. Due to two analytical column chips in serial mode, loading solvent flow rates should be relatively low (~0.5 μL/min) to keep column pressures reasonable (see step 2 of Subheading 3.2). Alternatively, operators can use a more traditional trap elute set up using a trap chip (with 200 μm×6 mm ChromXP™ C18-CL chip, 3 μm, 300 Å, P/N 5015841, SCIEX) instead of the first analytical column chip (see Note 5).
The chromatographic configuration described here is one example of a possible configuration. It is possible to use different “trap and elute” configurations and fused silica packed columns for separations. There are different column length options that can be used, to provide increased peak capacity and potentially increased depth of coverage. Several chromatographic setups are possible and feasible; however, it is essential to perform high quality chromatography to obtain the best separation and best peak shape for SWATH quantitation.
Retention time reproducibility is a key consideration when collecting SWATH Acquisition data. It is recommended that column heaters are used to thermostat the analytical column and ideally both the analytical column and trap for highest reproducibility.
Sufficient column re-equilibration is important for high retention time reproducibility. Ensure that the column is fully re-equilibrated in the starting conditions of the gradient before injecting the next sample.
There are a number of key parameters to consider when deciding on the best variable window strategy to use. First, it is important to determine the average chromatographic peak width, as this will define the cycle time. A typical cycle time estimate would be to take the chromatographic peak width at half height and divide by 6–8 to get an appropriate cycle time and to provide sufficient chromatographic peak sampling for good quantitation (i.e., for a peak width of 15 s at half height therefore a good cycle time would be between 1.8 and 2.5 s). Once the cycle time is determined, the number of windows can be maximized. Accumulation times as fast as 25–30 ms per MS/MS have been shown to produce good quality quantitative data on the TripleTOF systems, so divide the cycle time by 25 ms to get the number of windows (i.e., a cycle time of 2.5 s would allow for 100 SWATH Q1 windows).
To easily set up variable windows, the ‘variable window calculator’ at http://sciex.com/software-downloads-x2110 (SCIEX) or the swathTUNER tool [15] (http://swathtuner.sourceforge.net) can be used to create the variable window text file for loading into Analyst Software. In general, the instrument operator has great flexibility in designing the variable window text file, and can tailor SWATH window sizes either specifically for the type and complexity of the sample measured in the study (Fig. 3), or just using a once established generally applicable window pattern. Within a quantitative study, use the same variable window pattern for all samples. An example of a 100 Q1 variable window text file can be found here (http://sciex.com/community/entity/1217).
The number of variable windows, accumulation times, and total cycle times can be further optimized by the individual operator to allow for the optimal number of points across the eluting sample peak to allow >10 points across each peak for optimal quantitation. This is very dependent on the chromatography and length of gradient, which can also be optimized for the specific sample type.
To build a fixed SWATH acquisition method instead of the variable SWATH window method described above, go to the SWATH Experiment UI and select the ‘Manual’ tab (see Fig. 1b). First set the SWATH Analysis Parameters on the top: set the Start Mass to 400, the Stop Mass to 1250, and the SWATH Width to desired width (typically use 10 m/z), the # of SWATH MS/MS scans per cycle is then automatically computed to 85 windows. As no text file is imported (as for variable windows), and the box Read SWATH Windows from text file is unchecked, the UI can directly calculate SWATH windows under the SWATH Analysis Parameters. Set the Fragmentation Conditions as defined in step 3 of Subheading 3.3 and set the SWATH Detection Parameters as defined in step 4 of Subheading 3.3. The cycle time for the MS/MS portion is computed to be 2.2 s. Click OK. Confirm the TOF MS settings as defined in step 6 of Subheading 3.3.
Spiked synthetic peptides can also be used to adjust for slight retention time drifts during data processing, and to perform retention time alignments using libraries from other researchers and other LC-MS systems. Endogenous peptides already present in the sample can also be used to perform retention time alignment between library and sample.
References
- 1.Collins BC, Gillet LC, Rosenberger G, et al. Quantifying protein interaction dynamics by SWATH mass spectrometry: application to the 14-3-3 system. Nat Methods. 2013;10:1246–1253. doi: 10.1038/nmeth.2703. [DOI] [PubMed] [Google Scholar]
- 2.Gillet LC, Navarro P, Tate S, et al. Targeted data extraction of the MS/MS spectra generated by data-independent acquisition: a new concept for consistent and accurate proteome analysis. Mol Cell Proteomics. 2012;11(O111):016717. doi: 10.1074/mcp.O111.016717. [DOI] [PMC free article] [PubMed] [Google Scholar]
- 3.Liu Y, Buil A, Collins BC, et al. Quantitative variability of 342 plasma proteins in a human twin population. Mol Syst Biol. 2015;11:786. doi: 10.15252/msb.20145728. [DOI] [PMC free article] [PubMed] [Google Scholar]
- 4.Selevsek N, Chang CY, Gillet LC, et al. Reproducible and consistent quantification of the Saccharomyces cerevisiae proteome by SWATH-mass spectrometry. Mol Cell Proteomics. 2015;14:739–749. doi: 10.1074/mcp.M113.035550. [DOI] [PMC free article] [PubMed] [Google Scholar]
- 5.Egertson JD, MacLean B, Johnson R, et al. Multiplexed peptide analysis using data-independent acquisition and Skyline. Nat Protoc. 2015;10:887–903. doi: 10.1038/nprot.2015.055. [DOI] [PMC free article] [PubMed] [Google Scholar]
- 6.Hunter CL, Collins B, Gillet L, et al. Increasing depth of coverage in data independent acquisition with acquisition improvements and higher sample loads. Proccedings of the 61st Annual ASMS Conference on Mass Spectrometry & Allied Topics; Baltimore, MD. June 15–19, 2014.2014. [Google Scholar]
- 7.Rost HL, Rosenberger G, Navarro P, et al. OpenSWATH enables automated, targeted analysis of data-independent acquisition MS data. Nat Biotechnol. 2014;32:219–223. doi: 10.1038/nbt.2841. [DOI] [PubMed] [Google Scholar]
- 8.MacLean B, Tomazela DM, Shulman N, et al. Skyline: an open source document editor for creating and analyzing targeted proteomics experiments. Bioinformatics. 2010;26:966–968. doi: 10.1093/bioinformatics/btq054. [DOI] [PMC free article] [PubMed] [Google Scholar]
- 9.Lambert JP, Ivosev G, Couzens AL, et al. Mapping differential interactomes by affinity purification coupled with data-independent mass spectrometry acquisition. Nat Methods. 2013;10:1239–1245. doi: 10.1038/nmeth.2702. [DOI] [PMC free article] [PubMed] [Google Scholar]
- 10.Bruderer R, Bernhardt OM, Gandhi T, et al. Extending the limits of quantitative proteome profiling with data-independent acquisition and application to acetaminophen-treated three-dimensional liver microtissues. Mol Cell Proteomics. 2015;14:1400–1410. doi: 10.1074/mcp.M114.044305. [DOI] [PMC free article] [PubMed] [Google Scholar]
- 11.Wang J, Tucholska M, Knight JD, et al. MSPLIT-DIA: sensitive peptide identification for data-independent acquisition. Nat Methods. 2015;12(12):1106–1108. doi: 10.1038/nmeth.3655. Online. [DOI] [PMC free article] [PubMed] [Google Scholar]
- 12.Tsou CC, Avtonomov D, Larsen B, et al. DIA-Umpire: comprehensive computational framework for data-independent acquisition proteomics. Nat Methods. 2015;12:258–264. 7–264. doi: 10.1038/nmeth.3255. [DOI] [PMC free article] [PubMed] [Google Scholar]
- 13.Li Y, Zhong CQ, Xu X, et al. Group-DIA: analyzing multiple data-independent acquisition mass spectrometry data files. Nat Methods. 2015;12(12):1105–1106. doi: 10.1038/nmeth.3593. Online. [DOI] [PubMed] [Google Scholar]
- 14.Rardin MJ, Schilling B, Cheng LY, et al. MS1 peptide ion intensity chromatograms in MS2 (SWATH) data independent acquisitions. improving post acquisition analysis of proteomic experiments. Mol Cell Proteomics. 2015;14:2405–2419. doi: 10.1074/mcp.O115.048181. [DOI] [PMC free article] [PubMed] [Google Scholar]
- 15.Zhang Y, Bilbao A, Bruderer T, et al. The use of variable Q1 isolation windows improves selectivity in LC-SWATH-MS acquisition. J Proteome Res. 2015;14:4359–4371. doi: 10.1021/acs.jproteome.5b00543. [DOI] [PubMed] [Google Scholar]