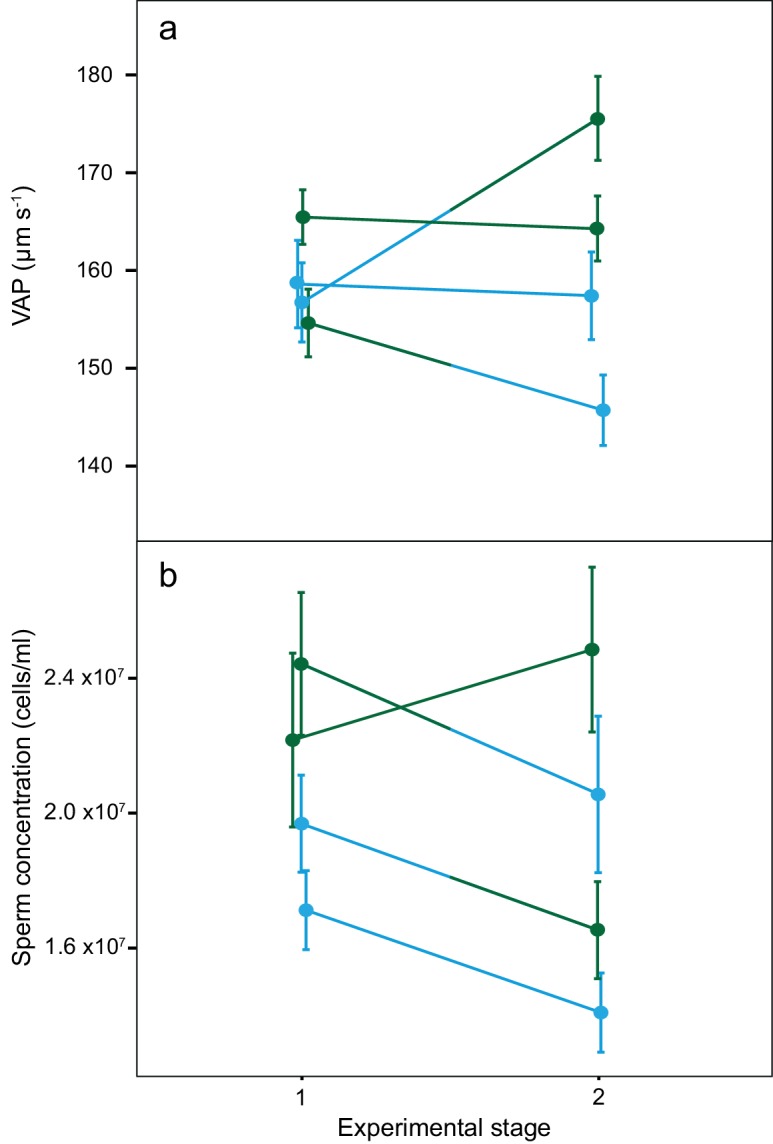
Figure 4. Average sperm velocity (VAP, µm s−1;±s.e.m.) and average sperm concentration (cells/ml;±s.e.m.) in males of the four social phenotypes after each stage of a social status manipulation experiment in chinook salmon.

Blue colour denotes males dominant in both stages (DD, n = 10), green colour denotes males subdominant in both stages (SS, n = 9), a change from blue to green colour denotes males that changed from dominant to subdominant status (DS, n = 10) and a change from green to blue colour denotes males that changed from subdominant to dominant status (SD n = 9). The change in VAP for DS males was statistically significant.
