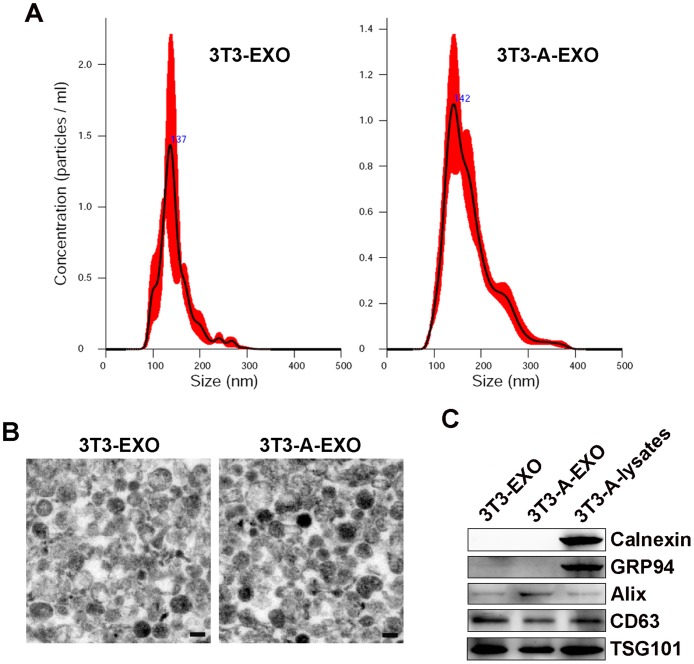
Figure 1. Characterization of 3T3-EXO and 3T3-A-EXO.
(A) Assessment of size distribution of 3T3-EXO and 3T3-A-EXO by nanoparticle tracking analysis technology. (B) Morphology of 3T3-EXO and 3T3-A-EXO under electron microscopy. Scale bar = 100 nm. (C) Western blot detection of Calnexin, GRP94, Alix, CD63 and TSG101 in 3T3-EXO and 3T3-A-EXO. The data are representative of three independent experiments.

