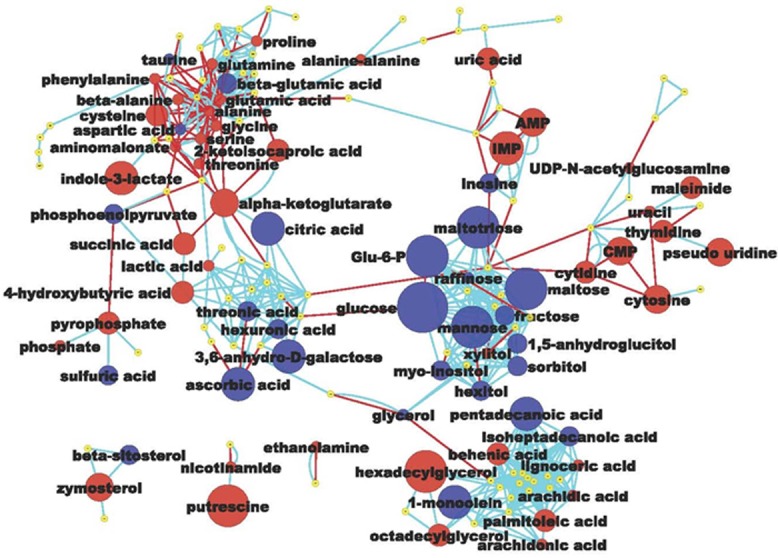
Figure 1. Metabolomic network of biochemical differences between hyperplastic Zn-deficient and Zn-sufficient esophagus.

Each node represents an identified metabolite. Metabolites are connected based on biochemical relationships (red, KEGG RPAIRS) or structural similarity (light blue, Tanimoto coefficient ≥ 0.7). Metabolite size reflects fold-change (ZD vs ZS); node color represents relative change (Blue, decrease, P < 0.05; Red, increase, P < 0.05; yellow, insignificant change) metabolite size reflects absolute fold change (Table 1). Labels are shown for the metabolites that pass the significance cutoff (P < 0.05)
