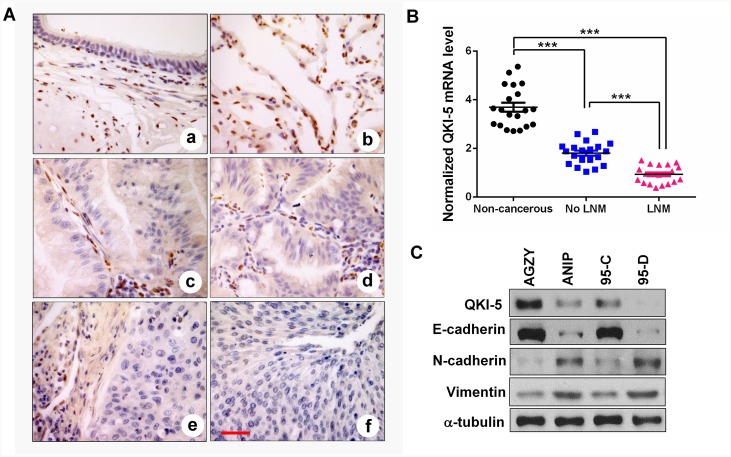
Figure 1. QKI-5 downexpression in human LC tissues and cell lines with metastasis is accompanied by EMT.
(A) IHC representative images of QKI-5 expression in bronchial epithelial (a), alveolar epithelium (b), lung adenocarcinoma (c, d) and lung squamous cancer (e, f). Scale bar, 50 μm. (B) Comparisons among groups of QKI-5 mRNA level in 20 non-cancerous lung tissues, 20 LC tissues without (No LNM) and 20 LC tissues with (LNM) lymph node metastasis. The QKI-5 mRNA level was analyzed by qRT-PCR and normalized against GAPDH. The ratio of QKI-5/GAPDH in LNM group was arbitrarily set to 1.0. The data are presented as the mean ± SD. ***P<0.001. (C) Western blotting analyses of QKI-5 and EMT markers (E-cadherin, N-cadherin, Vimentin) in two pairs of differential metastatic LC cell lines (AGZY vs ANIP, 95C vs 95D). α-tubulin was used as the loading control.

