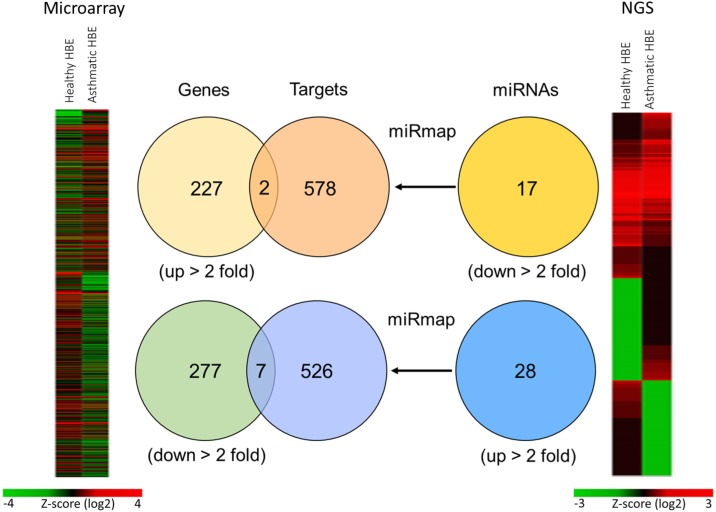
Figure 1. Representative diagrams of identification of potential microRNA-mRNA interactions in asthmatic bronchial epithelial cells.
GE microarray heatmap (left) analysis showed differentially expressed genes (total 504 genes) with fold change > 2. The “Genes” Venn diagram showed that 227 genes were upregulated and 277 genes were downregulated in asthmatic bronchial epithelial cells compared to normal bronchial epithelial cells. Next generation sequencing (NGS) heatmap (right) analysis showed differentially expressed microRNAs (total 402 microRNAs) with fold change > 2. The “miRNAs” Venn diagram showed selected microRNAs by threshold of reads per million (RPM) > 1, with 17 microRNAs were downregulated and 28 microRNAs were upregulated in asthmatic bronchial epithelial cells compared to normal human bronchial epithelial cells. The “Targets” Venn diagram showed the predicted genes of microRNAs from “miRNAs” Venn diagram by using miRmap web-based database. The selection threshold was miRmap score ≥ 99.0. The intersection Venn diagram between “Genes” and “Targets” revealed 9 potential microRNA-mRNA interactions.

