Abstract
In this study, we investigate the brain networks during positive and negative emotions for different types of stimulus (audio only, video only and audio + video) in , and bands in terms of phase locking value, a nonlinear method to study functional connectivity. Results show notable hemispheric lateralization as phase synchronization values between channels are significant and high in right hemisphere for all emotions. Left frontal electrodes are also found to have control over emotion in terms of functional connectivity. Besides significant inter-hemisphere phase locking values are observed between left and right frontal regions, specifically between left anterior frontal and right mid-frontal, inferior-frontal and anterior frontal regions; and also between left and right mid frontal regions. ANOVA analysis for stimulus types show that stimulus types are not separable for emotions having high valence. PLV values are significantly different only for negative emotions or neutral emotions between audio only/video only and audio only/audio + video stimuli. Finding no significant difference between video only and audio + video stimuli is interesting and might be interpreted as that video content is the most effective part of a stimulus.
Keywords: EEG, Functional connectivity, Phase-locking value, Valence, Stimulus
Introduction
Physiological signals based emotional processing has recently drawn significant interest. Relations between emotional states and brain activities have been discovered employing EEG or fMRI imaging modalities. Among those, EEG modality has gained more attention (Güntekin and Başar 2014) in investigating brain dynamics during affective tasks, although there are recent studies using fMRI (Hattingh et al. 2013; Hooker et al. 2012; Lichev et al. 2015). Previous studies show that, emotional stimulus reveals responses in early time windows (Holmes et al. 2003; Palermo and Rhodes 2007; Pizzagalli et al. 1999). EEG and MEG with excellent temporal resolution are more prone to capture the brain dynamics than fMRI which fails to detect early responses. There are studies, also showing the response time differences between stimulus types used for emotion elicitation (Baumgartner et al. 2006; Chen et al. 2010; Zion-Golumbic et al. 2010). However, the effect of stimuli types on brain dynamics are yet to be discovered.
There are a vast number of studies on animals and humans providing evidence that sensorimotor, visual and cognitive tasks require the integration of numerous functional areas widely distributed over the brain. Studies at the level of EEG-based functional connectivity in the context of emotion recognition have gained a momentum (Kassam et al. 2013; Lee and Hsieh 2014; Lindquist et al. 2012; Shahabi and Moghimi 2016). EEG-based functional connectivity is used to investigate the brain areas involved in a particular task. Functional connectivity is studied by considering the similarities between the time series or activation maps. Various methods including linear coherence estimation in the frequency domain to investigate frequency locking (Bressler 1995; Brovelli et al. 2004; Ding et al. 2000; Nunez et al. 1997) and nonlinear methods to investigate synchronization are employed to explore the dependencies between time series. Nonlinear methods mostly focus on generalized synchronization (Stam and Dijk 2002) or phase synchronization (Lachaux et al. 1999; Mormann et al. 2000; Tass et al. 1998).
Various functional connectivity indices have been used to show the existence of diverse functional brain connectivity patterns for different emotional states for normal (Khosrowabadi et al. 2010; Lee and Hsieh 2014; Ma et al. 2012) and abnormal (Li et al. 2015; Quraan et al. 2014) cases. Emotional paradigms are used in research of evoked/event-related oscillations in analysis of functional brain connections (Güntekin and Başar 2014; Symons et al. 2016). In Lee and Hsieh (2014), emotional states are classified by means of EEG-based functional connectivity patterns. 40 participants viewed audio-visual film clips to evoke neutral, positive (one amusing and one surprising) or negative (one fear and one disgust) emotions. Correlation, coherence, and phase synchronization are used for estimating the connectivity indices. They stated significant differences among emotional states. A maximum classification rate of 82% was reported when phase synchronization index was used for connectivity measure. In Ma et al. (2012), EEG activities from 27 subjects while performing a spatial search task for facial expressions (visual stimuli) were recorded to explore the network organization of the EEG gamma oscillation during emotion processing. They reported that negative emotion processing showed more effective and optimal network organization than positive. Emotional states are also investigated in valence/arousal dimensions by visual stimuli as film clips (Liu et al. 2017).
In this study, interactions between brain regions are investigated through phase locking value for positive and negative emotions as it is demonstrated that this metric is successful in inferring the functional connectivity between brain regions using EEG signals (Dimitriadis et al. 2015; Hassan et al. 2015; Hassan and Wendling 2015; Kang et al. 2015; Sakkalis 2011; Sun et al. 2012). For this purpose, we constructed a multimodal emotional database from 25 voluntary subjects using 15 stimuli. Another major goal of the study is to explore the effects of stimuli type on interacting regions. Therefore, each stimulus was presented in audio only, video only and audio + video formats. There are numerous studies on oscillatory responses in perception of faces (see Güntekin and Başar 2014; Symons et al. 2016 and references therein). In Güntekin and Basar (2007) differences in alpha and beta bands between angry and happy face perception are reported when stimuli with high mood involvement are selected. Baumgartner et al. (2006) used EEG-Alpha-Power-Density to analyze emotion perception using face only stimulus and listening to fearful, happy and sad music and listening to emotional music while viewing pictures of the same emotional categories. Their results suggest that combined stimuli reveals the strongest activation and therefore emotion perception is enhanced when emotional music accompanies the affective pictures. An MEG study showed enhanced functional coupling in the alpha frequency range in sensorimotor areas during facial affect processing (Popov et al. 2013). Although functional role of beta-band oscillations in cognitive processing is not well understood, there are recent studies suggesting the involvement of beta-band oscillations in controlling the current sensorimotor or cognitive state (Engel and Fries 2010). Beta power change was reported over frontal and central regions for affective face stimuli (Güntekin and Basar 2007). MEG study comparing the evoked beta band activity between static and dynamic facial expressions revealed greater response for dynamic expressions (Jabbi et al. 2014).
Numerous studies on emotion perception observed the effect of gamma band activity (Balconi and Lucchiari 2008; Keil et al. 2001; Luo et al. 2007, 2009; Müsch et al. 2014; Sato et al. 2011). Sato et al. (2011) and Keil et al. (2001) reported higher gamma band activity in response to emotional pictures than neutral face pictures. In Luo et al. (2009), it was observed that, emotional stimuli induced increased event related synchronization in amygdala, visual, prefrontal, parietal, and posterior cingulate cortices relative to neutral. Besides, right hemisphere was announced to be effective in discriminating emotional faces from neutral faces.
This paper is organized as follows: EEG data acquisition is given in “Data acquisition” section. “Functional connectivity” section explains the phase locking value as the functional connectivity method. Results and conclusion are given in “Results” section and “Discussion” section respectively.
Data acquisition
A multimodal emotional database, which includes EEG recordings and face videos, is collected for the study. Two equipments were used for data acquisition; a wireless brain signal monitoring system, Emotiv EPOC (Emotiv Systems Inc., San Francisco, USA) wireless EEG headset with 14 channels, and a smart phone with HD 30 fps resolution for capturing the facial images. Database is collected from 25 voluntary subjects using 15 stimuli, which are 60 s long clips extracted from movies, in native and foreign languages. Note that, dubbed versions of foreign movies are used. Extracted movie segments are used in audio, video and audio + video format. Consequently, 45 stimuli were used in total.
Stimuli selection
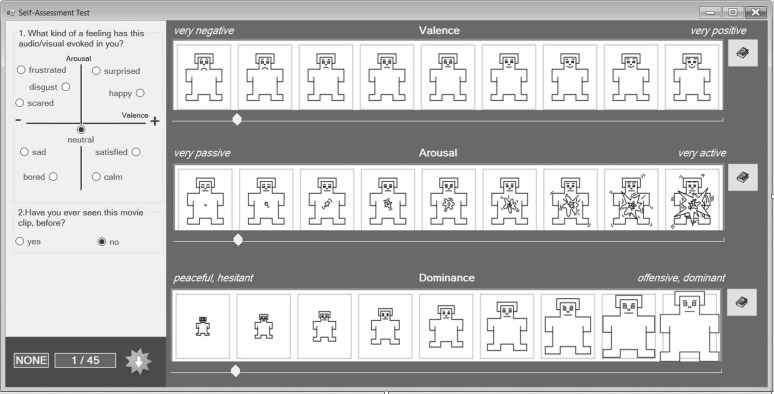
Several steps were followed for stimuli selection. First, 130 emotionally-evocative movie clips were manually selected from 59 movies (9 in foreign and 50 in native language) considering youtube evaluations. Numbers of movie clips in different affective states and their distributions over regions on Valence-Arousal dimension are given in Table 1. We paid attention in selection of movie clips to have a balanced number of emotions in different regions. 11 evaluators, (8 male, 3 female, average age: 20) who did not participate to data collection experiments, watched the movie clips, in audio + video format, and evaluated the clips via the Self-Assessment Form (Fig. 1) using Self-Assessment Manikins (SAM) (Bradley and Lang 1994).
Table 1.
Numbers of emotionally-evocative movie clips selected manually from 59 movies for evaluations
| Region | Emotions | Numbers |
|---|---|---|
| Region I | Happy, surprised | 39 (35, 4) |
| Region II | Disgust, frustrated, scared | 39 (9, 19, 11) |
| Region III | Bored, sad | 26 (4, 22) |
| Region IV | Satisfied, calm | 20 (12, 8) |
| Origin | Neutral | 6 |
Fig. 1.
Self assessment form (SAM self assessment manikin)
Emotion evoked by the clip and if the evaluator has seen the movie clip before the assessment were filled in the Self-Assessment Form. Besides, evaluators have chosen intervals for each emotion dimension. Numbers of evoked emotions after evaluations are given in Table 2.
Table 2.
Numbers of evoked emotions after evaluations
| Region | Emotions | Number of clips |
|---|---|---|
| Region I | Happy | 248 |
| Surprised | 50 | |
| Region II | Disgust | 69 |
| Frustrated | 29 | |
| Scared | 126 | |
| Region III | Bored | 101 |
| Sad | 225 | |
| Region IV | Satisfied | 199 |
| Calm | 123 | |
| Origin | Neutral | 260 |
| Total | 1430 |
Movie clips to be used in data collection were selected according to these evaluations such that they are distributed equally to 4 regions in 2-dimensional Valence/Arousal space.
Distance of the emotional content of the movie clip, , named as emotional highlight in Koelstra et al. (2012), to the origin is calculated as in Eq. 1:
| 1 |
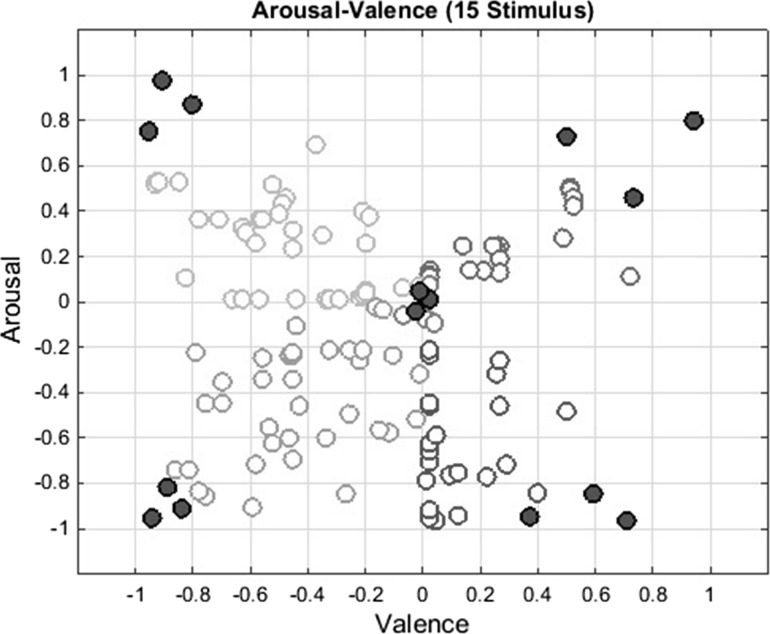
where is the ith movie clip’s arousal value and is the ith movie clip’s valence value. Note that, small values of show the proximity to the neutral emotion. Distribution of 130 points are shown in Fig. 2 and average values and standard deviations of the points for each region are shown in Table 3. In this study, 15 movie clips having highest and lowest values of (shown in red in Fig. 2) are selected for the experiments since they would represent dense emotions and neutral emotions better, respectively.
Fig. 2.
15 movie clips that have lowest and highest emotion scores
Table 3.
Valence-arousal values for selected movie clips
| Regions | Stat. | Valence | Arousal | |
|---|---|---|---|---|
| Origin | Average | 0.22 | −0.09 | 0.39 |
| Std | 0.23 | 0.25 | 0.10 | |
| Region I | Average | 1.99 | 1.89 | 2.76 |
| Std | 0.26 | 0.39 | 0.43 | |
| Region II | Average | −1.12 | 1.37 | 1.85 |
| Std | 0.47 | 0.51 | 0.39 | |
| Region III | Average | −0.79 | −1.50 | 1.84 |
| Std | 0.62 | 0.49 | 0.18 | |
| Region IV | Average | 0.57 | −0.88 | 1.25 |
| Std | 0.53 | 0.58 | 0.28 |
Participants and experiment protocol
Twenty five right-handed participants (20 male and 5 female), aged between 18 and 27 years (average age 20.52±1.69), volunteered for the experiments. The experimental procedure and processes were approved by the Mustafa Kemal University Human Research Ethics Committee. Participants were informed about the approval and signed a consent form. They were also informed about the experiment protocol and meanings of Valence/Arousal/Dominance used in self assessment form and were warned about getting a good sleep, not to get any stimulants and not to be hungry during the experiment, a day before the experiment. On the experiment day, they filled out a questionnaire on a dedicated computer about personal information; such as use of medication, number of sleep hours, tea and coffee consumption habits, date of birth, city they were born in, city they currently live in etc., prior to the experiment.
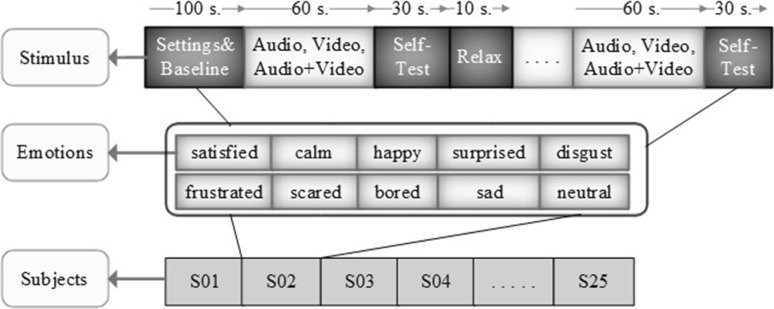
The experiment starts with 90 s of adjustments and 10 s of baseline recordings and then the participant is left alone in the experiment room. During the experiment, 15 movie clips are shown in audio, video and audio + video formats (a total of 45 stimuli) in a random order. Each stimulus is shown for 60 s, followed by a self assessment form (Fig. 1) filled in for 30 s and then a black screen was shown for 10 s for relaxation. The experiment protocol is shown in Fig. 3.
Fig. 3.
Experimental protocol. Order of stimulus, expected emotions, and number of subjects (S subjects)
EEG data collection
Emotiv EPOC is a light-weight and low cost wireless neuroheadset with a large user community. The device has been used in a variety of research studies recently (Some of the latest studies are McMahan et al. 2015; Rodríguez et al. 2015; Tripathy and Raheja 2015; Yu et al. 2015). There are studies which validate the experimental results obtained employing Emotiv EPOC (Badcock et al. 2013; Bobrov et al. 2011). Emotiv EPOC is a wireless headset system for EEG signal acquisition with 14 saline sensors; AF3, AF4, F3, F4, F7, F8, FC5, FC6, P7, P8, T7,T8, O1, O2 and two additional sensors that serve as CMS (Common Mode Sense)/DRL (Driven Right Leg) reference channels (one for the left and the other for the right hemisphere of the head). The electrodes are located at the positions according to the International 10–20 system forming 7 sets of symmetric channels. Electrode positions are shown in Fig. 4.
Fig. 4.
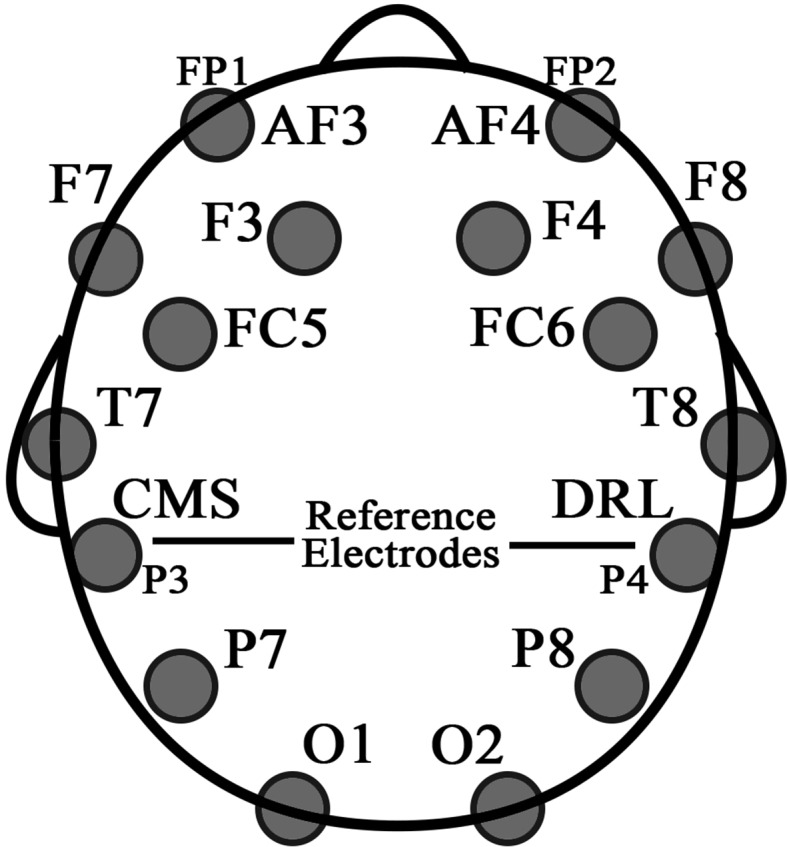
Electrode positions, according to the 10–20 systems, of the Emotiv EPOC device
The neuroheadset internally samples at a rate of 2048 Hz, and downsamples to 128 Hz per channel. Emotive EPOC was forced to start at the same time by means of a synchronization software written in Visual C# to start both modules together. After the data collection step, all collected data were transferred to Matlab for further processing, as described in the next sections.
Pre-processing
Artifact removal
EEGLAB (Delorme and Makeig 2004), an interactive MATLAB toolbox for electrophysiological signal processing, was used for preprocessing. Raw EEG data were first band-pass filtered to have only 0.16–45 Hz frequency content through EEGLAB.
EEG recordings are time series of measured potential differences between two scalp electrodes (active and reference electrodes). The recorded EEG data might be affected by artifacts (eye blinks, eye movements, scalp or heart muscle activity, line or other environmental noise). Independent Component Analysis (ICA) can be used to remove some of these artifacts (mainly ECG or EOG artifacts) from EEG data.
In this study, MARA (Multiple Artifact Rejection Algorithm) (Winkler et al. 2011), an open-source EEGLAB plug-in, is used for automatic artifact rejection using ICA. MARA is a supervised machine learning algorithm which solves a binary classification problem: “accept vs. reject” the independent component. It uses Current Density Norm and Range Within Pattern (these two features extract information form the scalp map of an IC), Fit Error, , and 8–13 Hz (these three features are extracted from the spectrum), and Mean Local Skewness (this feature detects outliers in the time series) as the feature set. After applying MARA, AAR (Automatic Artifact Removal) toolbox (Gomez-Herrero 2007) was used for automatic correction of ocular and muscular artifacts in the EEG data.
Baseline correction
Poor contact of the electrodes, perspiration or muscle tension of the subject during the experiments might cause artifacts on recordings. In order to remove this type of noise from the EEG data, it is common to have a baseline interval, which is the recordings several tens or hundreds of milliseconds preceding the stimulus during which the subject is asked to stay still and therefore the brain is assumed to have no stimulus related activity. Mean signal over this interval is subtracted from the signal recorded during the stimulus at all time points for each channel individually. This procedure is known as baseline correction. In this study 10 s baseline intervals preceding each 60 s stimulus recordings are used for baseline correction.
Functional connectivity
Most of the actions we do require the integration of numerous functional areas widely distributed over the brain. Underlying mechanism behind this large scale network is generally described by the term functional connectivity. Functional connectivity is studied by considering the similarities between the time series or activation maps obtained using a functional imaging modality. Their excellent temporal resolutions make EEG and MEG excellent candidates for exploring this facet of neuronal activity. Similarities can be quantified using linear methods such as cross-correlation and coherence (Brovelli et al. 2004; Salenius and Hari 2003; Steyn-Ross et al. 2012; Tucker et al. 1986). However methods like coherence can only capture the linear relations between time series and may fail to identify nonlinear interdependencies. Various measures of synchronization, such as synchronization likelihood (Tucker et al. 1986) and phase synchronization (Bonita et al. 2014; Lachaux et al. 1999; Tass et al. 1998; Wilmer et al. 2010; Yener et al. 2010), have been proposed to detect more general inter-dependencies. Applications of these measures in last two decades to EEG and MEG data have shown that nonlinear relations between different brain regions indeed exist (Mormann et al. 2000; Schoenberg and Speckens 2015; Stam and Dijk 2002; Tass et al. 1998). For neural systems, synchronization is observed both in normal function, e.g. coordinated motion of several limbs, and abnormal systems, e.g. trembling activity of a Parkinson’s patient. Synchronization is also believed to be the central mechanism behind the interaction between brain areas. Results of micro electrode recording studies on animals showed that synchronization of neuronal activity among different areas of visual cortex can be interpreted as the mechanism to link the visual features (Eckhorn et al. 1988; Singer and Gray 1995). Another study by Murthy and Fetz (1992) showed the synchronous oscillatory activity in sensorimotor cortex of rhesus monkeys. Synchrony between widely separated areas, namely visual and parietal cortex of an awake cat was reported in Konigqt and Singer (1997). Neural synchronization also plays an important role in several neurological diseases like epilepsy (Mormann et al. 2000), pathological tremors (Tass et al. 1998; McAuley and Marsden 2000), and schizophrenia (Le Van Quyen et al. 2001). In phase synchronization, the only important concept is phase locking of the coupled oscillators while no restriction is enforced on their amplitudes. Phase synchronization occurs between interacting systems (or a system and an external force) when their phases are related while their amplitudes remain chaotic and, in general, uncorrelated. In the context of this study, phase synchrony between recording sites in predefined frequencies, namely frequency ranges in alpha (8–13), beta (14–30) and gamma (31–45) bands, are examined. Employed synchrony, called phase-locking value, was introduced in Lachaux et al. (1999).
Phase locking value
In order to compute the phase locking value (PLV) (Lachaux et al. 1999) between two signals, namely, and , instantaneous phase values at the target frequency should be extracted. For this purpose, signals are band-pass filtered in desired frequency band. Then, instantaneous phase values are extracted by means of Hilbert Transform (note that phases were extracted by means of Gabor Wavelet Transform in Lachaux et al. (1999)). Then the analytic signal of is defined as:
| 2 |
where is the instantaneous amplitude, is the instantaneous phase (IP). is the Hilbert transform of . Analytic signal for is determined accordingly. Finally, PLV, between signals and is computed at time t by averaging over trials (Eq. 3) or by averaging over time windows of a single trial, n (Eq. 4) (Lachaux et al. 2000).
| 3 |
| 4 |
where is the phase difference of signals and , namely . PLV measures how this phase difference changes across trials. If the phase difference is close to zero across trials, then PLV will be close to 1 and it is smaller otherwise. PLV is an important synchronization measure when working with biosignals (particularly electrical brain activity). PLV uses narrow band signals because of challenges of physical interpretation of the instantaneous phase value for wideband signals.
The recorded EEG signals are collected from 14 channels. PLVs for each electrode pair (91 pairs of electrodes in total) for neutral, positive and negative emotions in , and bands are calculated separately to investigate the functional connectivity between brain regions. Calculations are conducted for all stimulus types (audio only, video only and audio + video) to determine the effects of stimulus type on inter-regional functional connectivity. PLVs are calculated by averaging across trials (N in Eq. 3 shows the number of trials) which have the same properties; i.e. same emotion and stimulus types. EEG signals were bandpass filtered before the calculations, using Hamming-window based linear-phase finite impulse response filter to obtain signals in predetermined frequency bands in each case. Permutation test is performed, in order to investigate whether the obtained phase locking values are due to the stimulus given to the subject and not due to the volume conduction effect. PLVs are calculated for baseline and stimulus periods and averaged over randomly shuffled trials between these periods, three stimulus types and randomly shuffled valence values. Permutation procedure is repeated for 1000 times. Only significant channel pairs (72 out of 91 channel pairs are significant for all conditions; ) are kept for further studies.
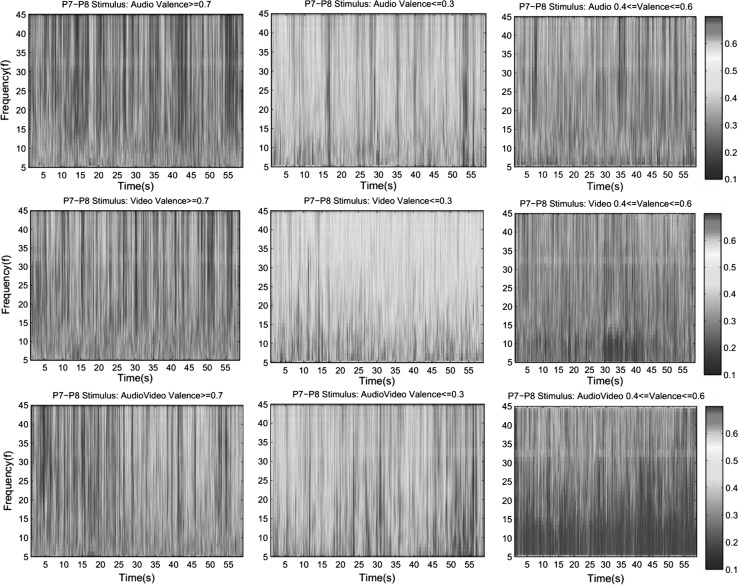
PLV values between channels P7 and P8 for each stimulus type averaged over all trials of all subjects (375 trials for each stimulus) and for each emotion class averaged over trials (numbers of trials for each condition are given in Table 6) with corresponding valence values for each stimulus type are given in Figs. 5 and 6 respectively.
Table 6.
Number of stimulus for different conditions
| Low valence | High valence | Neutral | |
|---|---|---|---|
| Audio | 163 | 88 | 65 |
| Video | 193 | 83 | 42 |
| Audio + video | 194 | 102 | 34 |
Fig. 5.
Grand average of PLV values for audio, video and audio + video stimuli between left and right parietal channels
Fig. 6.
Group average PLVs for positive (left column), negative (middle column) and neutral (right column) emotion class for audio (upper row), video (middle row) and audio + video (lower row) stimulus between left and right parietal channels
Results
In this study, interactions between brain regions through phase locking value for positive and negative emotions in alpha, beta and gamma bands and effect of stimuli type on interacting regions are investigated.
Phase locking values for all electrode pairs are obtained for positive (valence0.7), negative (valence0.3) and neutral (0.4valence0.6) emotional conditions for all subjects.
Statistical significance
In order to determine the statistical significance of each PLV, they are compared to the PLVs obtained between shifted trials (Lachaux et al. 2000). Surrogate values are acquired by computing phase differences over the shifted trials:
| 5 |
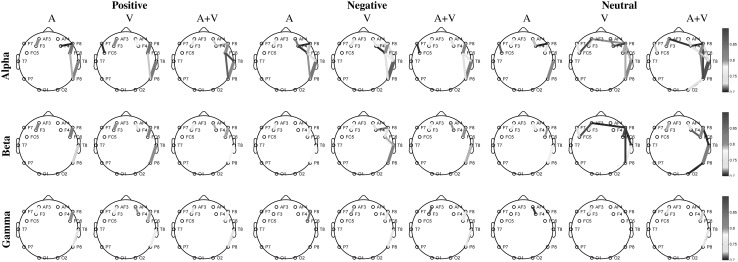
Permutation test, with 1000 surrogate values, revealed that most of the channel pairs have PLV values significantly larger than chance (). p Values and PLVs for insignificant channel pairs are given in “Appendix”. Note that the synchronization for insignificant channel pairs are too weak (PLVs are less than 0.16). Figure 7 shows strong PLVs () for each emotional case.
Fig. 7.
Significant and strong () phase locking values between electrodes for positive/negative/neutral emotions. Columns represents stimulus types and rows represents oscillations in , and bands
Three-way repeated Analysis of Variance (ANOVA) involving type of stimulus (three levels: audio, video and audio + video), emotion (three levels: positive, negative and neutral) and oscillations (three levels: and ). Single trial phase locking values (S-PLV) are calculated for each condition, in order to generate the PLV distributions for ANOVA analysis. S-PLV values are averaged over 58-s time windows for each trial. First and last seconds of 60-s of EEG data are removed to avoid the startle effects. ANOVA analysis showed that there is no channel pair that has significant three-way interaction. All of the factors are significant with p, and no significant interaction was found between factors type of stimulusxoscillations and oscillationsxemotion. However, type of stimulusxemotion is significant with p.
Significance for emotions
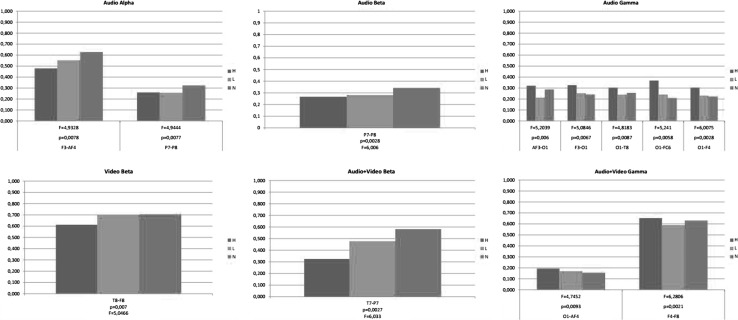
One-way ANOVA test with the factor emotion (three levels: positive, negative and neutral) is realized to determine whether the degrees of phase locking values between electrode locations are significantly different between positive, negative and neutral emotions for each stimulus type and oscillation pair. Channels with significant PLVs are shown in Fig. 8. Test results are evaluated at significance level of 0.01.
Fig. 8.
Channel pairs with significantly different PLVs between positive, negative and neutral emotions. Test results are evaluated at significance level of 0.01
Tukey’s post hoc test showed that there is no channel pair having significant PLV difference between positive/negative and between negative/neutral emotions in -oscillations for any stimulus type.
-oscillations are only significantly different when audio stimulus is used and the difference is observed between channel pairs F3–AF4 and P7–P8 ( and respectively). The only significant difference between emotions types is apparent between positive and negative emotions in channel pair T8–F8 () when video only stimulus is used for emotion elicitation. Significant inter hemisphere synchronizations are apparent between positive/neutral () and negative/neutral () cases in -oscillations for audio stimulus between left and right parietal electrodes. Positive emotions are observed to have significant -oscillation differences from other emotions between channels T7 and P7 for audio + video stimulus ( for both cases).
Our results also show that O1 has significant long range synchronization in -band between positive and negative emotions, with AF3 (), T8 (), FC6 (), F4 () for audio only stimulus and with AF4 () for audio + video stimulus. Another difference in -band is observed between negative and neutral emotions between F4–F8 for audio + video stimulus.
Significant differences among stimulus types
Phase synchronization values may differ depending on the stimuli types. One of the focusing point of this study is to investigate the effect of the stimuli type on functional connections for emotional cases. One-way ANOVA test with one factor; type of stimulus (three levels: audio, video and audio + video) is applied to uncover the stimulus type effects on couplings between brain regions. Interestingly no significant difference is found for positive emotions. Considering negative emotions, however, stimulus type affects the phase locking values. Significant differences are shown in Table 4.
Table 4.
List of significant differences betwen stimulus types
| Negative | Neutral | ||
|---|---|---|---|
| Alpha | Beta | Gamma | Gamma |
| O1–T8 | O1–T8 | O1–T8 | FC6–F4 |
| T7–P8 | T7–P8 | T7–P8 | |
|---|---|---|---|
| O2–T8 | |||
|---|---|---|---|
Tukey’s post hoc test revealed the differences between stimulus types. Results show that, channel pair O1–T8 has significantly different PLV values between audio and video stimuli in all bands (, 0.0057 and 0.0046 for and bands respectively) for negative emotions. Phase locking values for pair T7–P8 differ between audio and audio + video stimuli in all bands (, 0.0044 and 0.0037 for and bands respectively). Only difference is found in band between FC6 and F4 for neutral stimuli between audio and audio + video stimulus ().
Results reveal that stimulus involving a video is only separable from audio only stimulus for negative or neutral emotions. It is worth to note that, although weak, there exist significant couplings between hemispheres for different stimulus types.
Discussion
In this study, interactions between brain regions are studied through phase locking values for positive, negative and neutral emotions in , and bands. Effects of stimulus type are also studied. For this purpose, we constructed an emotional EEG database using audio, video and audio + video stimuli.
PLVs for each channel pair are tested for significance using permutation test. Original PLVs are compared to PLVs calculated using the phase differences computed over randomly shuffled trials. Most of the channel pairs were approved to be significant in permutation test with , showing that the PLVs are significantly larger than chance. Significant PLVs with strong couplings are shown in Fig. 7. Strong connections are found to be between regions on the same hemisphere as expected. Note that hemispheric lateralization is remarkable as phase synchronization values between channels are significant and high in right hemisphere for all emotions. This finding supports the theory stating the dominance of right hemisphere over the left for processing primary emotions (Holtgraves and Felton 2011). Similar results are also reported for processing affective stimuli in Borod et al. (1998), Joczyk (2016), Mashal and Itkes (2016), Mitchell et al. (2003).
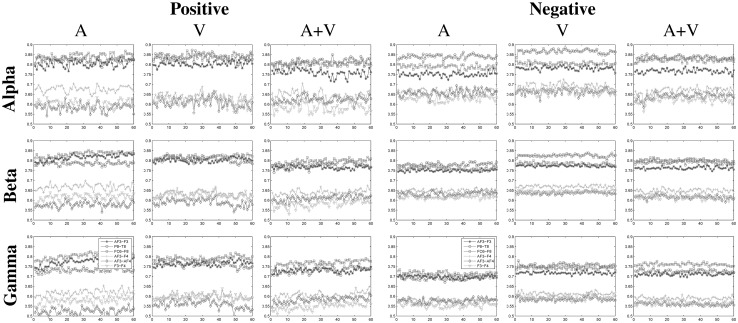
Besides all electrodes in right hemisphere and left frontal electrodes have control over emotion in terms of functional connectivity. In left hemisphere, significantly different mean PLV values are detected between frontal and anterior-frontal regions for all cases. Strong synchronization values are observed between AF3–F3 in left hemisphere and P8–T8 and FC6–F8 in right hemisphere. PLV values for these channel pairs are shown in Fig. 10.
Fig. 10.
Phase locking values between specific electrode pairs (AF3–F3, P8–T8, FC6–F8 and AF3–F4, AF3–AF4, F3–F4) for positive and negative emotions
Maximum PLV values are observed between FC6 and F8 channels for positive emotions; whereas for negative and neutral emotions synchronization between right parietal and temporal regions are higher in and oscillations.
It is known that oscillatory activity plays an important role in cognitive processing (Başar and Güntekin 2012). Del Zotto et al. (2013) reports important changes in low alpha range spectral power and stresses the role of right frontal regions in differentiating emotional valence. Our findings confirms the importance of oscillations as connectivity between electrodes are stronger in band than that of in and bands. Besides, our results agree with the literature in terms of the importance of the anterior regions (Balconi and Lucchiari 2006; Balconi and Mazza 2009; Del Zotto et al. 2013; Güntekin and Basar 2007). A very interesting finding is the strong connectivity () between AF3–F8 and AF3–F4 when processing neutral emotions using video (in and oscillations) and audio + video ( oscillations) stimuli respectively.
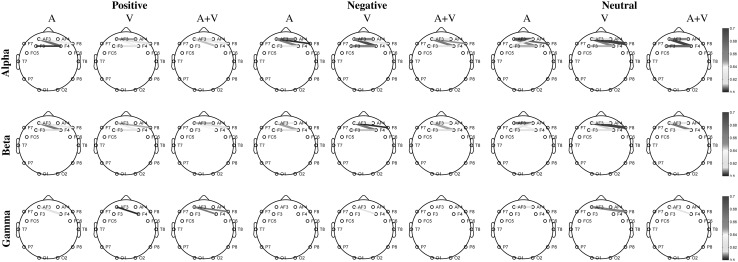
It is not strange that interhemisphere connectivity is weaker than that of within hemisphere regions. Therefore, we examine the inter-hemisphere connectivity values for a weaker threshold, namely 0.6 in Fig. 9. These results show that both left and right frontal regions contribute emotion processing in terms of functional connectivity. Significant and strong phase locking values are observed between left anterior frontal and right mid-frontal, inferior-frontal and anterior frontal regions; and also between left and right mid frontal regions.
Fig. 9.
Significant and strong () inter-hemisphere phase locking values between for positive/negative/neutral emotions
Major goals of this study were to investigate the differences between emotion types and stimulus types. For this purpose, ANOVA analysis is conducted between conditions. Significant differences between emotions are detected between AF3–O1, P7–T7, P7–P8, T8–F8, F4–F8 and inter-hemisphere regions F3–AF4 and between O1 and AF4, F4, FC6, T8 (Fig. 10).
It is accepted that the right hemisphere has more control over emotion than left hemisphere, and there also are studies on complementary specialization of hemispheres for control of different emotion types (Harmon-Jones 2003; Iwaki and Noshiro 2012; Lane and Nadel 2002). In these studies, it is stated that left hemisphere primarily process positive emotions whereas right hemisphere primarily process negative emotions. Similarly, Alfano and Cimino (2008) showed that right hemisphere gets more active than left hemisphere when subjects were primed with a negative stimulus. Our findings show that, significant differences are observed between right temporal/right inferior frontal and left temporal/right parietal regions for video only and audio + video stimuli in band respectively. For both cases PLV values for negative emotions are higher than that of for positive emotions. Therefore, we do not have the results that would support this statement about complementary specialization of hemispheres in terms of phase locking values. However, this issue should be investigated deeper as the difference is apparent in oscillations and it should be clarified if this result is due to emotional difference or oscillations.
Besides, in Güntekin and Basar (2007), increased amplitudes of alpha and beta responses are found for angry stimulation than happy face stimulation. Face pictures were used for emotion elicitation. Significant differences were found in posterior and central regions for alpha and beta responses respectively. Although our results show no significant differences for PLV values in alpha oscillations, PLV values are significantly different for high and low valence trials between left posterior (P7) and central (T7) locations for audio + video stimulus and between right central (T8) and inferior frontal (F8) in beta oscillations. Note that, PET (Morris et al. 1996) and fMRI (Adolphs 2002) studies presented the role of the amygdala, specifically in perception of negative facial emotion. Supporting this statement, our findings show the existence of interaction between temporal lobe and frontal and parietal lobes. In addition, Adolphs (2002) also declares the importance of occipital and temporal lobes for detailed representation in early emotion processing and subsequent structures involving amygdala and orbitofrontal cortex. In this study, we observed significant phase locking value differences in gamma-band oscillations, for audio only stimulus, between occipital lobe (O1) and left orbitofrontal (AF3), right temporal (T8), mid-frontal (F4) and fronto central (FC6) electrodes, and between O1 and AF4 for audio + video stimulus, showing the existence of a network between these regions.
We also monitored significant differences in phase coupling between high and low valence in oscillations for left occipital electrode and right temporal, mid-frontal and fronto-central electrodes when audio only stimulus is used. Besides, it is significantly coupled to the right anterior-frontal regions if audio + video stimulus is used. For video stimulus there is no channel pair having significantly different PLVs for emotional and neutral stimuli.
In this paper, we also investigated the effect of stimulus type for high, low and moderate valence values. ANOVA analysis show that stimulus types are not separable for emotions having high valence. For negative emotions, however, PLV values between left occipital and right temporal electrodes for audio only and video only stimuli and between left temporal and right parietal electrodes for audio only and audio + video stimuli are found to be significantly different. Considering neutral emotions, audio only stimulus is separable for audio + video stimulus in band between FC6 and F4.
Results reveal that PLV values significantly differ only between audio only stimulus and video only or audio + video stimulus and video only stimulus is not separable from audio + video stimulus for any emotion type in terms of phase locking. This result might be interpreted as video content is the most effective stimulus type, since adding audio content to video stimulus do not significantly change PLV values. These results are in accordance with previous studies on classification of two valence classes using film clips (Liu et al. 2017) and picture and classical music (Jatupaiboon et al. 2013) which reported accuracies of 86.63 and 75.62%, showing that the video content is more effective than music or just a sequence of pictures. These correspondence should be double-checked by performing classification studies on subject dependent and independent studies on different stimulus types and the effect of the stimulus type should be discovered to select the best method for real time systems.
Appendix
Insignificant channels
Insignificant channel pairs after performing permutation test with 1000 surrogate values are shown in Table 5. Significance level is set to . In the table, corresponding p values and PLV values are shown below the channel pair.
Table 5.
Insignificant channel pairs with
| High | Low | Neutral | |
|---|---|---|---|
| Audio | |||
| F7–O1 | F7–O1 | O1–AF4 | |
| (1.00, 0.08) | (0.23, 0.07) | (0.02, 0.11) | |
| FC5–O1 | |||
| (0.09, 0.09) | |||
| F7–O1 | |||
| (0.15, 0.07) | |||
| T7–AF4 | |||
| (0.12, 0.09) | |||
| Video | |||
| F7–O1 | |||
| (1.00, 0.09) | |||
| P7–AF4 | F7–O1 | ||
| (1.00, 0.09) | (1.00, 0.05) | ||
| O1–AF4 | |||
| (0.18, 0.10) | |||
| Audio + video | |||
| F7–O1 | F7–O1 | ||
| (0.80, 0.09) | (1.00, 0.13) | ||
| F7–O2 | F7–O1 | O1–F8 | |
| (1.00, 0.08) | (1.00, 0.05) | (0.04, 0.16) | |
| P7–AF4 | O1–AF4 | ||
| (0.95, 0.08) | (1.00, 0.14) | ||
| F7–O1 | F7–O1 | ||
| (0.15, 0.09) | (1.00, 0.14) | ||
| T7–O2 | T7–O2 | ||
| (1.00, 0.08) | (0.50, 0.15) | ||
| T7–O2 | F7–O1 | ||
| (1.00, 0.08) | (1.00, 0.15) | ||
| T7–F4 | T7–O2 | ||
| (0.78, 0.09) | (0.98, 0.15) | ||
| T7–AF4 | O1–AF4 | ||
| (0.89, 0.09) | (0.03, 0.16) | ||
The values in parenthesis represent p values and PLV values respectively
Number of trials
PLVs are calculated for each electrode pair by averaging across trials which have the same properties; same stimulus type (audio, video, audio + video), same emotion (positive, negative, neutral) for each oscillation (). Number of EEG segments collected from all subjects for each condition pair is given in Table 6.
Single trial phase locking values (S-PLV) are calculated for each condition, in order to generate the PLV distributions for ANOVA analysis. S-PLV definition is defined in Lachaux et al. (2000) and shown in Eq. 4.
References
- Adolphs R. Recognizing emotion from facial expressions: psychological and neurological mechanisms. Behav Cogn Neurosci Rev. 2002;1(1):21–62. doi: 10.1177/1534582302001001003. [DOI] [PubMed] [Google Scholar]
- Alfano KM, Cimino CR. Alteration of expected hemispheric asymmetries: valence and arousal effects in neuropsychological models of emotion. Brain Cogn. 2008;66(3):213–220. doi: 10.1016/j.bandc.2007.08.002. [DOI] [PubMed] [Google Scholar]
- Badcock NA, Mousikou P, Mahajan Y, deLissa P, Thie J, McArthur G. Validation of the Emotiv EPOC® EEG gaming system for measuring research quality auditory ERPs. PeerJ. 2013;1:e38. doi: 10.7717/peerj.38. [DOI] [PMC free article] [PubMed] [Google Scholar]
- Balconi M, Lucchiari C. EEG correlates (event-related desynchronization) of emotional face elaboration: a temporal analysis. Neurosci Lett. 2006;392(1):118–123. doi: 10.1016/j.neulet.2005.09.004. [DOI] [PubMed] [Google Scholar]
- Balconi M, Lucchiari C. Consciousness and arousal effects on emotional face processing as revealed by brain oscillations. A gamma band analysis. Int J Psychophysiol. 2008;67(1):41–46. doi: 10.1016/j.ijpsycho.2007.10.002. [DOI] [PubMed] [Google Scholar]
- Balconi M, Mazza G. Brain oscillations and bis/bas (behavioral inhibition/activation system) effects on processing masked emotional cues: Ers/erd and coherence measures of alpha band. Int J Psychophysiol. 2009;74(2):158–165. doi: 10.1016/j.ijpsycho.2009.08.006. [DOI] [PubMed] [Google Scholar]
- Başar E, Güntekin B. A short review of alpha activity in cognitive processes and in cognitive impairment. Int J Psychophysiol. 2012;86(1):25–38. doi: 10.1016/j.ijpsycho.2012.07.001. [DOI] [PubMed] [Google Scholar]
- Baumgartner T, Esslen M, Jäncke L. From emotion perception to emotion experience: emotions evoked by pictures and classical music. Int J Psychophysiol. 2006;60(1):34–43. doi: 10.1016/j.ijpsycho.2005.04.007. [DOI] [PubMed] [Google Scholar]
- Bobrov P, Frolov A, Cantor C, Fedulova I, Bakhnyan M, Zhavoronkov A. Brain–computer interface based on generation of visual images. PLoS ONE. 2011;6(6):e20674. doi: 10.1371/journal.pone.0020674. [DOI] [PMC free article] [PubMed] [Google Scholar]
- Bonita JD, Ambolode LCC, Rosenberg BM, Cellucci CJ, Watanabe TAA, Rapp PE, Albano AM. Time domain measures of inter-channel eeg correlations: a comparison of linear, nonparametric and nonlinear measures. Cogn Neurodyn. 2014;8(1):1–15. doi: 10.1007/s11571-013-9267-8. [DOI] [PMC free article] [PubMed] [Google Scholar]
- Borod JC, Obler LK, Agosti RM, Borod JC, Santschi C. Right hemisphere emotional perception: evidence across multiple channels. Neuropsychology. 1998;12(3):446–458. doi: 10.1037//0894-4105.12.3.446. [DOI] [PubMed] [Google Scholar]
- Bradley MM, Lang PJ. Measuring emotion: the self-assessment manikin and the semantic differential. J Behav Therapy Exp Psychiatry. 1994;25(1):49–59. doi: 10.1016/0005-7916(94)90063-9. [DOI] [PubMed] [Google Scholar]
- Bressler SL. Large-scale cortical networks and cognition. Brain Res Rev. 1995;20:288–304. doi: 10.1016/0165-0173(94)00016-i. [DOI] [PubMed] [Google Scholar]
- Brovelli A, Ding M, Ledberg A, Chen Y, Nakamura R, Bressler SL. Beta oscillations in a large-scale sensorimotor cortical network: directional influences revealed by Granger causality. Proc Natl Acad Sci USA. 2004;101(26):9849–9854. doi: 10.1073/pnas.0308538101. [DOI] [PMC free article] [PubMed] [Google Scholar]
- Chen Y-H, Christopher Edgar J, Holroyd T, Dammers J, Thönneßen H, Roberts TPL, Mathiak K. Neuromagnetic oscillations to emotional faces and prosody. Eur J Neurosci. 2010;31(10):1818–1827. doi: 10.1111/j.1460-9568.2010.07203.x. [DOI] [PubMed] [Google Scholar]
- Del Zotto M, Deiber M-P, Legrand LB, De Gelder B, Pegna AJ. Emotional expressions modulate low and oscillations in a cortically blind patient. Int J Psychophysiol. 2013;90(3):358–362. doi: 10.1016/j.ijpsycho.2013.10.007. [DOI] [PubMed] [Google Scholar]
- Delorme A, Makeig S. EEGLAB: an open source toolbox for analysis of single-trial EEG dynamics including independent component analysis. J Neurosci Methods. 2004;134(1):9–21. doi: 10.1016/j.jneumeth.2003.10.009. [DOI] [PubMed] [Google Scholar]
- Dimitriadis SI, Laskaris NA, Micheloyannis S. Transition dynamics of eeg-based network microstates during mental arithmetic and resting wakefulness reflects task-related modulations and developmental changes. Cogn Neurodyn. 2015;9(4):371–387. doi: 10.1007/s11571-015-9330-8. [DOI] [PMC free article] [PubMed] [Google Scholar]
- Ding M, Bressler SL, Yang W, Liang H. Short-window spectral analysis of cortical event-related potentials by adaptive multivariate autoregressive modeling: data preprocessing, model validation, and variability assessment. Biol Cybern. 2000;83(1):35–45. doi: 10.1007/s004229900137. [DOI] [PubMed] [Google Scholar]
- Eckhorn R, Bauer R, Jordan W, Brosch M, Kruse W, Munk M, Reitboeck H. Coherent oscillations: a mechanism of feature linking in the visual cortex? Biol Cybern. 1988;60(2):121–130. doi: 10.1007/BF00202899. [DOI] [PubMed] [Google Scholar]
- Engel AK, Fries P. Beta-band oscillationssignalling the status quo? Curr Opin Neurobiol. 2010;20(2):156–165. doi: 10.1016/j.conb.2010.02.015. [DOI] [PubMed] [Google Scholar]
- Gomez-Herrero G. Automatic artifact removal (AAR) toolbox v1.3 for MATLAB. Tamp Univ Technol. 2007;3:1–23. [Google Scholar]
- Güntekin B, Basar E. Emotional face expressions are differentiated with brain oscillations. Int J Psychophysiol. 2007;64(1):91–100. doi: 10.1016/j.ijpsycho.2006.07.003. [DOI] [PubMed] [Google Scholar]
- Güntekin B, Başar E. A review of brain oscillations in perception of faces and emotional pictures. Neuropsychologia. 2014;58:33–51. doi: 10.1016/j.neuropsychologia.2014.03.014. [DOI] [PubMed] [Google Scholar]
- Harmon-Jones E. Clarifying the emotive functions of asymmetrical frontal cortical activity. Psychophysiology. 2003;40(6):838–848. doi: 10.1111/1469-8986.00121. [DOI] [PubMed] [Google Scholar]
- Hassan M, Wendling F. Tracking dynamics of functional brain networks using dense eeg. IRBM. 2015;36(6):324–328. [Google Scholar]
- Hassan M, Benquet P, Biraben A, Berrou C, Dufor O, Wendling F. Dynamic reorganization of functional brain networks during picture naming. Cortex. 2015;73:276–288. doi: 10.1016/j.cortex.2015.08.019. [DOI] [PubMed] [Google Scholar]
- Hattingh CJ, Ipser J, Tromp S, Syal S, Lochner C, Brooks SJB, Stein DJ. Functional magnetic resonance imaging during emotion recognition in social anxiety disorder: an activation likelihood meta-analysis. Front Hum Neurosci. 2013;6:347. doi: 10.3389/fnhum.2012.00347. [DOI] [PMC free article] [PubMed] [Google Scholar]
- Holmes A, Vuilleumier P, Eimer M. The processing of emotional facial expression is gated by spatial attention: evidence from event-related brain potentials. Cogn Brain Res. 2003;16(2):174–184. doi: 10.1016/s0926-6410(02)00268-9. [DOI] [PubMed] [Google Scholar]
- Holtgraves T, Felton A. Hemispheric asymmetry in the processing of negative and positive words: a divided field study. Cogn Emot. 2011;25(4):691–699. doi: 10.1080/02699931.2010.493758. [DOI] [PubMed] [Google Scholar]
- Hooker CI, Hooker CI, Bruce L, Fisher M, Verosky SC, Miyakawa A, Vinogradov S. Neural activity during emotion recognition after combined cognitive plus social cognitive training in schizophrenia. Schizophr Res. 2012;139(1):53–59. doi: 10.1016/j.schres.2012.05.009. [DOI] [PMC free article] [PubMed] [Google Scholar]
- Iwaki T, Noshiro M (2012) Eeg activity over frontal regions during positive and negative emotional experience. In: 2012 ICME international conference on complex medical engineering (CME), pp 418–422
- Jabbi M, Kohn PD, Nash T, Ianni A, Coutlee C, Holroyd T, Carver FW, Chen Q, Cropp B, Kippenhan JS et al (2014) Convergent bold and beta-band activity in superior temporal sulcus and frontolimbic circuitry underpins human emotion cognition. Cereb Cortex bht427 [DOI] [PMC free article] [PubMed]
- Jatupaiboon N, Pan-ngum S, Israsena P. Real-time eeg-based happiness detection system. Sci World J. 2013;2013:618649. doi: 10.1155/2013/618649. [DOI] [PMC free article] [PubMed] [Google Scholar]
- Joczyk R. Hemispheric asymmetry of emotion words in a non-native mind: a divided visual field study. Laterality Asymmetries Body Brain Cogn. 2016;20(3):326–347. doi: 10.1080/1357650X.2014.966108. [DOI] [PubMed] [Google Scholar]
- Kang J-S, Park U, Gonuguntla V, Veluvolu KC, Lee M. Human implicit intent recognition based on the phase synchrony of EEG signals. Pattern Recognit Lett. 2015;66:144–152. [Google Scholar]
- Kassam KS, Markey AR, Cherkassky VL, Loewenstein G, Just MA. Identifying emotions on the basis of neural activation. PLoS ONE. 2013;8(6):e66032. doi: 10.1371/journal.pone.0066032. [DOI] [PMC free article] [PubMed] [Google Scholar]
- Keil A, Müller MM, Gruber T, Wienbruch C, Stolarova M, Elbert T. Effects of emotional arousal in the cerebral hemispheres: a study of oscillatory brain activity and event-related potentials. Clin Neurophysiol. 2001;112(11):2057–2068. doi: 10.1016/s1388-2457(01)00654-x. [DOI] [PubMed] [Google Scholar]
- Khosrowabadi R, Heijnen M, Wahab A, Quek HC (2010) The dynamic emotion recognition system based on functional connectivity of brain regions. In: 2010 IEEE intelligent vehicles symposium (IV). IEEE, pp 377–381
- Koelstra S, Mühl C, Soleymani M, Lee JS, Yazdani A, Ebrahimi T, Pun T, Nijholt A, Patras I. DEAP: a database for emotion analysis; using physiological signals. IEEE Trans Affect Comput. 2012;3(1):18–31. [Google Scholar]
- Konigqt P, Singer W. Visuomotor integration is associated with zero time-lag synchronization among cortical areas. Nature. 1997;385:157. doi: 10.1038/385157a0. [DOI] [PubMed] [Google Scholar]
- Lachaux JP, Rodriguez E, Martinerie J, Varela FJ. Measuring phase synchrony in brain signals. Hum Brain Mapp. 1999;8(4):194–208. doi: 10.1002/(SICI)1097-0193(1999)8:4<194::AID-HBM4>3.0.CO;2-C. [DOI] [PMC free article] [PubMed] [Google Scholar]
- Lachaux J-P, Rodriguez E, Le Van Quyen M, Lutz A, Martinerie J, Varela FJ. Studying single-trials of phase synchronous activity in the brain. Int J Bifurc Chaos. 2000;10(10):2429–2439. [Google Scholar]
- Lane RD, Nadel L. Cognitive neuroscience of emotion. Oxford: Oxford University Press; 2002. [Google Scholar]
- Le Van Quyen M, Foucher J, Lachaux J, Rodriguez E, Lutz A, Martinerie J, Varela FJ. Comparison of Hilbert transform and wavelet methods for the analysis of neuronal synchrony. J Neurosci Methods. 2001;111(2):83–98. doi: 10.1016/s0165-0270(01)00372-7. [DOI] [PubMed] [Google Scholar]
- Lee Y-Y, Hsieh S. Classifying different emotional states by means of EEG-based functional connectivity patterns. PloS ONE. 2014;9(4):e95415. doi: 10.1371/journal.pone.0095415. [DOI] [PMC free article] [PubMed] [Google Scholar]
- Li Y, Cao D, Wei L, Tang Y, Wang J. Abnormal functional connectivity of eeg gamma band in patients with depression during emotional face processing. Clin Neurophysiol. 2015;126(11):2078–2089. doi: 10.1016/j.clinph.2014.12.026. [DOI] [PubMed] [Google Scholar]
- Lichev V, Sacher J, Ihme K, Rosenberg N, Quirin M, Lepsien J, Pampel A, Rufer M, Grabe H-J, Kugel H, et al. Automatic emotion processing as a function of trait emotional awareness: an fMRI study. Soc Cogn Affect Neurosci. 2015;10(5):680–689. doi: 10.1093/scan/nsu104. [DOI] [PMC free article] [PubMed] [Google Scholar]
- Lindquist KA, Wager TD, Kober H, Bliss-Moreau E, Barrett LF. The brain basis of emotion: a meta-analytic review. Behav Brain Sci. 2012;35(03):121–143. doi: 10.1017/S0140525X11000446. [DOI] [PMC free article] [PubMed] [Google Scholar]
- Liu Y-J, Yu M, Zhao G, Song J, Ge Y, Shi Y. Real-time movie-induced discrete emotion recognition from EEG signals. IEEE Trans Affect Comput. 2017 [Google Scholar]
- Luo Q, Holroyd T, Jones M, Hendler T, Blair J. Neural dynamics for facial threat processing as revealed by gamma band synchronization using meg. Neuroimage. 2007;34(2):839–847. doi: 10.1016/j.neuroimage.2006.09.023. [DOI] [PMC free article] [PubMed] [Google Scholar]
- Luo Q, Mitchell D, Cheng X, Mondillo K, Mccaffrey D, Holroyd T, Carver F, Coppola R, Blair J. Visual awareness, emotion, and gamma band synchronization. Cereb Cortex. 2009;19(8):1896–1904. doi: 10.1093/cercor/bhn216. [DOI] [PMC free article] [PubMed] [Google Scholar]
- Ma M, Li Y, Xu Z, Tang Y, Wang J (2012) Small-world network organization of functional connectivity of EEG gamma oscillation during emotion-related processing. In: 2012 5th International conference on biomedical engineering and informatics (BMEI). IEEE, pp 597–600
- Mashal N, Itkes O. The effects of emotional valence on hemispheric processing of metaphoric word pairs. Laterality Asymmetries Body Brain Cogn. 2016;19(5):511–521. doi: 10.1080/1357650X.2013.862539. [DOI] [PubMed] [Google Scholar]
- McAuley J, Marsden C. Physiological and pathological tremors and rhythmic central motor control. Brain. 2000;123(8):1545–1567. doi: 10.1093/brain/123.8.1545. [DOI] [PubMed] [Google Scholar]
- McMahan T, Parberry I, Parsons TD. Modality specific assessment of video game players experience using the Emotiv. Entertain Comput. 2015;7:1–6. [Google Scholar]
- Mitchell RLC, Elliott R, Barry M, Cruttenden A, Woodruff PWR. The neural response to emotional prosody, as revealed by functional magnetic resonance imaging. Neuropsychologia. 2003;41:1410–1421. doi: 10.1016/s0028-3932(03)00017-4. [DOI] [PubMed] [Google Scholar]
- Mormann F, Lehnertz K, David P, Elger CE. Mean phase coherence as a measure for phase synchronization and its application to the EEG of epilepsy patients. Phys D Nonlinear Phenom. 2000;144(3):358–369. [Google Scholar]
- Morris JS, Frith CD, Perrett DI, Rowland D, et al. A differential neural response in the human amygdala to fearful and happy facial expressions. Nature. 1996;383(6603):812. doi: 10.1038/383812a0. [DOI] [PubMed] [Google Scholar]
- Murthy VN, Fetz EE. Coherent 25-to 35-Hz oscillations in the sensorimotor cortex of awake behaving monkeys. Proc Natl Acad Sci. 1992;89(12):5670–5674. doi: 10.1073/pnas.89.12.5670. [DOI] [PMC free article] [PubMed] [Google Scholar]
- Müsch K, Hamamé CM, Perrone-Bertolotti M, Minotti L, Kahane P, Engel AK, Lachaux J-P, Schneider TR. Selective attention modulates high-frequency activity in the face-processing network. Cortex. 2014;60:34–51. doi: 10.1016/j.cortex.2014.06.006. [DOI] [PubMed] [Google Scholar]
- Nunez PL, Srinivasan R, Westdorp F, Wijesinghe RS, Tucker DM, Silberstein RB, Cadusch PJ. EEG coherency. I: statistics, reference electrode, volume conduction, Laplacians, cortical imaging, and interpretation at multiple scales. Electroencephalogr Clin Neurophysiol. 1997;103(5):499–515. doi: 10.1016/s0013-4694(97)00066-7. [DOI] [PubMed] [Google Scholar]
- Palermo R, Rhodes G. Are you always on my mind? A review of how face perception and attention interact. Neuropsychologia. 2007;45(1):75–92. doi: 10.1016/j.neuropsychologia.2006.04.025. [DOI] [PubMed] [Google Scholar]
- Pizzagalli D, Regard M, Lehmann D. Rapid emotional face processing in the human right and left brain hemispheres: an ERP study. Neuroreport. 1999;10(13):2691–2698. doi: 10.1097/00001756-199909090-00001. [DOI] [PubMed] [Google Scholar]
- Popov T, Miller GA, Rockstroh B, Weisz N. Modulation of power and functional connectivity during facial affect recognition. J Neurosci. 2013;33(14):6018–6026. doi: 10.1523/JNEUROSCI.2763-12.2013. [DOI] [PMC free article] [PubMed] [Google Scholar]
- Quraan MA, Protzner AB, Daskalakis ZJ, Giacobbe P, Tang CW, Kennedy SH, Lozano AM, McAndrews MP. EEG power asymmetry and functional connectivity as a marker of treatment effectiveness in DBS surgery for depression. Neuropsychopharmacology. 2014;39(5):1270–1281. doi: 10.1038/npp.2013.330. [DOI] [PMC free article] [PubMed] [Google Scholar]
- Rodríguez A, Rey B, Clemente M, Wrzesien M, Alcañiz M. Assessing brain activations associated with emotional regulation during virtual reality mood induction procedures. Expert Syst Appl. 2015;42(3):1699–1709. [Google Scholar]
- Sakkalis V. Review of advanced techniques for the estimation of brain connectivity measured with EEG/MEG. Comput Biol Med. 2011;41(12):1110–1117. doi: 10.1016/j.compbiomed.2011.06.020. [DOI] [PubMed] [Google Scholar]
- Salenius S, Hari R. Synchronous cortical oscillatory activity during motor action. Curr Opin Neurobiol. 2003;13(6):678–684. doi: 10.1016/j.conb.2003.10.008. [DOI] [PubMed] [Google Scholar]
- Sato W, Kochiyama T, Uono S, Matsuda K, Usui K, Inoue Y, Toichi M. Rapid amygdala gamma oscillations in response to fearful facial expressions. Neuropsychologia. 2011;49(4):612–617. doi: 10.1016/j.neuropsychologia.2010.12.025. [DOI] [PubMed] [Google Scholar]
- Schoenberg PLA, Speckens AEM. Multi-dimensional modulations of and cortical dynamics following mindfulness-based cognitive therapy in major depressive disorder. Cogn Neurodyn. 2015;9(1):13–29. doi: 10.1007/s11571-014-9308-y. [DOI] [PMC free article] [PubMed] [Google Scholar]
- Shahabi H, Moghimi S. Toward automatic detection of brain responses to emotional music through analysis of EEG effective connectivity. Comput Hum Behav. 2016;58:231–239. [Google Scholar]
- Singer W, Gray CM. Visual feature integration and the temporal correlation hypothesis. Annu Rev Neurosci. 1995;18(1):555–586. doi: 10.1146/annurev.ne.18.030195.003011. [DOI] [PubMed] [Google Scholar]
- Stam CJ, van Dijk BW. Synchronization likelihood: an unbiased measure of generalized synchronization in multivariate data sets. Phys D Nonlinear Phenom. 2002;163(3–4):236–251. [Google Scholar]
- Steyn-Ross ML, Steyn-Ross DA, Sleigh JW. Gap junctions modulate seizures in a mean-field model of general anesthesia for the cortex. Cogn Neurodyn. 2012;6(3):215–225. doi: 10.1007/s11571-012-9194-0. [DOI] [PMC free article] [PubMed] [Google Scholar]
- Sun J, Hong X, Tong S. Phase synchronization analysis of EEG signals: an evaluation based on surrogate tests. IEEE Trans Biomed Eng. 2012;59(8):2254–2263. doi: 10.1109/TBME.2012.2199490. [DOI] [PubMed] [Google Scholar]
- Symons AE, El-Deredy W, Schwartze M, Kotz SA. The functional role of neural oscillations in non-verbal emotional communication. Front Hum Neurosci. 2016 doi: 10.3389/fnhum.2016.00239. [DOI] [PMC free article] [PubMed] [Google Scholar]
- Tass P, Rosenblum MG, Weule J, Kurths J, Pikovsky A, Volkmann J, Schnitzler A, Freund H-J. Detection of n:m phase locking from noisy data: application to magnetoencephalography. Phys Rev Lett. 1998;81(15):3291. [Google Scholar]
- Tripathy D, Raheja JL (2015) Design and implementation of brain computer interface based robot motion control. In: Proceedings of the 3rd international conference on frontiers of intelligent computing: theory and applications (FICTA) 2014, vol 328. Springer, Berlin, pp 289–296
- Tucker D, Roth D, Bair T. Functional connections among cortical regions: topography of EEG coherence. Electroencephalogr Clin Neurophysiol. 1986;63(3):242–250. doi: 10.1016/0013-4694(86)90092-1. [DOI] [PubMed] [Google Scholar]
- Wilmer A, de Lussanet MHE, Lappe M. A method for the estimation of functional brain connectivity from time-series data. Cogn Neurodyn. 2010;4(2):133–149. doi: 10.1007/s11571-010-9107-z. [DOI] [PMC free article] [PubMed] [Google Scholar]
- Winkler I, Haufe S, Tangermann M. Automatic classification of artifactual ICA-components for artifact removal in EEG signals. Behav Brain Funct. 2011;7(1):30. doi: 10.1186/1744-9081-7-30. [DOI] [PMC free article] [PubMed] [Google Scholar]
- Yener GG, Başar E. Sensory evoked and event related oscillations in alzheimers disease: a short review. Cogn Neurodyn. 2010;4(4):263–274. doi: 10.1007/s11571-010-9138-5. [DOI] [PMC free article] [PubMed] [Google Scholar]
- Yu H, Sunderraj CMAA, Chang CK, Wong J (2015) Emotion aware system for the elderly. Smart homes and health telematics. Springer, Berlin, pp 175–183
- Zion-Golumbic E, Kutas M, Bentin S. Neural dynamics associated with semantic and episodic memory for faces: evidence from multiple frequency bands. J Cogn Neurosci. 2010;22(2):263–277. doi: 10.1162/jocn.2009.21251. [DOI] [PMC free article] [PubMed] [Google Scholar]


