

Abstract
A central question in neuronal network analysis is how the interaction between individual neurons produces behavior and behavioral modifications. This task depends critically on how exactly signals are integrated by individual nerve cells functioning as complex operational units. Regional electrical properties of branching neuronal processes which determine the input-output function of any neuron are extraordinarily complex, dynamic, and, in the general case, impossible to predict in the absence of detailed measurements. To obtain such a measurement one would, ideally, like to be able to monitor, at multiple sites, subthreshold events as they travel from the sites of origin (synaptic contacts on distal dendrites) and summate at particular locations to influence action potential initiation. It became possible recently to carry out this type of measurement using high-resolution multisite recording of membrane potential changes with intracellular voltage-sensitive dyes. This chapter reviews the development and foundation of the method of voltage-sensitive dye recording from individual neurons. Presently, this approach allows monitoring membrane potential transients from all parts of the dendritic tree as well as from axon collaterals and individual dendritic spines.
Keywords: Fluorescence, Glutamate uncaging, Voltage-imaging, Potentiometric probes, Voltage-sensitive dyes, Neurons, Axons, Dendrites, Dendritic spines
1 Introduction
Understanding the biophysical properties and functional organization of single neurons and how they process information is fundamental to understanding how the brain works. Because the primary function of any nerve cell is to process electrical signals (i.e. membrane potential (Vm) transients), usually from multiple sources, there is a need for detailed spatiotemporal analysis of electrical events in thin axonal and dendritic processes. This requirement resulted in the development of new measurement techniques that allow monitoring of the electrical activity of different parts of the same cell simultaneously. A major experimental advance in this field, which also underscored the importance of such measurements, was achieved by the development of the multiple patch-electrode recording method that made possible simultaneous monitoring of voltage transients from two or more dendritic locations on a single neuron (Stuart et al. 1993; Stuart and Sakmann 1994). More recently, methods were developed for patch-pipette recording of electrical signals from cut ends of axons of layer 5 pyramidal cells in the cerebral cortex (Shu et al. 2006) as well as from presynaptic axon terminals of the giant synapses of mossy fiber-CA3 connections (Geiger et al. 2006). These techniques, however, are still limited in their capacity for assessing spatiotemporal patterns of signal initiation and propagation in complex dendritic and axonal processes. Moreover, many subcellular structures including small diameter terminal dendritic branches as well as dendritic spines and most axon terminals and axon collaterals are not accessible to electrodes. To overcome these limitations, it was highly desirable to complement the patch-electrode approach with technologies that permit extensive parallel recordings from all parts of a neuron with adequate spatial and temporal resolution. An adequate temporal resolution in recording neuronal action potential (AP) and synaptic potential signals is in the sub-millisecond range, as determined by the duration of different phases of the AP and SP waveforms. An adequate spatial resolution is on the order of 1 μm, as determined by the dimensions of neuronal terminal processes and dendritic spines. This spatio-temporal resolution can now be realized using optical recording of Vm changes with organic voltage-sensitive dyes (Vm-imaging) (Cohen and Salzberg 1978). The sensitivity of this measurement technique has recently reached a level that permits single trial optical recordings of Vm transients from all parts of a neuron, including axon terminals and collaterals, terminal dendritic branches, and individual dendritic spines. Whenever the experimental design allows signal averaging, a relatively small number of trials (4–9) will result in two or threefold improvements in the signal-to-noise ratio (S/N).
2 Determinants of Vm-Imaging Sensitivity
The central figure-of-merit in Vm-imaging is the recording sensitivity expressed as the S/N. The rules governing the sensitivity of light intensity measurements are well understood and may be put in a nutshell with an expression:
| (3.1) |
where ΔF/F is the fractional fluorescence signal per unit change in Vm and Φ is the number of detected photons per unit time (fluorescence intensity expressed as photon flux). This relationship is valid under the shot noise limited conditions fulfilled in most modern fluorescence measurements. Shot noise limited conditions imply that the noise arising from the statistical nature of the emission and detection of photons (shot noise) is the dominant source of noise in the recording system, while the following sources of noise are negligible: (a) the noise in the incident light intensity arising from an unstable light source (50 or 60 Hz and harmonic ripple noise and/or arc-wander noise); (b) noise caused by mechanical vibration of the image projected on the photodetector; (c) electrical noise in the amplifier circuits (dark-noise), and (d) read noise of the CCD camera (see also Chap. 1). Under these conditions, one way to increase the S/N for a given dye is to increase Φ by increasing either the incident light intensity or the detection efficiency, or both. An additional possibility is to increase ΔF/F per unit change in Vm (sensitivity of the dye). Thus, close attention must be paid to these two parameters.
The detected fluorescence photon flux Φ is a function of several parameters. These include: (a) the excitation light intensity; (b) the extinction coefficient of the dye absorption; (c) the quantum yield of a given dye (the efficiency of the fluorescence process defined as the ratio of the number of photons emitted to the number of photons absorbed); (d) the overall light throughput of the optical elements in the light path, including objectives, mirrors, auxiliary lenses and optical filters; (e) the quantum efficiency of the recording device (the ratio between electrons generated to the number of photons absorbed at the photoreactive surface). In addition to these factors that are usually constant for a given experiment, the photon flux will also depend on three additional variables: (f) the number of membrane-bound dye molecules in the light path which will be a function of the amount of staining and the membrane surface area projected onto individual pixels of the recording device; (g) the fraction of the fluorescent dye bound to the external membrane that changes potential and (h) the time interval over which photons are collected for each data point as determined by the imaging frame rate. Thus, the photon flux and S/N will decrease as the spatial and temporal resolutions are increased.
The voltage sensitivity of the dye, expressed as ΔF/F, depends on its chemical structure as described in Chap. 2. In addition, for a given dye, the voltage sensitivity is a function of the excitation wavelength, as demonstrated early in the development of organic probes (Cohen et al. 1974; Loew 1982). The sensitivity increases at extreme wings of the absorption spectrum for charge-shift voltage-sensitive probes. Also, the optimal sensitivity will be reached when all excitation occurs for the wavelength with the best response. In other words, monochromatic illumination at the appropriate wavelength (as opposed to the conventional use of a bandpass interference filter to select a range of wavelengths) will result in optimal sensitivity (Kuhn et al. 2004). These considerations argue that a laser emitting monochromatic light at an appropriate wavelength will be the optimal excitation light source. It should be noted that the advantages of laser illumination are more pronounced in fluorescent voltage-sensitive dye measurements since the loss of coherence introduced by fluorescence emission eliminates the speckle noise that plagues transmission (absorption) measurements using laser sources (Daintry 1984).
3 Foundation of Presently Available Recording Sensitivity
The feasibility of multiple site optical recording from individual nerve cells was initially demonstrated using invertebrate ganglia and monolayer neuronal culture and extracellular application of the voltage-sensitive dye (Salzberg et al. 1977, Grinvald et al. 1981). It was subsequently shown that sufficient sensitivity of recording with subcellular spatial resolution from intact parts of the nervous system can only be achieved if nerve cells are labeled selectively by the intracellular application of the membrane impermeant probe. This section reviews the limits to the sensitivity of recording using extracellular and intracellular application of the voltage-sensitive dyes.
3.1 Extracellular Application of Dyes
3.1.1 Dissociated Neurons in Culture
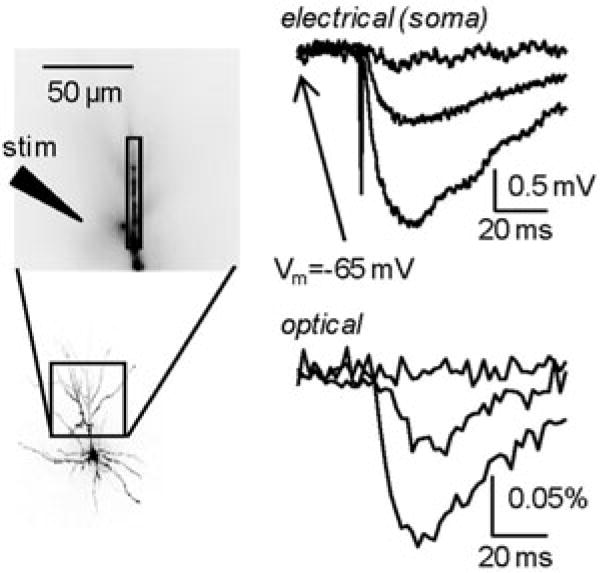
In 1981 Grinvald, Ross, and Farber demonstrated that voltage-sensitive dyes and multi-site optical measurements can be employed successfully to determine conduction velocity, space constants and regional variations in the electrical properties of neuronal processes in measurements from dissociated neurons in monolayer (Grinvald et al. 1981) culture. Both absorption and fluorescence measurements were used in these experiments and the individual dissociated neurons in a culture dish were stained from the extracellular side by bath application of the dye (Grinvald and Farber 1981). Typical optical recordings obtained from absorption and fluorescence measurements using the most sensitive probes available at the time are shown in Fig. 3.1. It has also been possible, using the same approach, to study synaptic interactions between several interconnected neurons in culture (Parsons et al. 1989, 1991), and the cell-to-cell propagation of the AP in patterned growth cardiac myocytes forming two-dimensional hearts in culture (Rohr and Salzberg 1994). The monolayer neuronal culture is a low opacity system especially convenient for the extracellular selective staining of the outside cellular membrane as well as for both absorption and fluorescence measurements. However, primary cultures are networks of neurons that grow under artificial conditions and are substantially different from intact neuronal networks. Therefore, a number of important questions in cellular neurophysiology can only be studied in intact or semi-intact preparations.
Fig. 3.1.
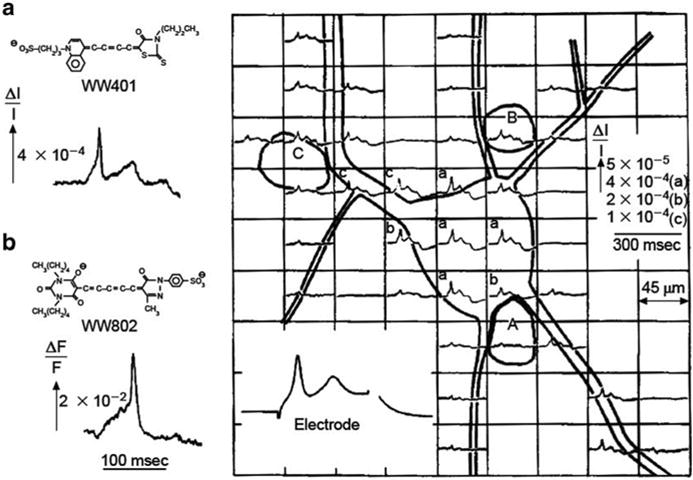
Transmission (a) and fluorescence (b) signals recorded with a single photodiode from extracellularly stained neuroblastoma cells in culture. Multiple site recording using a photodiode array is shown on the right. Adapted from Grinvald et al. (1981)
3.1.2 Invertebrate Ganglia
Extending the same approach to in situ conditions has proven difficult and, hence, slow to develop. In in situ conditions, extracellular application of fluorescent dyes cannot provide single cell resolution because of the large background fluorescence from the dye bound indiscriminately to all membranes in the preparation. Thus, in the first attempt to investigate regional electrical properties of individual neurons in situ, in the barnacle supraesophageal ganglion, (Ross and Krauthamer 1984) transmission (absorption) measurements were used and, as in the experiments on neurons in culture, bath applied voltage-sensitive dyes to record optical signals from processes of individual nerve cells. Because the S/N of these measurements was not nearly as good as in recordings from monolayer culture, extensive averaging (approximately 300 trials) was required to obtain signals from processes of single neurons. The relatively small signal size which requires extensive averaging limits the utility of this approach for studying synaptic interactions and plasticity. Also, when many neurons are active in a densely packed neuropile it is difficult to determine the source of the signal if all the cells and processes are stained by extracellular dye application (Konnerth et al. 1987). Thus, the prospect for using measurement of voltage-sensitive dye absorption or fluorescence with extracellular staining is limited, and no further experiments requiring subcellular resolution have been reported using this type of staining. The limits to the sensitivity in these measurements were determined primarily by: (a) the relatively low voltage sensitivity of the available dyes; and, (b) the large background light intensity inherent to both absorption and fluorescence measurements with extracellular application of the dye, which translates into low fractional change in light intensity (ΔI/I) related to Vm transients (Waggoner and Grinvald 1977).
3.2 Intracellular Application of Dyes
3.2.1 Invertebrate Ganglia
A different approach to optical analysis of electrical events in the processes of individual nerve cells is to stain particular neurons in situ selectively by intracellular application of an impermeant fluorescent voltage-sensitive dye. This approach is based on pioneering measurements, carried out on the giant axon of the squid, which demonstrated that optical signals may be obtained when the dye is applied from the inside (Davila et al. 1974; Cohen et al. 1974; Salzberg 1978; Gupta et al. 1981). In these experiments, optical signals were obtained from the large membrane surface area of the giant axon. Additional efforts were required to demonstrate that the same approach is feasible at the spatial scale of normal size neurons and their processes. The initial experiments using intracellular application of the voltage-sensitive dyes were carried out by Obaid, Shimizu and Salzberg (Obaid et al. 1982) and by Grinvald, Salzberg, Lev-Ram and Hildesheim (Grinvald et al. 1987) on leech neurons. The results demonstrated the essential advantages of using intracellular application of fluorescent potentiometric probes. Fluorescence measurements are more effective than absorption measurements when measuring from a small membrane area (Waggoner and Grinvald 1977), particularly in situations where the image of the object (e.g., thin process) is much smaller than the size of the photodetector picture element (pixel) (Grinvald et al. 1982; Cohen and Lesher 1986). When transmitted light is used, only a small fraction of the total light captured by individual pixels will be modulated by the signal from the neuronal process (dendrite or axon) projected onto that pixel (ΔI). Most of the light will be projected directly and will only contribute to the resting light intensity (I). Thus, the fractional signal (ΔI/I) will be very small. On the other hand, in fluorescence measurements, practically all of the light projected onto individual pixels will come from the object (if auto fluorescence is negligible) regardless of the fraction of the pixel surface area covered by the image of the object. In the experiments on leech neurons (Grinvald et al. 1987), fluorescence measurements were used to record APs and synaptic potential signals from processes of selectively stained single neurons (Fig. 3.2). As predicted, the S/N was substantially improved relative to prior absorption measurements, but it was still too low to be of practical value—the available sensitivity was insufficient for multiple site optical recording of complex electrical interactions at the level of thin neuronal processes. Due to the low sensitivity of the measurements, elaborate correction procedures and extensive temporal averaging were necessary to improve the S/N. Additionally, spatial resolution was sacrificed and the signals reported were recorded from one location with a single photodiode. Moreover, the signals originated from a relatively large region of neuropile containing many processes, albeit from a single identified neuron (Fig. 3.2c). Despite low sensitivity, these experiments clearly showed the advantages of selective staining of individual neurons by intracellular application of the dye. The limits to the sensitivity of these measurements were determined primarily by: (a) the relatively low voltage sensitivity of the available dyes (amino-phenyl styryl dyes, e.g. RH437 and RH461; fractional change in fluorescence intensity per AP, in intracellular application, of the order of 0.01–0.1 %); (b) the choice of the excitation light bandwidth, and (c) the relatively low intensity of the incident light that could be obtained from a 100 W mercury arc lamp.
Fig. 3.2.
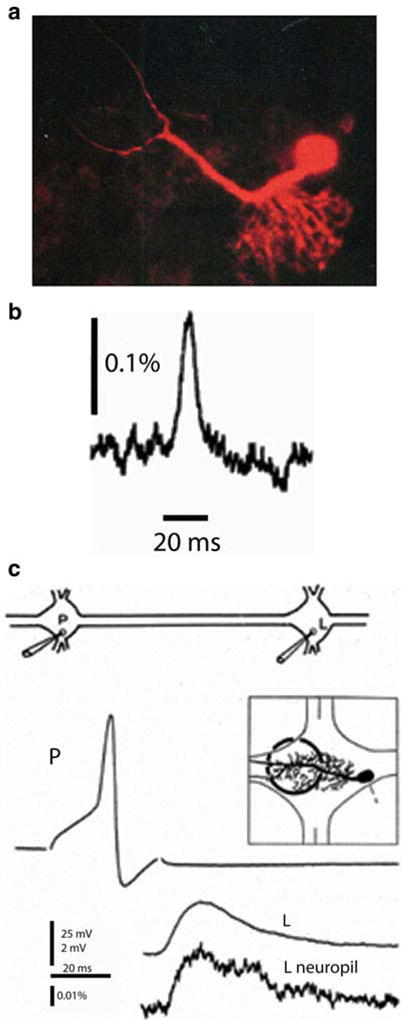
Single photodiode optical recording from a neuron selectively stained by intracellular application of a voltage-sensitive dye. (a) Leech motoneuron following a 20 min iontophoretic injection with the styryl dye, RH-461. The soma, main process and its arborization within the neuropile are all clearly visible. (b) Optical recording of the AP in 175 μm long axonal segment of a P-sensory neuron in the anterior root. 12 trials were averaged. (c) Optical recording of the excitatory postsynaptic potential in the arborization of the L-motorneuron. The experimental arrangement for interganglionic stimulation and recording shown on top. Microelectrode recordings of the presynaptic AP in the P sensory neuron and the postsynaptic potential in the soma of the L motor neuron are shown. The region of the neuropile that was monitored is shown in the inset. The optical recording of the post synaptic potential from the neuropile in the adjacent ganglion is shown at the bottom. Adapted from Grinvald et al. (1987)
At the time, the reported sensitivity was the result of a modest screening effort suggesting that better signals might be obtained by: (a) synthesizing and screening new molecules for higher sensitivity; (b) increasing the concentration of the dye to increase the fluorescence intensity; (c) using an excitation light source capable of providing higher excitation light intensity and better stability and (d) using detector devices with lower dark-noise and adequate spatial and temporal resolution. Following this rationale, the first substantial improvement in the S/N was obtained by finding an intracellular voltage-sensitive dye with sensitivity in intracellular application two orders of magnitude higher than what was previously available. The amino-naphthalene styryl dye JPW1114 synthesized by J. P. Wuskell and L. M. Loew at the University of Connecticut Health Center had the sensitivity expressed as ΔF/F per AP, in intracellular application, of the order of 10 % (Antić and Zecević 1995). The higher sensitivity of this dye translates directly into higher S/N. At this stage, the sensitivity was also improved by using a more powerful excitation light source (Osram, XBO 250 W OFR) powered by a low-noise power supply (Model 1700; Opti-Quip, Highland Mills, NY). The dramatic improvement in sensitivity and the use of 12 × 12 or 24 × 24 element photodiode detector arrays (Centronix, Inc., Newbury Park, CA) allowed simultaneous multiple site monitoring of electrical signals from processes of invertebrate neurons in isolated ganglia (Antic et al. 2000; Antić and Zecević 1995; Zecević 1996). Figure 3.3 shows a diagram of the optical arrangement for epi-fluorescence measurement and a typical multiple site recording from axo-dendritic processes of an individual neuron from the land snail Helix aspersa. This type of recording permitted the analysis of the pattern of initiation and propagation of spikes in neuronal processes and provided direct information about the location and the number of spike trigger zones in a particular nerve cell. Also, it was possible to monitor directly spike propagation failure at axonal branch points (Antic et al. 2000). In all experiments on invertebrate neurons, individual nerve cells in isolated ganglia were observed using wide-field transmission microscopy and selectively stained intracellularly with the voltage-sensitive dye by iontophoresis from beveled sharp electrodes (Obaid et al. 1982; Grinvald et al. 1987; Antić and Zecević 1995).
Fig. 3.3.
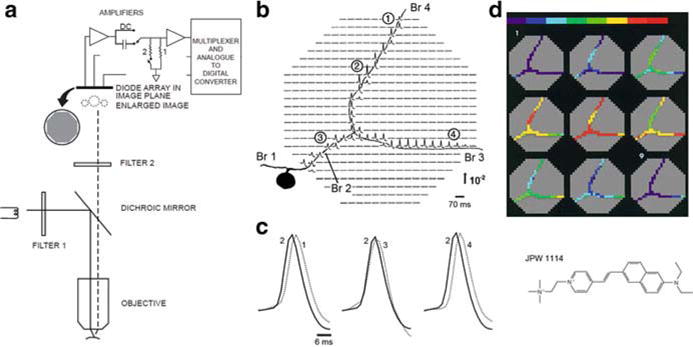
Multiple site optical recording with a photodiode array from a neuron selectively stained by intracellular application of a voltage-sensitive dye. (a) Schematic drawing of the optical apparatus for multiple site epi-fluorescence measurements. The photodiode array was placed at the plane where the objective makes a real, magnified and inverted image. Epi-illumination was provided via a 10×, 0.4 NA, long working distance objective. The preparation was illuminated with the green portion (interference filter 520 × 45 nm) of the output of a 100 W xenon arc lamp. Fluorescence emission from the preparation was selected by means of a dichroic mirror and an appropriate barrier filter (Schott RG610). The output of each detector was amplified individually, filtered, multiplexed, digitized and stored in a computer also used to analyze and display the data. (b) Optical recordings of AP signals from elements of a photodiode array positioned over the image of the axonal arborization of a Helix metacerebral cell from the left cerebral ganglion. The neuron was injected with the voltage-sensitive dye JPW1114 (structural formula shown in lower right panel). Spikes were evoked by transmembrane current pulses delivered through the recording microelectrode in the soma. The cell was depolarized from the resting Vm of −64 mV. Each optical trace represents 70 ms of recording centered on the peak of the spike. The recordings are shown divided by the resting light intensity. The arrow indicates the direction and the stated value of the relative fluorescence change (ΔF/F). Each diode received light from a 50 × 50 μm area in the object plane. A total of 90 trials were averaged to improve the S/N from distal processes. Optical signals were found in the regions of the array that corresponded closely to the geometry of the cell. Data from the detectors that do not receive light from the cell were deleted to improve clarity and allow color-coded display, shown in (d), based on a relative scale applied separately to each trace. (c) AP signals from four different locations indicated in (b) scaled to the same height, are compared on an expanded time scale to determine the site of the origin of the AP and the direction of propagation. (d) Color-coded representation of the data shown in (b) indicating the size and location of the primary spike trigger zone and the pattern of spike propagation. Consecutive frames represent data points that are 1.6 ms apart. Color scale is in relative units with the peak of the AP shown in red. Adapted from Zecević (1996)
The substantial improvement in the sensitivity of optical recording was accompanied by new demands for increased spatial and temporal resolution. Increased resolution, in turn, tended to diminish the S/N. The invertebrate neuron studies described above required spatial and temporal resolution that could only be achieved by using substantial temporal averaging (from 4 to 100 trials) to improve the S/N. In addition, the spatial resolution was limited by the available S/N to about 20–50 μm long sections of axo-dendritic processes. Clearly, further improvements were needed in order to reduce the temporal averaging and increase spatial resolution. The limits to the sensitivity in these measurements were determined primarily by: (a) the sensitivity of the available voltage dyes; (b) the choice of the excitation bandwidth; (c) the maximum excitation light intensity that could be obtained from a 250 W Xenon arc-lamp; and (d) the dark noise of the photodiode array which was the dominant noise at the fluorescence intensities recorded from individual neurons stained by intracellular application of the dye.
3.2.2 Vertebrate Brain Slices
It was of considerable interest to apply Vm-imaging techniques to the dendrites of vertebrate CNS neurons in brain slices. This possibility was first demonstrated with work on layer V neocortical pyramidal neurons (Antic et al. 1999) that established a basic protocol for intracellular labeling of individual nerve cells in slices and described the method for simultaneous optical recording of electrical signals from multiple sites on apical, oblique, and basal dendrites. In these experiments, individual pyramidal neurons in slices were observed using infrared dark-field video microscopy and stained selectively by intracellular application of the voltage-sensitive dye by diffusion from a patch electrode in a whole-cell configuration. The major problem in injecting vertebrate neurons from patch pipettes was leakage of the dye from the electrode into the extracellular medium before the electrode is attached to the neuron. Patching requires pressure to be applied to the electrode during electrode positioning and micromanipulation through the tissue. This pressure ejects solution from the electrode. To avoid extracellular deposition of the dye that binds to the slice and produces large background fluorescence, the tip of the electrode was filled with dye-free solution, and the electrode was backfilled with dye solution. The amount of dye-free solution in the electrode tip and the applied pressure has to be adjusted empirically to ensure that no dye leaks from the electrode before the seal is formed. Usually, no pressure is applied before the electrode enters the slice. Low pressure (10–20 mBar) is used during electrode positioning in the slice, and the final pressure of 50–100 mBar, necessary for cleaning the surface membrane of the cell, is applied immediately (1 s) before the seal formation. Using this method, it was possible to load neurons routinely without increasing the background fluorescence of the surrounding tissue. At the end of a ~1 h diffusion period, the patch pipette was detached and the injected dye was allowed to spread for an additional 2 h before the start of optical recording. Within this time, dye would reach the apical tuft branches in layer I, ~1 mm from the soma. The results of these experiments demonstrated: (a) that loading vertebrate neurons with a voltage-sensitive dye using patch electrodes was possible without contamination of the extracellular environment; (b) that brain slices did not show significant autofluorescence at the excitation/emission wavelengths used (in contrast with the experience of Grinvald et al. (1987)); (c) that pharmacological effects of the dye were completely reversible; (d) that the level of photodynamic damage was low enough to permit meaningful measurements and could be reduced further; and (e) that the sensitivity of optical recording with a 464 element photodiode array was comparable to that reported for invertebrate neurons. At this level of sensitivity, however, modest temporal averaging in recording AP signals was still required, and spatial resolution was limited by the available S/N to approximately 20 μm long sections of dendritic processes (Antic et al. 1999). The limits to the S/N in these initial measurements from vertebrate neurons were determined by the same factors as described above for invertebrate preparations.
3.2.3 Improvement in Sensitivity with CCD Cameras
The second significant improvement in recording sensitivity in measurements from individual nerve cells (after the synthesis of a dye far more suitable for intracellular application) was the introduction of a cooled, back-illuminated CCD camera in place of the 464-element diode array. Fluorescence measurements from individual neurons have a lower range of intensities (with correspondingly lower absolute amplitude of the shot noise) so that the dominant noise, in recordings with a 464-diode array, was the relatively large dark noise of the amplifier-photodiode circuit. Thus, the dark noise of the photodiode array limited the detection system sensitivity, rendering it significantly lower than the theoretically attainable shot noise limit. It was then realized that in this range of illumination intensities (from 5 × 10³ to 5 × 10⁶ photons/ms) the CCD camera can approach the ideal (shot noise limited) sensitivity (Wu et al. 1999) (see also Chap. 1). The back illuminated CCD camera, because it is cooled and can have about 1,000 times smaller pixel surface area and proportionally smaller dark currents compared to available diode arrays, exhibits substantially lower dark noise. Test measurements performed at low light level (Wu, Cohen and Zecevic, unpublished observations), established that a particular cooled CCD camera (FastOne, Pixel Vision Inc., Beaverton, OR) improved the sensitivity by a factor of approximately 20 (Fig. 3.4a). The upper trace in Fig. 3.4a shows the recording of a step change in light intensity adjusted in amplitude to be at the limit of resolution (S/N=1) for the photodiode array. The lower trace is the recording of the same steps using the high-speed, cooled CCD camera. This result is a demonstration of the remarkable improvement in S/N resulting from the large reduction in dark noise.
Fig. 3.4.
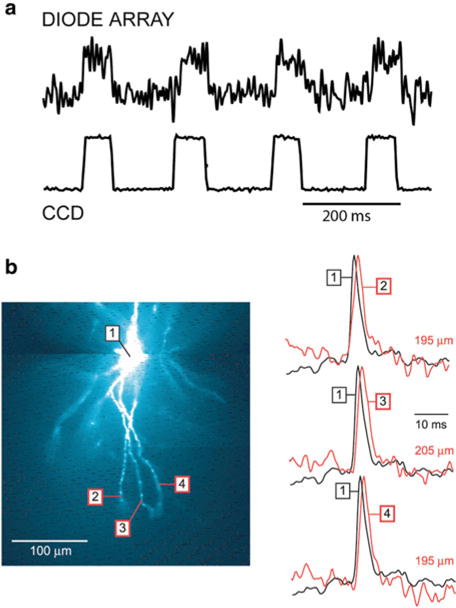
Optical detectors for voltage-sensitive dye recordings. (a) The performance of a 464-element photodiode array and a cooled back-illuminated CCD camera are compared directly using the same preparation. The measurements were done at a relatively low resting light level, comparable to the resting fluorescence intensity in recordings from processes of selectively stained individual neurons. Upper trace: recording of a step change in light intensity adjusted in amplitude to be at the limit of resolution (S/N ≈ 1) for the photodiode array. Lower trace: the recording of the same signals using the high-speed, cooled CCD camera. The improvement in the S/N ratio by a factor of approximately 20 is attributable to the large reduction in dark noise. (b) AP signals in distal segments of basal dendrites of a pyramidal neuron obtained with a cooled CCD camera. A composite fluorescence image of a layer V pyramidal neuron in recording position shown on the left. Optical signals from distal dendritic segments at distances larger than 180 mm, as indicated, shown on the right. Each trace is the product of temporal (four trials) and spatial (6–9 pixels) averaging. Adapted from Antic (2003)
The increase in sensitivity with the introduction of advanced CCD cameras allowed, for the first time, recording of the spatial and temporal dynamics of electrical events in thin, distal dendritic processes that cannot be probed with conventional patch-electrode techniques. The optical approach made possible simultaneous measurements of the Vm transients in basal and oblique dendrites of pyramidal neurons during single APs and trains of APs (Fig. 3.4b; (Antic 2003)), as well as the analysis of synaptic potential initiation and spread in terminal dendrites of the glomerular tuft of individual mitral cells in the olfactory bulb slice (Djurisic et al. 2004).
The optical measurements from basal dendrites (Antic 2003) provided unique evidence that, in contrast to apical dendrites, basal and oblique dendritic processes impose modest amplitude and time course modulation on the backpropagating AP (bAP) and are robustly invaded by the somatic spike even when somatic firing rates reach 40 Hz (Fig. 3.4b). A compartmental model incorporating AP peak latencies and half-widths obtained from optical measurements indicated that the specific intracellular resistance ( Ri) is less than 100 Ω cm. The data obtained simultaneously from multiple dendritic sites and subsequently linked to a numerical simulation, revealed that all synaptic locations along basal and oblique dendrites, situated within 200 μm of the soma, experience strong and near-simultaneous (latency < 1 ms) voltage transients during somatic firing (Antic 2003; Zhou et al. 2008). The continuation of these studies (Acker and Antic 2009) demonstrated that dendritic multi-site voltage sensitive dye recordings can be combined with pharmacological manipulations of membrane excitability to test and optimize multicompartmental numerical simulations. For example, the bAPs in basal dendrites have been monitored before and after blocking the voltage gated sodium channels with tetrodotoxin (TTX), or blocking A-type potassium channels with 4-Aminopyridine, in order to determine the contribution of each membrane conductance to the dendritic AP signal (Acker and Antic 2009).
Experiments on mitral cells (Djurisic et al. 2004) showed that optical data can be used to measure the amplitude and shape of subthreshold excitatory postsynaptic potentials (EPSPs) evoked by olfactory nerve stimulation at the site of origin (glomerular tuft) and to determine its attenuation along the entire length of the primary dendrite. In addition, direct evidence was provided for the number, location, and stability of spike trigger zones, the excitability of terminal dendritic branches, and the pattern and nature of spike initiation and propagation in the primary and secondary dendrites. In a subsequent study (Djurisic et al. 2008), Vm-imaging was used to analyze the electrical properties and the functional organization of the terminal dendritic tuft, which was not accessible to standard electrode recordings (for single site patch-electrode recordings from small dendritic branches see (Nevian et al. 2007; Larkum et al. 2009)). Optical recording provided direct evidence that the dendritic tuft functions as a single electrical compartment for subthreshold signals within the range of amplitudes detectable by voltage-sensitive dye recording. Figure 3.5 illustrates the sensitivity of multiple site optical recordings of AP related signals and subthreshold, EPSP signals from mitral cell tuft dendrites in wide-field epi-fluorescence mode. With this approach, it was possible to record AP signals at a frame rate of 2 kHz in single trial recordings from ~4 μm long sections of terminal dendritic branches less than 1 μm in diameter. As shown in the figure, the modest S/N obtained in single-trial, single-pixel measurements could be further improved by spatial and temporal averaging. A representative optical recording of EPSPs from the site of origin on glomerular dendritic branches is shown in Fig. 3.6. These experiments demonstrated that, at the spatial scale of dendritic processes, 3–5 mV synaptic potentials can be resolved optically in single-trial recordings. The relatively weak S/N in measurements of small, subthreshold Vm transients could be improved by modest temporal averaging (4–9 trials).
Fig. 3.5.
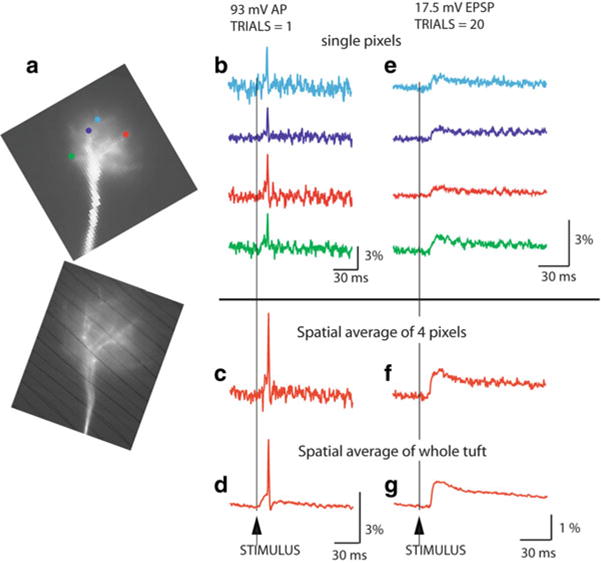
Sensitivity of voltage imaging with low noise CCD camera in recordings from the apical dendritic tuft of a mitral cell of the olfactory bulb. (a) Low resolution ( top) and high resolution ( bottom) fluorescence images of the terminal dendritic tuft in recording position. (b) Recordings of AP signals from four individual pixels receiving light from four 3.7 × 3.7 μm locations on the dendritic tuft. (c) The S/N ratio with spatial averaging of four pixels marked in (b). (d) The S/N ratio with spatial averaging of the entire tuft area. (e) An evoked EPSP recorded from four individual locations on the dendritic tuft; 20 trials averaged. (f) Spatial average of signals shown in (e). (g) Spatial average of the entire tuft area. Adapted from Djurisic et al. (2004)
Fig. 3.6.
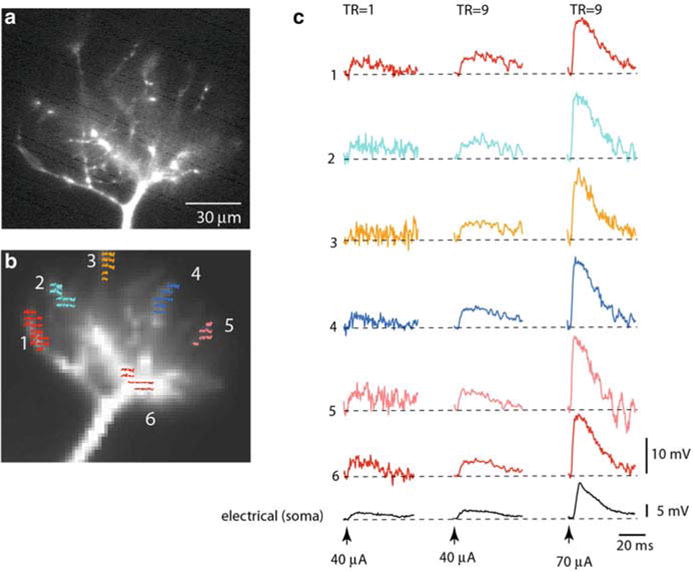
Spatial distribution of subthreshold EPSP signals is uniform in thin terminal dendritic branches of a mitral cell dendritic tuft. (a, b) Fluorescence image of a mitral cell tuft obtained with a conventional high-resolution CCD (a) and with a fast, low-resolution (80 × 80 pixels) CCD used for voltage imaging (b). Six color-coded recording locations indicated on the image in (b) correspond to traces shown in (c). (c) Trace display of Vm signals. Traces are spatial averages of colored pixels. Bottom black traces, electrical recordings from soma. Left traces: Single-trial recordings of the small EPSP signal are at the limit of amplitude resolution. Middle traces: Nine averages of the small EPSP signals shown on the left improved the S/N ratio. Right traces: Nine averages of the EPSP four times larger in amplitude. Adapted from Djurisic et al. (2008)
The same methodology based on the use of high-speed, low read noise CCD camera (FastOne, Pixel Vision Inc., Beaverton, Oregon or NeuroCCD-SM, RedShirtImaging LLC, Decatur, Georgia), has been applied to the analysis of dendritic signals from rat hippocampal CA1 pyramidal neurons during coincident pre- and post-synaptic activity using combined voltage- and calcium-imaging from neurons labeled with two indicators (see Chap. 4 and (Canepari et al. 2007)). The combined imaging technique was also applied to the analysis of dendritic Vm and Ca2+ signals associated with parallel fiber and climbing fiber stimulation in cerebellar Purkinje neurons (Chap. 4 and (Canepari and Vogt 2008)), as well as to the study of the correlation between dendritic electrical transients (plateau potentials) and dendritic calcium signals during suprathreshold glutamatergic synaptic input (Milojkovic et al. 2007). In addition, using exactly the same recording apparatus and protocols, similar spatial resolution was reported in recordings from axons and basal dendrites of layer 5 pyramidal neurons (Palmer and Stuart 2006; Kampa et al. 2006). However, in these studies, a significantly lower range of excitation light intensities was utilized, reducing the S/N significantly. The loss in sensitivity was compensated by extensive temporal averaging, which is only possible at reduced light intensity because of reduced photodynamic damage.
The studies described above documented that Vm-imaging is quite efficient at the spatial scale of dendritic branches. Clearly, the sensitivity was adequate to monitor suprathreshold, regenerative AP signals (Figs. 3.3, 3.4, and 3.5) as well as subthreshold, synaptic input signals (Fig. 3.6) from multiple sites on dendritic processes. The available S/N, however, was not adequate to allow multisite recordings from thin axons and axon collaterals at high frame rates (5–10 kHz) without extensive averaging (> 100 trials). Such high frame rates are required for monitoring fast axonal APs at physiological temperature. In addition, it was still not possible to monitor Vm signals at the higher optical magnification and finer spatial scale necessary for resolving electrical events at the level of individual dendritic spines. Clearly, further improvements in sensitivity were needed.
3.2.4 Improvements in Sensitivity with Monochromatic, Laser Light Excitation
A possible approach toward achieving high speed multiple site optical recordings of membrane voltage from axons and axonal collaterals as well as from individual dendritic spines in brain slices is wide-field epi-fluorescence microscopy applied at high optical magnification. Several alternative optical approaches to Vm-imaging are also available; these will be discussed in Sect. 3.2.5 below.
The limited sensitivity of available epi-fluorescence Vm-imaging methods required extensive averaging (> 100 trials) in recording fast axonal AP signals because these recordings necessitate high frame rates (10 kHz) (Palmer and Stuart 2006). Similar low sensitivity is obtained in recording signals from individual dendritic spines because an order of magnitude higher optical magnification is required to resolve spines (Palmer and Stuart 2009). Because extensive averaging (> 100 trials) makes most physiologically relevant experiments very difficult or impossible, a substantial improvement, by a factor of 10–100, in the sensitivity was desirable.
Within the constraints imposed by Eq. (3.1), one way to increase the S/N with a given voltage-sensitive dye is to increase the photon flux (Φ) by increasing the excitation light intensity. Another possibility is to increase the fractional fluorescence change per unit change in Vm (sensitivity of the dye) by choosing the optimal excitation wavelength. Following this rationale, Holthoff et al. (2010) used one of the most sensitive voltage-sensitive dyes in terms of S/N (JPW3028; (Djurisic et al. 2004; Zhou et al. 2008; Acker and Antic 2009)), and improved both the excitation (and, hence, emission) light intensity and the relative fluorescence change in response to Vm change by utilizing a laser as an illumination source in wide-field epi-fluorescence microscopy mode (Holthoff et al. 2010). In measurements from layer 5 pyramidal neurons in rat visual cortex slices, the light from a frequency-doubled 200 mW diode-pumped Nd:YVO4 continuous wave (CW) laser emitting at 532 nm (Excelsior 532 single mode; Newport-Spectra-Physics, Mountain View, CA) was directed to a quartz optical fiber (TILL Photonics GmbH, Gräfelfing, Germany) coupled to the microscope via a single-port epi-fluorescence condenser (TILL Photonics) designed to overfill the back aperture of the objective. In this way, approximately uniform illumination of the object plane was attained. Figure 3.7 depicts the experimental set-up schematically. A stationary stage upright microscope (Model BX51WI Olympus Inc, Japan) equipped with three camera ports was used in these experiments. One camera port had a standard, high spatial resolution CCD camera for infrared DIC video-microscopy (CCD-300-RC, Dage-MTI, Michigan City, IN). The second camera port had a fast data acquisition camera (up to 20,000 frames/s) with relatively low spatial resolution (80 × 80 pixels) but outstanding dynamic range (14 bits) and exceptionally low read noise (NeuroCCD-SM, RedShirtImaging LLC, Decatur, GA). The third camera port had a CCD camera with high spatial resolution (1,392 × 1,024 pixels; Pixelfly-qe, PCO Imaging, Kelheim, Germany) mounted on a Yokogawa spinning-disc confocal scanner used to collect z-stacks of confocal images for detailed morphological reconstruction of the stained cell. The fractional amplitude noise in low-noise solid-state lasers (< 0.2 %) did not interfere with recording sensitivity because it was below the typical fractional shot-noise in fluorescence voltage-sensitive dye recordings (Iwasato et al. 2000; Matsukawa et al. 2003; Zhou et al. 2008). The excitation light was reflected to the preparation by a dichroic mirror having a central wavelength of 560 nm, and the fluorescence emission was passed through a 600 nm barrier filter (a Schott RG600). Imaging was performed with a low-noise high-speed CCD camera.
Fig. 3.7.
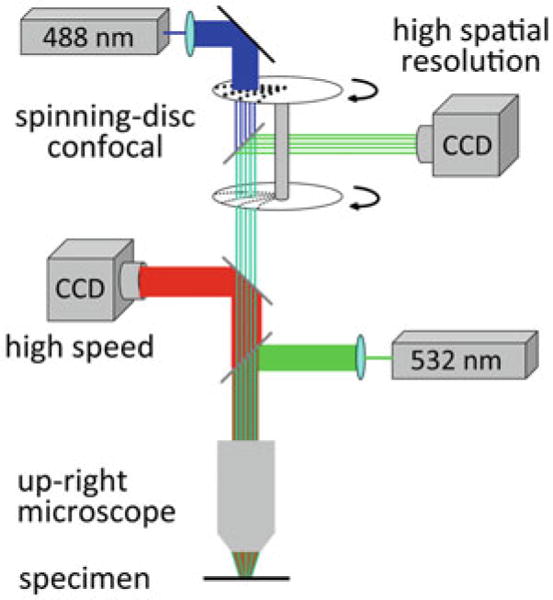
Experimental setup for voltage-imaging from dendritic spines in cortical brain slices. The voltage-sensitive dye was excited using a 532 nm solid-state laser in wide-field illumination mode. Emission light was recorded with a high-speed CCD-camera. A spinning-disc confocal scanner with 488 nm laser was utilized for morphological reconstruction. Adapted from Holthoff et al. (2010)
With this apparatus, a series of control experiments were designed to test three critical methodological parameters: (a) improvement in the S/N; (b) the extent of photodynamic damage at the required excitation light intensity; (c) the limits to the spatial resolution as determined by light scattering in wide-field epi-fluorescence measurements. Robust and unambiguously favorable results were obtained regarding all three parameters (see below). Following these initial measurements, further experiments were carried out to characterize bAP signals in dendrites and spines.
As described above (Fig. 3.7) imaging was performed with a high-speed CCD camera. Neurons with easily discernible dendrites were loaded from a patch-pipette with the voltage-sensitive dye JPW3028. Figure 3.8b shows a composite fluorescence image of a pyramidal neuron labelled with the voltage-sensitive dye.
Fig. 3.8.
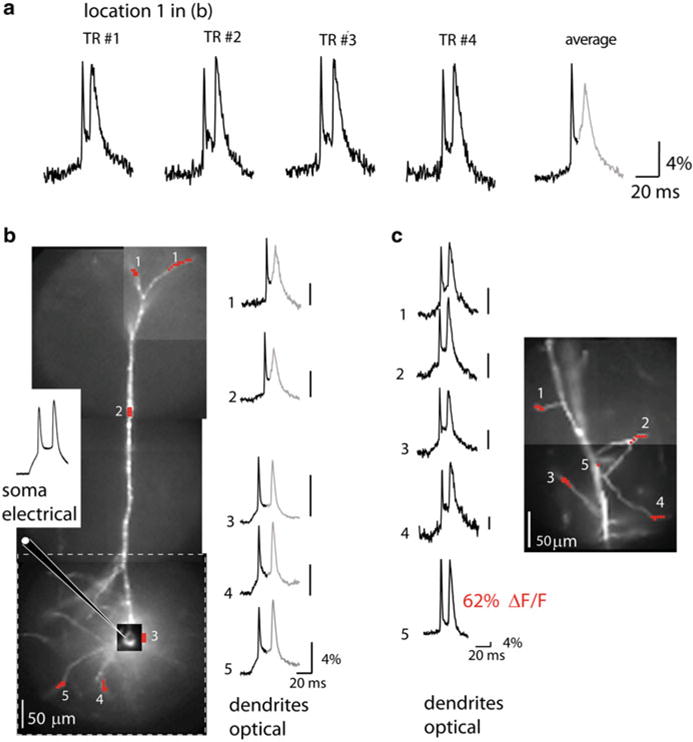
Dendritic bAP signals in apical, basal and oblique dendrites. (a) The bAP signals from the apical terminal tuft 700 μm from the soma (spatial average from location 1 in b). Single-trial recordings and a temporal average of four trials illustrate the sensitivity of recording (S/N ~ 15 and 30 respectively). (b) A composite fluorescence image of a pyramidal neuron. The size of the full frame imaging region is outlined by dashed-line rectangle. Traces on the right are temporal averages of four trials and spatial averages from locations 1 to 5 indicated on the image. The peak of the first bAP was used as a reference point for averaging. Consequently, the second spike shown in gray did not average coherently because of temporal jitter. The electrode recording from the soma is on the left. (c) A composite fluorescence image of a dendritic region from another neuron with several oblique dendrites in focus for voltage-imaging. Single-trial recordings on the left are spatial averages from locations 1 to 4 indicated on the image. Adapted from Holthoff et al. (2010)
Improved Vm-Imaging from Dendritic Branches
In the initial series of experiments, the extent of propagation and the time course of bAP signals were monitored from dendrites at relatively low magnification (the full CCD frame (80 × 80 pixels) corresponded to a 300 × 300 μm area in the object plane). At this magnification the dendritic spines could not be resolved even in principle because their image was smaller than individual pixels. Before optical measurements, the dye-loaded pyramidal neurons were re-patched with a dye-free pipette (Fig. 3.8b). Spikes were elicited by depolarizing current pulses delivered from a patch electrode in the soma and bAPs recorded optically from various dendritic compartments covering the entire dendritic tree (Fig. 3.8a–c). The recordings from different areas were obtained by sequentially repositioning the field of view. As indicated in the figure, at all dendritic sites, including the terminal apical tuft (Fig. 3.8a) as well as the oblique (Fig. 3.8c) and the basal dendrites (Fig. 3.8b), bAPs could be monitored with unprecedented sensitivity by the voltage probe JPW3028 at the laser excitation wavelength of 532 nm in single-trial measurements. The combined effect of an increase in light intensity and the use of a near optimal excitation wavelength was a dramatic improvement in the sensitivity of voltage imaging by a factor that varied from 10 to 50 in recording from different sites on neuronal processes. The single-trial signals (no averaging) from some of the individual pixels (Fig. 3.8c, location 5) yielded fractional fluorescence changes of about 60 % recorded with the S/N of approximately 50. The sensitivity of these measurements is the largest ever obtained from individual nerve cells in slices. Clearly, the amplitude of ΔF/F signals corresponding to the back-propagating spikes varied widely at different locations. This variability corroborates the earlier findings (Djurisic et al. 2004; Canepari et al. 2007) that the sensitivity of the optical measurements from different dendritic regions is not uniform. The sensitivity varied because the ratio of the dye bound to the plasma membrane that changes potential to the dye bound to intracellular membranes varies between different regions on the dendritic arbor as a function of many factors that cannot be determined accurately, including the surface to volume ratio and the amount of intracellular membranes (see Chap. 4 and (Canepari et al. 2008) for more detailed explanation on dye signal calibration). A small number of dendritic regions exhibited extremely large fractional changes (e.g. location 5 in Fig. 3.8c). This result suggest that the intrinsic voltage sensitivity of the dye is very high closely approaching the theoretical sensitivity limit for charge-shift probes excited by a wavelength close to the extreme red edge of the absorption spectrum (Kuhn et al. 2004). The simplest explanation for the large optical signals recorded from a small subset of dendritic regions is that the fluorescence from these sites was largely dominated by the dye bound to the plasma membrane, possibly because of a favorable surface-to-volume ratio and the absence of internal membranes at these locations. Apart from these sites, the optical signals related to bAP from most of dendritic regions were in the range of 10–20 %.
Improved Vm-Imaging from Axons
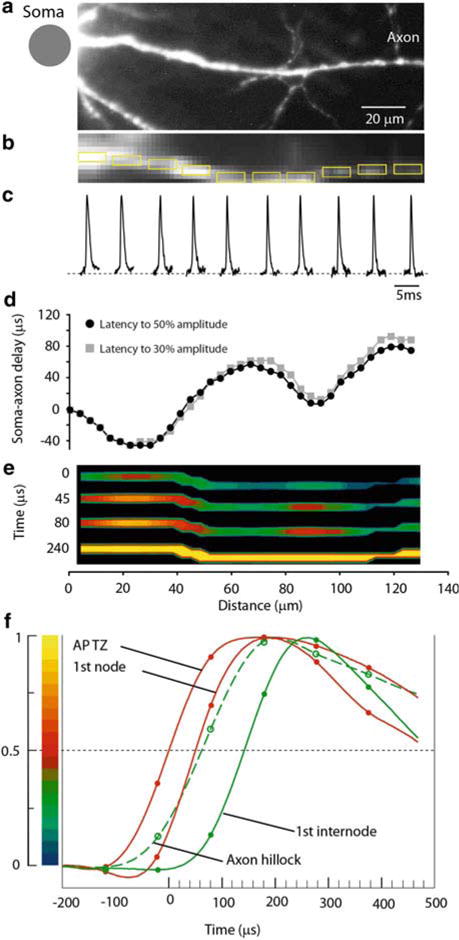
Another series of experiments was carried out at the same optical magnification to utilize the improved sensitivity of the voltage-imaging technique in the analysis of electrical events in individual axons. Recent experimental and theoretical data (Shu et al. 2007; Bennett and Muschol 2009) indicate that the functional capabilities of axons are much more diverse than traditionally thought. Consequently, the field of axonal physiology is rapidly expanding. At the same time, the traditional tools for analyzing axonal signaling were limited to single site electrode recordings from the cut end of axons. Clearly, new tools to gain a better understanding of signal integration in axonal processes are critical. The first successful attempt to monitor optically AP signals from multiple sites on the axon of a pyramidal neuron (Palmer and Stuart 2006) clearly demonstrated advantages of Vm-imaging by providing direct evidence on the approximate location of the spike initiation site in a vertebrate nerve cell (Fig. 3.9). The sensitivity of these recordings was limited by the amount of light that can be obtained from a 100 W tungsten-halogen bulb as well as by the choice of less favorable wavelengths of the excitation light. Thus, extensive signal averaging (> 100 trials) was required to obtain useful information. This amount of averaging makes experiments difficult and prone to errors. A significant improvement in sensitivity brought about by laser excitation facilitated further studies. By using those improvements in imaging technique that provided exceptional temporal resolution, it was possible to analyze the individual Purkinje neurons and resolve the region of spike initiation as well as follow spike propagation into axon collaterals for each action potential initiated in single trials (Fig. 3.10). The results of this study demonstrated that the axon initial segment is a critical decision point in Purkinje cell processing and that the properties of axon branch points are adjusted to maintain faithful transmission (Foust et al. 2010). In another study focused on layer V pyramidal neurons (Popovic et al. 2011), the authors utilized the same refinements of dye-based measurements to elucidate the behavior of cortical pyramidal cell axons and their small, branched collaterals. Figure 3.11 illustrates how multiple site optical recording was used to directly determine the location and length of the spike trigger zone (TZ) as defined in functional terms. The results show that in mature axons of mouse cortical layer 5 pyramidal cells, action potentials initiate in a region ~20 μm in length centered in the axon initial segment between 20 and 40 μm from the soma. From this region, the AP depolarizing wave invades initial nodes of Ranvier within a fraction of a millisecond and propagates in a saltatory fashion into axonal collaterals without failure at all physiologically relevant frequencies. Optical signal processing that was utilized to generate the kind of results described above is illustrated in Fig. 3.12. More detailed explanation of the limits to spatiotemporal resolution is given below.
Fig. 3.9.
High-speed recording of AP signals from axons of a cortical pyramidal neuron. High-magnification image of the axon of a layer 5 neocortical pyramidal neuron filled with voltage-sensitive dye. Average fluorescence change of 130 individually aligned APs recorded from indicated axonal locations at a frame rate of 10 kHz. APs were evoked by somatic current injection
Fig. 3.10.
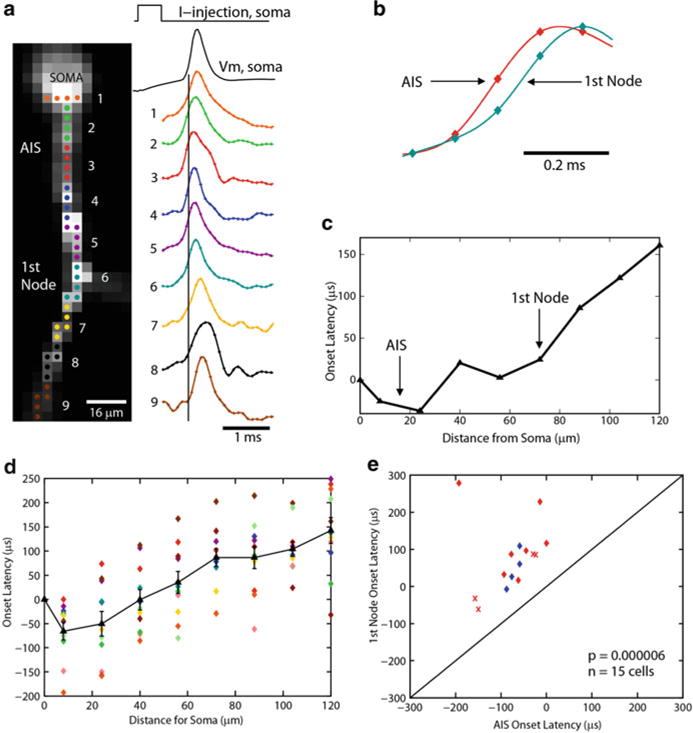
APs initiate in the Purkinje cell axon initial segment. (a) Voltage-sensitive dye fluorescence image of the soma–axon region in recording position shown on the left. Traces on the right, Single-trial recordings of AP signals, initiated by somatic current injection, from nine locations indicated on the image. Each trace is a spatial average of four to five same-color pixels. Signals are scaled to the same peak height. The symbols represent actual data points; the solid lines are reconstructed signals using cubic spline interpolation. The vertical line denotes the time at half-maximum amplitude at the edge of the soma (location 1). Note that the AIS segment traces ( green and red) initiate the action potential first. (b) AP recordings from the AIS and the first node of Ranvier scaled to the same height and compared on an expanded timescale. (c) The time to half-maximum amplitude subtracted from the time at half-max for the edge of the soma (“onset latency”) as a function of distance from the soma. (d) Group data (n=15) illustrating the level of consistency in the spatial localization of spike onset and the spike propagation velocity across cells. Error bars indicate SEM. (e) Group data statistics. The onset latency is lowest in the axon initial segment, and in all cells preceded the spike in the first node of Ranvier (p=0.000006; n=15). The diagonal line represents equity. The diamonds represent spikes initiated with a current pulse. The data obtained from spontaneous spikes are indicated by crosses. The data in red was obtained at 35 °C, whereas the data in blue was obtained at 23 °C
Fig. 3.11.
Measurement of the spatial distribution of membrane potential as a function of time along the proximal axon during AP initiation. (a) High resolution confocal image of the axon in recording position. (b) Low spatial resolution fluorescence image of the axon obtained by CCD used for Vm imaging. (c) AP signals from ten locations indicated by yellow rectangles, each 10 μm in length. (d) Soma–axon latency to 30 % ( grey) and 50 % ( black) AP amplitude as a function of distance from the cell body. The first minimum identifies the location and length of the spike TZ. (e) Time sequence of frames showing spatial profile of color coded relative Vm amplitude in the axon at four characteristic time points: 0 μs—AP initiation at TZ; 45 and 80 μs—invasion of the first node; 240 μs—peak depolarization. (f) Comparison of AP signals from four characteristic locations on an expanded time scale. The measured data points and cubic spline interpolation curves are shown. Red traces—TZ and first node; green dashed trace—axon hillock; green trace—first internodal region. Membrane potential color scale shown on left
Fig. 3.12.
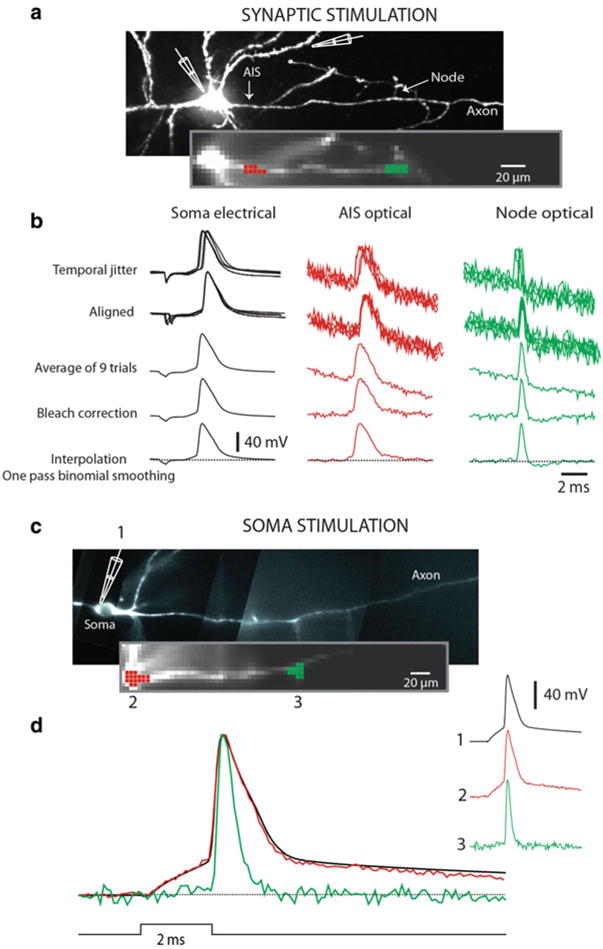
Signal processing. (a) Synaptic stimulation. Upper image, high resolution confocal image of a stained neuron with axon in recording position. Recording electrode attached to soma and stimulating electrode next to basal dendrite shown schematically. Lower image, low spatial resolution fluorescence image of the axon obtained by CCD used for Vm imaging. (b) electrode recordings from soma, optical recordings from spike TZ ( red), and from node of Ranvier ( green). Top traces: row data from nine trials showing temporal jitter in AP initiation following synaptic activation. Second row of traces: temporally aligned signals. Third row of traces: averaged signal. Fourth row of traces: bleach correction. Bottom traces: cubic spline interpolation with one pass of temporal smoothing. (c) Somatic stimulation. Upper image, high resolution confocal image of another neuron with axon in recording position. Lower image, low spatial resolution fluorescence image of the axon obtained by CCD used for Vm imaging. Traces on right: AP transients from three locations: 1-electrode recording from soma; 2-optical recording from axon hillock; 3-optical recording from the first node of Ranvier. Bottom traces: superimposed signal from same three locations
How accurate are optical measurements of fast electrical events? The accuracy of these measurements is a function of the available sensitivity of Vm imaging which is, in turn, a function of both spatial and temporal resolution. Thus, these parameters have to be considered in every particular study. For example, it is known that the initiation of the AP in the sub-region of the axonal initial segment (AIS) and its propagation to the first node of Ranvier is accomplished in less than 100 μs in layer-5 pyramidal neurons (Palmer and Stuart 2006) and in Purkinje cells (Foust et al. 2010). It is also known from electrode measurements that accurate recording of the fastest frequency components of the axonal AP (maximum dV/dt of 1,100–1,200 V/s at 32–37 °C) requires sampling rates of 20–80 kHz. Further increase in the sampling rate gave similar results (Yu et al. 2008). While this range of sampling frequencies are difficult to realize in optical recordings because of limited sensitivity, it was possible to effectively apply a frame rate of 10 kHz (Foust et al. 2010; Popovic et al. 2011). These studies demonstrated that the filtering effect of insufficiently high sampling rate had a very small effect on determining soma–axon delays used to establish the location and length of the spike TZ. In other words, it was possible to assume that the AP waveform reconstructed by cubic spline interpolation from the data obtained at a sampling rate of 10 kHz is an adequate approximation of the true AP shape for the purpose of measuring soma-axon delays. Thus, the reconstructed waveform was treated as an analog signal that has a known value at all times and the continuous cubic spline interpolation curve, re-sampled at 100 kHz, was used to characterize timing information with a temporal resolution of 10 μs.
The necessary spatial resolution is dictated by the anticipated length of the spike TZ. The average length of the AIS has been determined to be ~40–50 μm (Palmer and Stuart 2006). The length of the spike TZ defined in functional terms has been unknown because there have been no direct recordings of this parameter. A plausible prediction for the length of the TZ based on structural studies as well as from modelling is in the range of 10–40 μm (Hu et al. 2009). In the experiment shown in Fig. 3.11 the optical magnification was adjusted so that 1 pixel of the CCD used for Vm imaging received light from a surface area of ~4 × 4 μm in the object plane. Next, one has to consider the sensitivity (amplitude resolution) of the optical measurement at the spatiotemporal resolution described above (10 μs; 4 μm). First, it is necessary to take into account relevant Vm changes during AP initiation that are likely to occur at the temporal scale on the order of 10 μs. The steepest slope (dV/dt) of the AP upstroke measured optically at 32–34 °C, was ~400–550 mV/ms in the soma and ~550–700 mV/ms in the axon (Popovic et al. 2011). The slope of the axonal AP upstroke signal indicates that the membrane potential will change by ~5–7 mV in 10 μs during a maximum rate of depolarization. Thus, a meaningful optical readout of Vm transients with a temporal resolution of 10 μs requires that the sensitivity of optical recording (expressed as the S/N) is sufficient to reliably resolve Vm changes of this magnitude. Figure 3.13 addresses this question. In the measurement shown in Fig. 3.13c, AP signals were recorded optically from an axonal region 4 μm in length. The trace on the left is a temporal average of optical data from four trials characterized by a S/N of 7. The middle trace is a temporal average of 16 trials characterized by an increase in sensitivity by a factor of 2 (S/N=14). The noise in the signal can cause an error in the measurement of the time of the transition to a given signal amplitude. Figure 3.13c illustrates that this error was negligible. The slow noise of relatively small amplitude recorded at the resting membrane potential did not have a significant effect on amplitude measurement during the most rapidly changing phase of the signal. Thus, the measurements of AP initiation in the axon were limited to the spatial resolution of 4 μm, temporal resolution of 10 μs and amplitude resolution of 4 mV. It was necessary to employ modest temporal averaging (4–25 trials) to attain this sensitivity in different experiments, depending on the level of intracellular staining and on axon location relative to the surface of the slice. It is noteworthy that temporal averaging has strict limitations. Because the S/N increases with the square root of the number of trials averaged, it is possible to improve the sensitivity by a factor of 2–5 (by averaging 4–25 trials) without significant difficulties. Further improvement in the sensitivity, however by a factor of only 2, would require extensive averaging (> 100 trials), which is not easily realizable because of the preparation run-down with time and because repetitive exposure to high-intensity excitation light results in photodynamic damage.
Fig. 3.13.
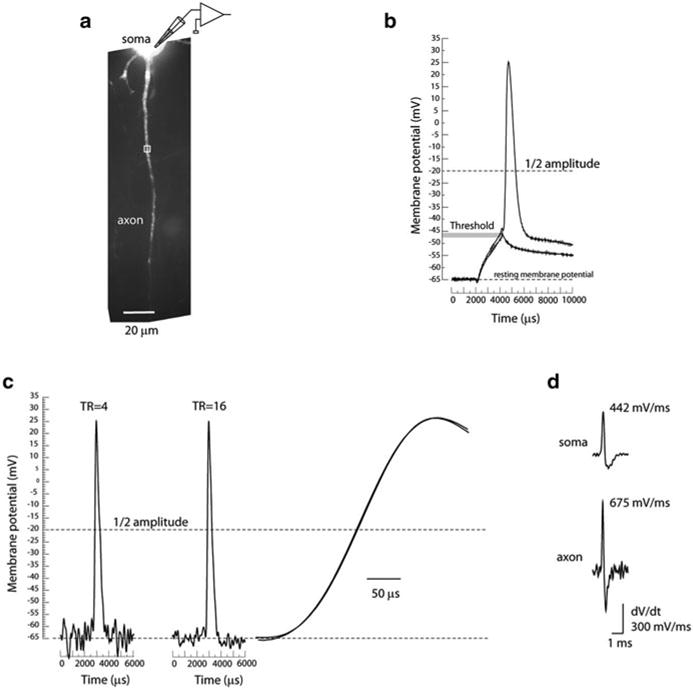
Spatiotemporal resolution and recording sensitivity. (a) Fluorescence confocal image of a dye loaded pyramidal neuron with proximal axon in recording position. (b) The size and shape of the AP recorded from the soma of layer 5 pyramidal neuron at 34 °C. (c) Optical recording of AP related signal from axonal region 4 μm in length indicated by white rectangle in (a). Left trace, average of four trials. Middle trace, average of 16 trials. Right trace, superimposed upstroke of the two AP signals on expanded time scale. (d) First derivative (dV/dt) of the somatic and axonal AP
The same recording technology can be used to analyze the spatial pattern of AP propagation as revealed by monitoring transmembrane potential over longer sections of individual myelinated axons. Previously, this information was not available for any neuron. A representative experiment is illustrated in Fig. 3.14. The spatial plot of the soma–axon latency along an axonal section of approximately 300 μm clearly identified the position of the spike TZ and putative nodes of Ranvier, all characterized by localized reduction in soma–axon latency typical for saltatory conduction (Fig. 3.14a). It is likely that the internodal regions, invaded by the depolarizing wave with a delay, were myelinated. The spatial plot of AP latency provides a functional readout for the position of the nodes of Ranvier. Figure 3.14b shows the initiation and the propagation of an AP as revealed by a time sequence of the colour-coded spatial maps of the depolarizing AP wave. The time sequence of spatial maps shows the colour coded representation of the relative Vm amplitude on the y-axes (omitted for clarity) at five characteristic points in time—spike initiation at time 0, the gradual invasion of the three putative nodes of Ranvier during the following 90 μs, and the peak depolarization at 360 μs. It is noteworthy that the entire section of the axon, about 300 μm in length, is invaded by the peak of the AP depolarization wave within a fraction of a millisecond from the time the Vm threshold for excitation was reached. Figure 3.14c, d illustrates the clear correlation between the positions of the putative nodes of Ranvier determined by functional imaging with anatomical data showing axonal regions that give rise to collaterals. This same approach has the unique potential to directly address questions of action potential fidelity which cannot be probed by conventional electrophysiological techniques. Figure 3.15 illustrates a successful propagation of a train of 15 APs evoked at the frequency of 400 Hz. In this work (Popovic et al. 2011) optical recordings of a total of 1,770 APs from the main axon and collaterals revealed that the propagation of APs was reliable for all frequencies of firing supported by the spike TZ. These measurements established that the superior sensitivity of wide field laser-excitation epi-fluorescence recordings permit Vm-imaging from the axonal arbor, including small diameter axon collaterals, with high temporal and spatial resolution.
Fig. 3.14.
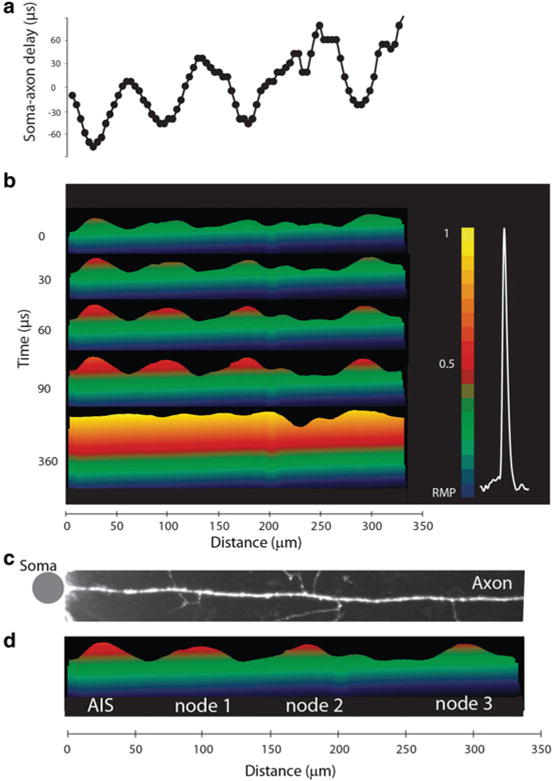
Spatial pattern of AP initiation and propagation in an individual axon. (a) Soma–axon latency to 50 % AP amplitude as a function of distance from the soma. (b) Time sequence of frames showing spatial profile of colour coded relative Vm amplitude in the axon at five characteristic points in time: 0 μs—AP initiation at TZ; 30, 60 and 90 μs—invasion of the nodes; 360 μs—the peak depolarization. Membrane potential color scale shown on right. (c, d) Alignment of image of the axon, showing axonal collaterals, and membrane potential changes at spike initiation. Note that each point of issuance of an axon collateral appears functionally to be a node of Ranvier. Grey dot denotes the location of the soma
Fig. 3.15.

Reliability of AP propagation in the axonal arbor. (a) A schematic representation of the axonal arbour reconstructed from a confocal image of a L5 pyramidal neuron loaded with the voltage-sensitive dye. Seven recording locations on the main axon and several collaterals are indicated by blue and red rectangles. (b) A typical optical recordings of a train of APs evoked at 400 Hz from multiple locations on the axonal arbor. No evidence for AP failures was found
Improved Vm-Imaging of bAPs from Dendritic Spines
The high sensitivity of recording from dendrites and axons at relatively low optical magnification described above indicated that it should be possible to increase the optical magnification by a factor of 10 and monitor Vm-transients from individual dendritic spines and, potentially, from presynaptic axonal varicosities/boutons. Recording electrical events from individual dendritic spines is important for several reasons. Spines play a critical role in the input-output transform carried out by an individual neuron. They receive most of the excitatory synapses in many brain regions and serve as calcium compartments, which appear to be necessary for input-specific synaptic plasticity (Yuste and Denk 1995; Sabatini et al. 2002; Noguchi et al. 2005). In the last decade, a number of investigators, (e.g. Winfried Denk; Rafael Yuste; Karel Svoboda; Bernardo Sabatini; Haruo Kasai) revisited previously well-articulated theoretical questions and ideas (Rall 1974; Koch and Zador 1993) and analyzed open problems in spine physiology with the aid of novel experimental technologies. The methodology has been developed to measure Ca2+ signals from individual spines with great precision using two-photon microscopy, and many aspects of spine physiology related to Ca2+ signaling have been illuminated (Sala and Segal 2014).
The electrical behavior of spines, however, is less well understood and controversial. For a long time, the electrical role of spines had to be considered on purely theoretical grounds because it was technically impossible to measure Vm-signals from individual spines. Theoretical work (Rall 1974; Segev and Rall 1998; Jack et al. 1975) and, more recently, several experimental studies (Bloodgood and Sabatini 2005; Noguchi et al. 2005; Araya and Jiang 2006; Araya et al. 2006; Harnett et al. 2012; Gulledge et al. 2012) provided indirect evidence that the electrical characteristics of dendritic spines might have important implications for integrative function and for the plastic properties of neurons. Other studies based on diffusion measurements (Svoboda et al. 1996; Tønnesen et al. 2014) as well as on multi-compartmental modeling (Koch and Zador 1993) indicated that spines may not play a significant electrical role. This question is still unresolved because it has never been possible to document directly the electrical behavior of dendritic spines owing to the limited sensitivity of the available measurement techniques at the requisite spatial resolution. Thus, a critical challenge, both conceptually and technically, was to develop an approach for the direct analysis of Vm signals from individual dendritic spines. The improvement in sensitivity described above made this type of recording possible (Holthoff et al. 2010) as illustrated in Fig. 3.16. In these measurements a magnified image of a spiny dendrite of a stained neuron was projected onto a CCD camera and fluorescence intensity changes were monitored from multiple locations. The bAP related signals from dendritic spines were clearly resolved in single trial measurements and the S/N was further improved by averaging a small number of trials (4–9). One concern with respect to these measurements was that scattered light from the parent dendrite, in wide-field fluorescence measurements, might contaminate signals from individual spines. To address this issue, Holthoff et al. (2010) compared dendritic signals from individual spines with recordings from analogous regions without spines and found that the signals from regions without spines were smaller than the noise in the measurement (Fig. 3.16a, b, locations 2 and 3). Thus, the interference from scattered light was insignificant in the superficial layers of the slice. Another concern was the amount of photodynamic damage caused by the high intensity excitation light. In several experiments, the very first single-trial optical recording of the bAP (control signal) was compared with the last bAP signal at the end of the experiment. The results indicated that, in the range tested (up to 25 recording trials) the first and the last bAP signal were identical, indicating that the photodynamic damage was not significant.
Fig. 3.16.
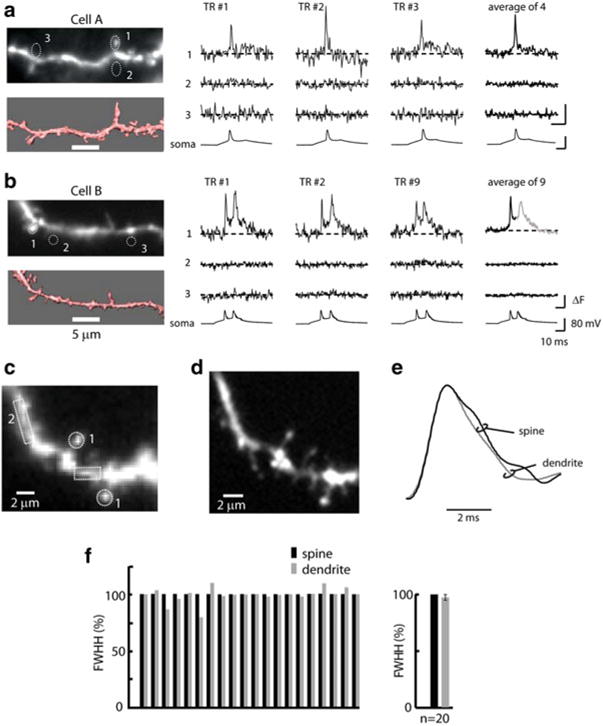
bAP signals from individual dendritic spines and parent dendrites. (a, b) Left panels: Upper micrographs—fluorescence images of dendritic spiny branches obtained with the CCD camera for voltage-imaging. Lower micrographs—anatomical reconstructions obtained from deconvoluted stacks of spinning-disk confocal images. Right panels: Fluorescence intensity traces from locations 1 to 3 outlined on CCD images. Single-trial recordings and temporal averages of 4 and 9 trials are shown. Bottom traces: electrode recordings from the soma. The bAP signals are absent from regions without spines (locations 2 and 3). (c) A fluorescence image of a section of a spiny dendrite. (d) Anatomical reconstruction from a stack of confocal images. (e) Comparison of bAP waveform in the spines and parent dendrite. (f) Summary results: comparison of bAP duration in the spines and parent dendrites. The individual results of waveform comparison from 20 neurons are shown together with the average values ± SEM. Adapted from Holthoff et al. (2010)
From the type of data shown in Fig. 3.16, it was possible, for the first time, to determine and compare the time course of the bAPs signals in spines and parent dendrites (Holthoff et al. 2010). The waveforms of the bAP signals were reconstructed from the data obtained at 2 kHz frame rate using cubic spline interpolation and compared on an expanded time scale. Figure 3.16e shows that both the upstroke and the downstroke of the AP in spines and dendrites closely overlapped. The summary result from 20 different neurons (Fig. 3.16f) showed that signals from spines and dendrites did not differ significantly. Thus, these results demonstrate that bAPs in spines have a rapid time-course that is very similar to that of spikes recorded in the parent dendrite. The rapid time-course of the bAP in the spines may be a critical determinant for the precise regulation of spike timing-dependent synaptic plasticity within a very narrow time window (Caporale and Dan 2008).
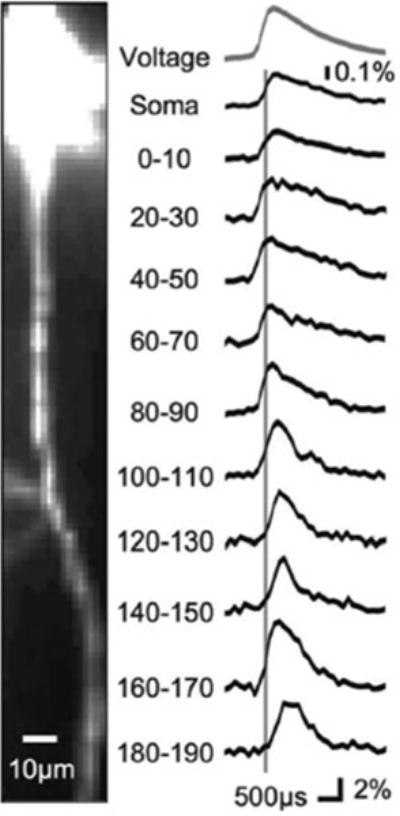
Improved Vm-Imaging of Subthreshold EPSP from Dendritic Spines
On the conceptual level, a key open question regarding the electrical role of dendritic spines is whether the hypothetical electrical isolation of synapses on spine heads caused by a narrow spine neck provides specific functions which are not available to synapses on dendrites. Several such functions have been proposed based on computational modeling and indirect evidence: (1) Spines reduce location-dependent variability of local EPSPs and, thus, standardize and enhance synaptic activation of voltage-gated channels. (2) Changes in structure and electrical resistance of the spine neck under hypothesized activity control mediate the induction of synaptic plasticity underlying learning and memory formation. (3) Electrical properties of spines promote either linear or nonlinear (depending on evidence) dendritic integration and associated forms of plasticity, thus fundamentally enhancing the computational capabilities of neurons. (4) Spines have the capacity to act as discrete electrogenic compartments that amplify synaptic potentials by activation of voltage-sensitive channels. These functions, if directly demonstrated, would define the electrical role of spines. However, a direct demonstration of the electrical behaviour of dendritic spines would require recording of unitary subthreshold synaptic responses at the spatial scale of individual spines with adequate sensitivity and temporal resolution to allow quantitative analysis. The central problem was the sensitivity of optical recordings in terms of the signal-to-noise ratio (S/N) at the required spatiotemporal resolution. The best existing sensitivity which allowed optical monitoring of bAP from dendritic spines, as shown above, was insufficient because EPSP signals would be 5–10-fold smaller in amplitude. The required improvement in sensitivity was recently accomplished by: (a) further increase in the excitation intensity from a laser at the wavelength that has the best signal; (b) minimizing photodynamic damage by restricting the excitation light to a small area (18 μm × 18 μm) around the spine of interest and by briefly lowering oxygen concentration in the extracellular solution during optical recording. The sensitivity of optical recording under these conditions is illustrated in Fig. 3.17. A subthreshold EPSP was evoked by stimulating one synapse on a dendritic spine using 2-photon uncaging of glutamate while optical signals were acquired at a frame rate of 2 kHz from a small segment of a basal dendrite of a layer 5 pyramidal neuron. The uncaging was followed by a bAP evoked by a depolarizing current pulse delivered from a somatic patch-electrode. Both the subthreshold signal and the action potential signal can be clearly resolved in optical recordings from the spine head and the parent dendrite with modest signal averaging; the EPSP and bAP recordings are average of 8 and 4 trials respectively. Calibration of optical signals on an absolute scale (in mV) was obtained by normalizing the subthreshold signal to an optical signal from a bAP which has a known declining amplitude along basal dendrites (Nevian et al. 2007). These measurements established that voltage-sensitive dye recording based on wide-field laser-excitation fluorescence microscopy permits monitoring of subthreshold electrical signal integration in individual dendritic spines and parent dendrites in acute brain slice preparations.
Fig. 3.17.
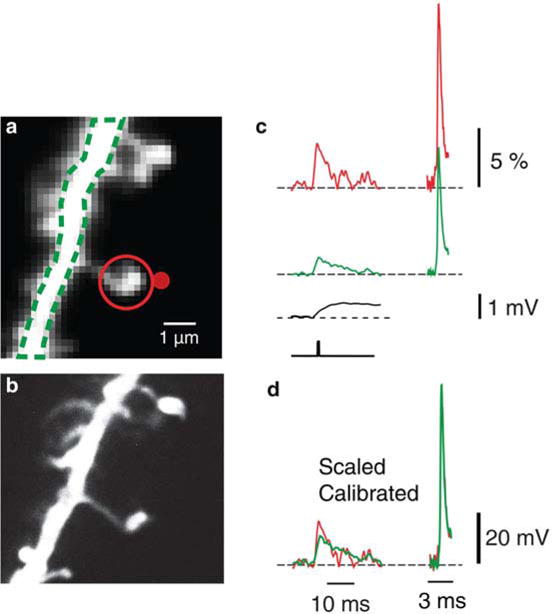
Recording subthreshold electrical events from individual dendritic spines. (a) Fluorescence images of a small section of a spiny basal dendritic branch obtained with the CCD camera for voltage-imaging. (b) High-resolution mage of the same area from a z-stack of confocal images. (c) Traces on left: EPSP recordings from spine head ( red) and parent dendrite ( green). Average of eight trials. Bottom black traces: Somatic electrode recording and the uncaging command pulse. Traces on right: bAP signals from same locations. Average of four trials. (d) Left traces: superimposed EPSP signals from spine head and parent dendrite calibrated in terms of membrane potential. Right traces: bAP signals corrected for recording sensitivity difference
Vm-Imaging of Inhibitory Synaptic Potentials
In parallel to the improved ability to resolve EPSPs from dendritic spines, laser light excitation also allows discriminating inhibitory postsynaptic potentials (IPSPs) from larger dendritic segments. The possibility of obtaining this type of measurement was demonstrated by Canepari et al. (2010) who monitored IPSPs in the apical dendrites of CA1 hippocampal pyramidal neurons (Canepari et al. 2010). In contrast to EPSPs, IPSPs are mediated by GABAA or glycine receptors and Cl− ions which have negative reversal potential under physiological conditions resulting in a smaller driving force at rest. Thus, IPSPs are typically smaller in amplitude compared to EPSPs and their discrimination requires averaging fluorescence over dendritic segments > 10 μm. Nevertheless IPSPs of 1 mV or smaller can be optically measured as shown in the example of Fig. 3.18 (Canepari et al. 2010). Beside the possibility of resolving this important synaptic signal locally and with a relatively good spatial resolution, the optical measurement of IPSPs offers another advantage compared to the electrode measurement. Indeed, the polarity and the size of the IPSPs depend on the intracellular Cl− concentration which is perturbed by the dialyzing effect of the invasive electrode recording. In the same pilot study Canepari et al. (2010) showed that it is possible to image IPSPs under physiological Cl− concentration without concomitant electrode recording. Therefore, voltage imaging offers a tool to investigate IPSPs during the evolution of Cl− homeostasis occurring in early postnatal development (Cherubini et al. 1991).
Fig. 3.18.
Optical recording of dendritic IPSP. The reconstruction of a CA1 hippocampal pyramidal neuron and the dendrite portion in the recording position are shown on the left. Optical recordings are spatial average from dendritic region indicated by the rectangle. The position of the stimulating electrode is illustrated. Electrical recordings from the soma ( upper traces) and optical recordings from the dendrite ( lower traces) following one extracellular stimulus at three different intensities are shown on the right; the weakest intensity failed to evoke an IPSP; the intermediate intensity evoked a unitary IPSP of less than 1 mV; the strongest intensity evoked a larger IPSP of ~2 mV. Recordings are averages of 16 trials obtained in the presence of glutamate receptors antagonists. Adapted from Canepari et al. (2010)
3.2.5 Alternative Approaches
A possible way to further improve Vm-imaging from individual neurons is by synthesizing new organic probes with characteristics designed specifically for a particular application. In recent studies, Leslie Loew, Srdjan Antic, and their collaborators introduced a new series of long-wavelength voltage-sensitive dyes for intracellular application (Wuskell et al. 2006; Zhou et al. 2008). These new voltage probes called blue dyes (Shoham et al. 1999) extended the range of excitation wavelengths to near 700 nm, with emission reaching 800–900 nm. Longer wavelength dyes permit deeper penetration by the excitation light into the nervous tissue which could be of considerable importance in optical measurements for both brain slice and in vivo preparations (see Chap. 2). These dyes also offer new possibilities for the design of combined recordings and optogenetic stimulations with multiple probes (Canepari et al. 2008; Willadt et al. 2014) (see also Chap. 4). The new probes seem to be characterized by somewhat higher voltage sensitivity in terms of the fractional fluorescence change in response to a unit change in Vm, when applied intracellularly (but see Fig. 3.8c and the discussion of dye sensitivity in Sect. 3.2.4). The sensitivity of recording from individual neurons in terms of the S/N, however, has not, as yet, been fully exploited with the application of blue dyes (Zhou et al. 2007, 2008). Additional sensitivity comparisons remain to be carried out at similar excitation light intensities and for each particular preparation.
Both the new long-wavelength voltage-sensitive dyes and the more conventional probes excited by the green portion of the visible spectrum were used, together with stationary, small spot laser illumination, to investigate the dynamics of bAPs in the terminal sections of basal dendrites (dendritic tips) of prefrontal cortical pyramidal neurons, a region that has never been probed for electrical signals by any method (Zhou et al. 2008). In this recording mode, the excitation light was provided from laser sources emitting at 532, 633, or 658 nm. The laser beam was directed into one end of a 0.2 mm diameter optical fiber (light guide) with a collimator attached to the other end of the fiber which was coupled to the epifluorescence port of a microscope. In this way, a stationary spot of laser light (25–50 μm in diameter) was projected onto the object plane. For recordings of voltage-sensitive dye signals, a selected region of the neuronal process of interest was moved into the laser spot using the X–Y microscope positioning stage. The sensitivity of these measurements in recordings from 25 to 50 μm long sections on dendritic processes allowed optical monitoring of AP signals from the tips of basal dendrites, as well as from individual axons, with minimal temporal averaging. Representative AP related signals obtained in these studies are shown in Fig. 3.19. The results indicated that in short (< 150 μm) and medium (150–200 μm) length basal dendrites APs backpropagated with modest changes in AP half-width or AP rise-time. The lack of substantial changes in AP shape is inconsistent with the AP-failure model based mainly on electrode recordings (Nevian et al. 2007). Large access resistance, up to 200 MΩ, and incomplete electrode capacitance compensation associated with high-resistance patch pipettes (100 MΩ) manufactured to patch thin (submicron diameter) dendritic branches (Nevian et al. 2007) may affect both the amplitude and half-width of fast sodium APs (see Fig. 9 in Zhou et al. 2008). Thus, the information from optical recordings (Zhou et al. 2008) calls into question the commonly held view that spikes are severely attenuated in both apical and basal dendrites and fail to propagate to the most distal dendritic regions (see Vetter et al. (2001) for references).
Fig. 3.19.
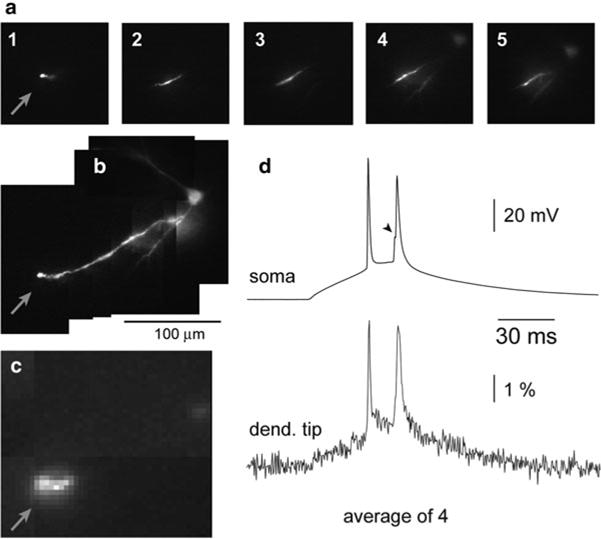
AP signals from basal dendrites of a pyramidal neuron from the prefrontal cortex slice obtained with laser spot illumination.(a) Five images (1–5) of different dendritic segments illuminated by a motionless laser spot (~50 μm in diameter). (b) A composite image of the whole basal dendrite (from images 1 to 5 shown in a). (c) Enlargement of a section from image 1. Arrow marks the tip of the dendrite. (d) Simultaneous whole-cell electrode recording from soma and optical recording from the tip of the dendrite of evoked APs. The optical signal is the spatial average from eight neighboring pixels averaged over four trials. The peak of the first AP was used as a reference point for averaging. Adapted from Zhou et al. (2008)
The disadvantage of the small spot laser illumination approach is that it sacrifices spatial resolution by recording from a single site on the neuron. On the other hand, this method has the advantage that it improves the sensitivity by reducing the background fluorescence and by eliminating scattered fluorescence light from neighboring regions which degrades spatial resolution in the wide-field illumination mode. Additionally, small spot illumination reduces possible photodynamic damage and allows longer recording periods because only a relatively small region on a neuron is exposed to high intensity light at any one time.
Several other alternative optical approaches to Vm measurements with organic dyes, including fluorescence resonance energy transfer (FRET), confocal fluorescence microscopy, second harmonic generation (SHG) microscopy as well as imaging methods with genetically encoded membrane protein Vm sensors, are currently being explored. At present, however, these methods are less efficient and seem less likely to achieve adequate response time and sensitivity at high frame rates and single-spine resolution. Only two-photon excitation of voltage-sensitive dye fluorescence (Chap. 17) has, thus far, exhibited the requisite sensitivity when tested on mouse neurohypophysis, a preparation composed of tightly packed excitable axon terminal membranes and, hence, uniquely convenient for Vm-imaging. More recently this technique has been successfully applied to detect back-propagating action potentials in single dendritic spines (Acker et al. 2011) as well as spikes in single axonal boutons (Rowan et al. 2014; see also Chap. 17).
Another important approach to multiple site voltage-imaging from individual neurons is the use of hybrid voltage-sensors consisting of fluorescent proteins and voltage-dependent quenchers. This idea, based on Fluorescence Resonance Energy Transfer (FRET), was introduced by González and Tsien (1995) using fixed fluorescent donors and translocating oxonol acceptors (see Chap. 6). The two component system was subsequently improved (Chanda et al. 2005) to include a genetically encoded component—farnesylated enhanced GFP (eGFP-F)—and a synthetic voltage sensing molecule, dipicrylamine (DPA). The sensitivity of this approach in terms of ΔF/F per unit change in membrane potential was further optimized by substituting eGFP-F component for a fluorescent neuronal tracer dye DiO (Bradley et al. 2009; Fink et al. 2012) or a cerulean fluorescent protein (Wang et al. 2010). The hybrid voltage sensor (hVOS) which includes a fluorescence protein has an advantage that it can be genetically targeted to a specific cell type (Wang et al. 2010). The genetic targeting of hVOS has been demonstrated in transgenic mice (Wang et al. 2010) but the specificity of expression was insufficient for single cell resolution. The use of hVOS which includes DiO applied to individual neurons by electroporation is limited to the soma and proximal axonal and dendritic processes because DiO is lipophilic and its diffusion within a neuron is too slow (Fink et al. 2012). The FRET response time constant tends to be inversely proportional to the hydrophobicity of the acceptor (González and Tsien 1995, 1997) or the donor dye (Bradley et al. 2009); the highly lipophilic dyes that yield fast response time constants and high sensitivity to Vm changes are more difficult or impossible to load into cell membranes at locations distal to the dye injection site. Thus, while voltage-sensitive probes based on FRET demonstrated relatively high sensitivity in recordings from proximal neuronal processes (Fink et al. 2012), they have not been successfully employed in imaging Vm signals from distal processes of individual neurons (see Chap. 6 for more detailed description of the FRET imaging approach).
The application of confocal fluorescence microscopy for measuring signals from voltage-sensitive dyes had been limited by another type of difficulty. The superior spatial resolution of confocal microscopy technique has not been effectively utilized in Vm-imaging from dendritic spines and other very small structures owing to insufficient S/N. This is mainly because of the high fractional shot noise related to the small number of photons available for collection (Kuhn et al. 2004; Dombeck et al. 2006; Kerr and Denk 2008); (see also Chap. 17). A study by Palmer and Stuart (2009) demonstrated that, in spite of the technical difficulties to which we have already alluded, Vm transients from presynaptic terminals and individual spines could be monitored using voltage-sensitive dyes and the confocal fluorescence microscopy mode with the aid of extensive temporal averaging. The fluorescence signals related to Vm transients were detected from individual dendritic spines using confocal microscopy (Palmer and Stuart 2009). Optical signals from spines and parent dendrites were monitored with Olympus FV300 confocal microscope with a 60× objective (Olympus; NA 0.9) using an open pinhole to maximize light intensity. The voltage-sensitive dye JPW3028 was excited using a 543 nm laser (HeNe; Melles Griot). An important advantage of this approach is its excellent spatial resolution that allowed visualization of individual dendritic spines below the surface of a brain slice as well as monitoring of Vm signals clearly isolated to individual spines and neighboring parent dendrites (Fig. 3.20). There are, however, three important disadvantages of confocal Vm-imaging. The first disadvantage is related to the relatively low photon flux that can be achieved in this microscopy mode. Due to low light intensity, the AP signal size was approximately ten times smaller than the shot noise. Therefore, extensive averaging (> 100 trials) as well as adding averaged results to create so called super-averages, were required to extract useful information. The necessity for extensive averaging makes repeated recordings under different conditions difficult or impossible. In addition, signal averaging limits this approach to studies of relatively simple phenomena while many aspects of dendritic signal integration are too complex to be analyzed by extensive averaging. The second disadvantage of confocal measurements is that the recording speed is restricted to approximately 800 Hz by the available S/N. This sampling rate is insufficient for correct reconstruction of AP and EPSP signal size and shape according to the Nyquist–Shannon sampling theorem (Roberts 2004). The theorem defines the Nyquist rate, the minimum sampling rate required to avoid distortion of the analog signal, to be equal to twice the highest frequency contained within the signal. The upstroke of the AP waveform (threshold to peak) at room temperature is completed in 300–600 μs corresponding to frequencies of 1.6–3 kHz and, thus, requiring optical recording frame rates in the range of 3–6 kHz. At physiological temperature this requirement is even more stringent. It is helpful that the general shapes of the AP and EPSP waveforms are well defined from electrical measurement, so that aliasing, a certain type of signal distortion, can be safely excluded. This fact allows a modest relaxation of the strict Nyquist rate rule. Nevertheless, the data obtained with sampling rates significantly lower than the Nyquist rate must be regarded as an approximation because of the significant distortion of both the waveform and the amplitude of the signal. Finally, the third important limitation of laser-scanning confocal Vm-imaging is that, in applications where the goal is to monitor electrical events at many locations on an individual neuron, a line scan imaging mode cannot replace a true multiple site optical recording. Notwithstanding these limitations, the results described in Palmer and Stuart (2009) argue convincingly that bAPs invade dendritic spines without significant voltage loss. Additionally, the measurements of EPSP signals at different Vm levels showed that voltage-activated channels do not significantly boost the voltage response in dendritic spines during synaptic input. This work also emphasizes the crucial importance of adequate spatial resolution in recordings from small structures within an opaque brain slice tissue. If the recording is carried out from neurons deep in a slice, the required resolution can only be provided by microscopy modes that reject scattered and out of focus light (confocal microscopy, second harmonic generation (SHG) microscopy, and two-photon fluorescence microscopy).
Fig. 3.20.
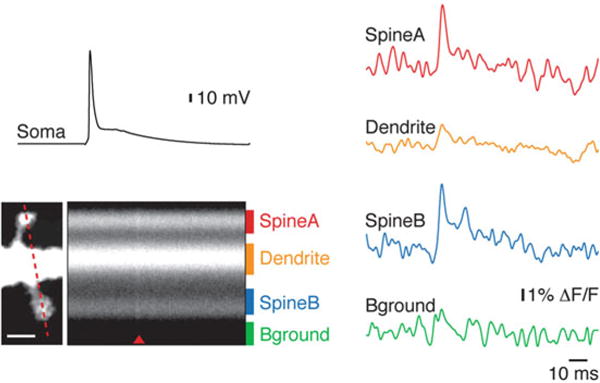
Imaging Vm in dendritic spines using confocal line scan microscopy mode. (a) A fluorescence image of a basal dendrite with two dendritic spines. Scale bar¼1 μm. Dashed red line indicates a laser line-scan traversing two spines and the resulting average fluorescence change in response to ~100 bAPs ( right). Red arrow head indicates timing of stimulus, and colored bars represent four labeled regions of interest. (b) Fluorescence traces ( colored) in response to somatically evoked bAPs ( black) for the regions of interest shown in (a). Adapted from Palmer and Stuart (2009)
The same limitation in sensitivity applies to SHG imaging of Vm signals, a nonlinear optical technique that generates a similar or lower photon flux compared to two-photon imaging (Dombeck et al. 2005). There are two important additional restrictions to SHG imaging. First, SHG is, essentially, a non-linear scattering phenomenon and, as such, is predominantly in the forward direction (see Chaps. 17 and 19), limiting this approach to thin preparations and precluding epi-illumination. Secondly, SHG requires a non-centro-symmetrical radiating (scattering) source. If the molecular distribution of the probe in a focal volume is partially symmetrical, with molecules oriented in opposing directions, they will produce SHG signals with opposing phases. This leads to a partial destructive interference of SHG signals, reducing the signal size by a factor that is unknown in the general case (Moreaux et al. 2000). Thus, the same Vm transient in different dendritic compartments may produce optical signals of dramatically different amplitudes, preventing correct calibration of the optical response in terms of Vm from measurements at any one site. The same difficulty in calibrating optical signals on an absolute scale exist in Vm-imaging using intracellular voltage-sensitive dyes, as described above, albeit for a different reason. The first attempt to analyze electrical events in individual spines (Nuriya et al. 2006) was based on recording SHG signals. The results of this work provided excellent impetus for making Vm-imaging with single spine resolution possible. The same results, however, are a good illustration of the current methodological difficulties. The low sensitivity of these measurements required extensive averaging (> 100 trials) but still resulted in an insufficient S/N, precluding quantitative analysis of the signal size and shape. It is noteworthy that signal averaging has strict limitations and a further improvement in the S/N by a factor of only 2 would require averaging more than 1,000 trials, which is not feasible in most experiments. Thus, no further application of this approach to monitoring electrical events from individual spines has been reported.
Finally, the most modern approach to Vm-imaging is a methodology focused on genetically encoded protein Vm sensors (see Chap. 20 for more details). The genetic approach could potentially develop into an ideal method to selectively label and monitor different classes of neurons. Thus, protein sensors (voltage-sensitive fluorescent proteins, VSFPs) are being extensively investigated and some of the prototype molecules have shown considerable promise in their ability to detect Vm transients (see Chap. 20). At present, however, this approach to monitoring Vm signaling in individual neurons is limited in several ways. First, the sensitivity and the response time of genetically encoded protein sensors are, as yet, insufficient. Kinetics in particular need to be two orders of magnitude look for the kind of experiments envisioned here. In addition, the problems regarding linearity of response, adequate expression in vertebrate neurons, and possible undesirable effects (e.g. significant capacitive load) on neuronal physiology have not been resolved. Thus, the practical application of this approach is just beginning to be realized (Cao et al. 2013; Jin et al. 2012).
Contributor Information
Marko Popovic, Department of Cellular and Molecular Physiology, Yale University School of Medicine, New Haven, CT 06520, USA.
Kaspar Vogt, Division of Pharmacology and Neurobiology, Biozentrum – University of Basel, Basel, Switzerland.
Knut Holthoff, Hans Berger Klinik für Neurologie, Friedrich-Schiller-Universität Jena, Jena, Germany.
Arthur Konnerth, Center for Integrated Protein Science and Institute of Neuroscience, Technical University Munich, Munich, Germany.
Brian M. Salzberg, Department of Neuroscience, University of Pennsylvania School of Medicine, Philadelphia, PA, USA
Amiram Grinvald, Department of Neurobiology, Weizmann Institute of Science, PO Box 26, Rehovot 76100, Israel.
Srdjan D. Antic, Department of Neuroscience, U. Conn. Health Center, Farmington, CT 06030, USA
Marco Canepari, Laboratoire Interdisciplinare de Physique, (CNRS Université Joseph Fourier UMR 5588), Grenoble, France.
Dejan Zecevic, Department of Cellular and Molecular Physiology, Yale University School of Medicine, New Haven, CT 06520, USA.
References
- Acker CD, Antic SD. Quantitative assessment of the distributions of membrane conductances involved in action potential backpropagation along basal dendrites. J Neurophysiol. 2009;101(3):1524–1541. doi: 10.1152/jn.00651.2007. http://www.pubmedcentral.nih.gov/articlerender.fcgi?artid=2666409&tool=pmcentrez&rendertype=abstract. Accessed 13 Jan 2014. [DOI] [PMC free article] [PubMed] [Google Scholar]
- Acker CD, Yan P, Loew LM. Single-voxel recording of voltage transients in dendritic spines. Biophys J. 2011;101(2):L11–L13. doi: 10.1016/j.bpj.2011.06.021. http://www.pubmedcentral.nih.gov/articlerender.fcgi?artid=3136788&tool=pmcentrez&rendertype=abstract. Accessed 26 Jan 2014. [DOI] [PMC free article] [PubMed] [Google Scholar]
- Antic S, et al. Functional profile of the giant metacerebral neuron of Helix aspersa: temporal and spatial dynamics of electrical activity in situ. J Physiol. 2000;527(Pt 1):55–69. doi: 10.1111/j.1469-7793.2000.00055.x. http://www.pubmedcentral.nih.gov/articlerender.fcgi?artid=2270048&tool=pmcentrez&rendertype=abstract. Accessed 23 Nov 2014. [DOI] [PMC free article] [PubMed] [Google Scholar]
- Antic S, Major G, Zecevic D. Fast optical recordings of membrane potential changes from dendrites of pyramidal neurons. J Neurophysiol. 1999;82(3):1615–1621. doi: 10.1152/jn.1999.82.3.1615. http://www.ncbi.nlm.nih.gov/pubmed/10482775. Accessed 23 Nov 2014. [DOI] [PubMed] [Google Scholar]
- Antic S, Zecević D. Optical signals from neurons with internally applied voltage-sensitive dyes. J Neurosci. 1995;15(2):1392–1405. doi: 10.1523/JNEUROSCI.15-02-01392.1995. http://www.ncbi.nlm.nih.gov/pubmed/7869106. Accessed 29 Jul 2014. [DOI] [PMC free article] [PubMed] [Google Scholar]
- Antic SD. Action potentials in basal and oblique dendrites of rat neocortical pyramidal neurons. J Physiol. 2003;550(Pt 1):35–50. doi: 10.1113/jphysiol.2002.033746. http://www.pubmedcentral.nih.gov/articlerender.fcgi?artid=2343022&tool=pmcentrez&rendertype=abstract. Accessed 23 Nov 2014. [DOI] [PMC free article] [PubMed] [Google Scholar]
- Araya R, Jiang J, et al. The spine neck filters membrane potentials. Proc Natl Acad Sci U S A. 2006a;103(47):17961–17966. doi: 10.1073/pnas.0608755103. http://www.pubmedcentral.nih.gov/articlerender.fcgi?artid=1693855&tool=pmcentrez&rendertype=abstract. Accessed 22 Jan 2014. [DOI] [PMC free article] [PubMed] [Google Scholar]
- Araya R, Eisenthal KB, Yuste R. Dendritic spines linearize the summation of excitatory potentials. Proc Natl Acad Sci U S A. 2006b;103(49):18799–18804. doi: 10.1073/pnas.0609225103. http://www.pubmedcentral.nih.gov/articlerender.fcgi?artid=1693742&tool=pmcentrez&rendertype=abstract. Accessed 31 Jan 2014. [DOI] [PMC free article] [PubMed] [Google Scholar]
- Bennett CB, Muschol M. Large neurohypophysial varicosities amplify action potentials: results from numerical simulations. Endocrinology. 2009;150(6):2829–2836. doi: 10.1210/en.2008-1636. http://www.ncbi.nlm.nih.gov/pubmed/19213831. Accessed 31 Jan 2014. [DOI] [PubMed] [Google Scholar]
- Bloodgood BL, Sabatini BL. Neuronal activity regulates diffusion across the neck of dendritic spines. Science (New York, N Y) 2005;310(5749):866–869. doi: 10.1126/science.1114816. http://www.ncbi.nlm.nih.gov/pubmed/16272125. Accessed 24 Jan 2014. [DOI] [PubMed] [Google Scholar]
- Bradley J, et al. Submillisecond optical reporting of membrane potential in situ using a neuronal tracer dye. J Neurosci. 2009;29(29):9197–9209. doi: 10.1523/JNEUROSCI.1240-09.2009. http://www.pubmedcentral.nih.gov/articlerender.fcgi?artid=2909666&tool=pmcentrez&rendertype=abstract. Accessed 31 Jan 2014. [DOI] [PMC free article] [PubMed] [Google Scholar]
- Canepari M, et al. Imaging inhibitory synaptic potentials using voltage sensitive dyes. Biophys J. 2010;98(9):2032–2040. doi: 10.1016/j.bpj.2010.01.024. http://dx.doi.org/10.1016/j.bpj.2010.01.024. Accessed 27 Jan 2014. [DOI] [PMC free article] [PubMed] [Google Scholar]
- Canepari M, Djurisic M, Zecevic D. Dendritic signals from rat hippocampal CA1 pyramidal neurons during coincident pre- and post-synaptic activity: a combined voltage- and calcium-imaging study. J Physiol. 2007;580(Pt 2):463–484. doi: 10.1113/jphysiol.2006.125005. http://www.pubmedcentral.nih.gov/articlerender.fcgi?artid=2075540&tool=pmcentrez&rendertype=abstract. Accessed 31 Jan 2014. [DOI] [PMC free article] [PubMed] [Google Scholar]
- Canepari M, Vogt K, Zecevic D. Combining voltage and calcium imaging from neuronal dendrites. Cell Mol Neurobiol. 2008;28(8):1079–1093. doi: 10.1007/s10571-008-9285-y. http://www.pubmedcentral.nih.gov/articlerender.fcgi?artid=3143714&tool=pmcentrez&rendertype=abstract. Accessed 31 Jan 2014. [DOI] [PMC free article] [PubMed] [Google Scholar]
- Canepari M, Vogt KE. Dendritic spike saturation of endogenous calcium buffer and induction of postsynaptic cerebellar LTP. PLoS One. 2008;3(12):e4011. doi: 10.1371/journal.pone.0004011. http://www.pubmedcentral.nih.gov/articlerender.fcgi?artid=2603473&tool=pmcentrez&rendertype=abstract. Accessed 31 Jan 2014. [DOI] [PMC free article] [PubMed] [Google Scholar]
- Cao G, et al. Genetically targeted optical electrophysiology in intact neural circuits. Cell. 2013;154(4):904–913. doi: 10.1016/j.cell.2013.07.027. http://www.ncbi.nlm.nih.gov/pubmed/23932121. Accessed 21 Jan 2014. [DOI] [PMC free article] [PubMed] [Google Scholar]
- Caporale N, Dan Y. Spike timing-dependent plasticity: a Hebbian learning rule. Annu Rev Neurosci. 2008;31:25–46. doi: 10.1146/annurev.neuro.31.060407.125639. http://www.ncbi.nlm.nih.gov/pubmed/18275283. Accessed 25 Jan 2014. [DOI] [PubMed] [Google Scholar]
- Chanda B, et al. A hybrid approach to measuring electrical activity in genetically specified neurons. Nat Neurosci. 2005;8(11):1619–1626. doi: 10.1038/nn1558. http://www.ncbi.nlm.nih.gov/pubmed/16205716. Accessed 24 Jan 2014. [DOI] [PubMed] [Google Scholar]
- Cherubini E, Gaiarsa JL, Ben-Ari Y. GABA: an excitatory transmitter in early postnatal life. Trends Neurosci. 1991;14(12):515–519. doi: 10.1016/0166-2236(91)90003-d. http://www.ncbi.nlm.nih.gov/pubmed/1726341. Accessed 25 Nov 2014. [DOI] [PubMed] [Google Scholar]
- Cohen LB, et al. Changes in axon fluorescence during activity: molecular probes of membrane potential. J Membr Biol. 1974;19(1):1–36. doi: 10.1007/BF01869968. http://www.ncbi.nlm.nih.gov/pubmed/4431037. [DOI] [PubMed] [Google Scholar]
- Cohen LB, Salzberg BM. Optical measurement of membrane potential. Rev Physiol Biochem Pharmacol. 1978;83:35–88. doi: 10.1007/3-540-08907-1_2. [DOI] [PubMed] [Google Scholar]
- Cohen LB, Lesher S. Optical monitoring of membrane potential: methods of multisite optical measurement. Soc Gen Physiol Ser. 1986;40:71–99. http://www.ncbi.nlm.nih.gov/pubmed/3520842. Accessed 13 Nov 2014. [PubMed] [Google Scholar]
- Daintry J, editor. Laser speckle and related phenomena. 2nd. Springer-Verlag; Berlin: 1984. http://www.ncbi.nlm.nih.gov/pubmed/18213052. Accessed 13 Nov 2014. [Google Scholar]
- Davila HV, et al. Changes in ANS and TNS fluorescence in giant axons from Loligo. J Membr Biol. 1974;15(1):29–46. doi: 10.1007/BF01870080. http://www.ncbi.nlm.nih.gov/pubmed/4837989. Accessed 13 Nov 2014. [DOI] [PubMed] [Google Scholar]
- Djurisic M, et al. Functional structure of the mitral cell dendritic tuft in the rat olfactory bulb. J Neurosci. 2008;28(15):4057–4068. doi: 10.1523/JNEUROSCI.5296-07.2008. http://www.ncbi.nlm.nih.gov/pubmed/18400905. Accessed 31 Jan 2014. [DOI] [PMC free article] [PubMed] [Google Scholar]
- Djurisic M, et al. Voltage imaging from dendrites of mitral cells: EPSP attenuation and spike trigger zones. J Neurosci. 2004;24(30):6703–14. doi: 10.1523/JNEUROSCI.0307-04.2004. http://www.ncbi.nlm.nih.gov/pubmed/15282273. Accessed 31 Jan 2014. [DOI] [PMC free article] [PubMed] [Google Scholar]
- Dombeck DA, et al. Optical recording of fast neuronal membrane potential transients in acute mammalian brain slices by second-harmonic generation microscopy. J Neurophysiol. 2006;94(5):3628–3636. doi: 10.1152/jn.00416.2005. http://www.ncbi.nlm.nih.gov/pubmed/16093337. Accessed 23 Nov 2014. [DOI] [PubMed] [Google Scholar]
- Fink AE, et al. Two-photon compatibility and single-voxel, single-trial detection of sub-threshold neuronal activity by a two-component optical voltage sensor. PLoS One. 2012;7(8):e41434. doi: 10.1371/journal.pone.0041434. http://www.pubmedcentral.nih.gov/articlerender.fcgi?artid=3411718&tool=pmcentrez&rendertype=abstract. Accessed 20 Jan 2014. [DOI] [PMC free article] [PubMed] [Google Scholar]
- Foust A, et al. Action potentials initiate in the axon initial segment and propagate through axon collaterals reliably in cerebellar Purkinje neurons. J Neurosci. 2010;30(20):6891–6902. doi: 10.1523/JNEUROSCI.0552-10.2010. http://www.pubmedcentral.nih.gov/articlerender.fcgi?artid=2990270&tool=pmcentrez&rendertype=abstract. Accessed 31 Jan 2014. [DOI] [PMC free article] [PubMed] [Google Scholar]
- Geiger RP, et al. Patch-clamp recording from mossy fiber terminals in hippocampal slices. Nat Protoc. 2006;1(4):2075–81. doi: 10.1038/nprot.2006.312. http://www.ncbi.nlm.nih.gov/pubmed/17487197. Accessed 24 Jan 2014. [DOI] [PubMed] [Google Scholar]
- González JE, Tsien RY. Improved indicators of cell membrane potential that use fluorescence resonance energy transfer. Chem Biol. 1997;4(4):269–277. doi: 10.1016/s1074-5521(97)90070-3. http://www.ncbi.nlm.nih.gov/pubmed/9195864. Accessed 13 Nov 2014. [DOI] [PubMed] [Google Scholar]
- González JE, Tsien RY. Voltage sensing by fluorescence resonance energy transfer in single cells. Biophys J. 1995;69(4):1272–1280. doi: 10.1016/S0006-3495(95)80029-9. http://www.pubmedcentral.nih.gov/articlerender.fcgi?artid=1236357&tool=pmcentrez&rendertype=abstract. [DOI] [PMC free article] [PubMed] [Google Scholar]
- Grinvald A, et al. Improved fluorescent probes for the measurement of rapid changes in membrane potential. Biophys J. 1982;39(3):301–308. doi: 10.1016/S0006-3495(82)84520-7. http://www.pubmedcentral.nih.gov/articlerender.fcgi?artid=1328947&tool=pmcentrez&rendertype=abstract. Accessed 23 Nov 2014. [DOI] [PMC free article] [PubMed] [Google Scholar]
- Grinvald A, et al. Optical recording of synaptic potentials from processes of single neurons using intracellular potentiometric dyes. Biophys J. 1987;51(4):643–651. doi: 10.1016/S0006-3495(87)83389-1. http://www.pubmedcentral.nih.gov/articlerender.fcgi?artid=1329936&tool=pmcentrez&rendertype=abstract. Accessed 13 Nov 2014. [DOI] [PMC free article] [PubMed] [Google Scholar]
- Grinvald A, Farber IC. Optical recording of calcium action potentials from growth cones of cultured neurons with a laser microbeam. Science (New York, N Y) 1981;212(4499):1164–1167. doi: 10.1126/science.7233210. http://www.ncbi.nlm.nih.gov/pubmed/7233210. Accessed 13 Nov 2014. [DOI] [PubMed] [Google Scholar]
- Grinvald A, Ross WN, Farber I. Simultaneous optical measurements of electrical activity from multiple sites on processes of cultured neurons. Proc Natl Acad Sci U S A. 1981;78(5):3245–3249. doi: 10.1073/pnas.78.5.3245. http://www.pubmedcentral.nih.gov/articlerender.fcgi?artid=319538&tool=pmcentrez&rendertype=abstract. [DOI] [PMC free article] [PubMed] [Google Scholar]
- Gulledge AT, Carnevale NT, Stuart GJ. Electrical advantages of dendritic spines. PLoS One. 2012;7(4):e36007. doi: 10.1371/journal.pone.0036007. http://www.pubmedcentral.nih.gov/articlerender.fcgi?artid=3332048&tool=pmcentrez&rendertype=abstract. Accessed 31 Jan 2014. [DOI] [PMC free article] [PubMed] [Google Scholar]
- Gupta RK, et al. Improvements in optical methods for measuring rapid changes in membrane potential. J Membr Biol. 1981;58(2):123–37. doi: 10.1007/BF01870975. http://www.ncbi.nlm.nih.gov/pubmed/7218335. Accessed 13 Nov 2014. [DOI] [PubMed] [Google Scholar]
- Harnett MT, et al. Synaptic amplification by dendritic spines enhances input cooperativity. Nature. 2012;491(7425):599–602. doi: 10.1038/nature11554. http://dx.doi.org/10.1038/nature11554. Accessed 23 Jan 2014. [DOI] [PMC free article] [PubMed] [Google Scholar]
- Holthoff K, Zecevic D, Konnerth A. Rapid time course of action potentials in spines and remote dendrites of mouse visual cortex neurons. J Physiol. 2010;588(Pt7):1085–1096. doi: 10.1113/jphysiol.2009.184960. http://www.pubmedcentral.nih.gov/articlerender.fcgi?artid=2852997&tool=pmcentrez&rendertype=abstract. Accessed 31 Jan 2014. [DOI] [PMC free article] [PubMed] [Google Scholar]
- Hu W, et al. Distinct contributions of Na(v)1.6 and Na(v)1.2 in action potential initiation and backpropagation. Nat Neurosci. 2009;12(8):996–1002. doi: 10.1038/nn.2359. http://www.ncbi.nlm.nih.gov/pubmed/19633666. Accessed 31 Jan 2014. [DOI] [PubMed] [Google Scholar]
- Iwasato T, et al. Cortex-restricted disruption of NMDAR1 impairs neuronal patterns in the barrel cortex. Nature. 2000;406(6797):726–731. doi: 10.1038/35021059. http://www.pubmedcentral.nih.gov/articlerender.fcgi?artid=3558691&tool=pmcentrez&rendertype=abstract. [DOI] [PMC free article] [PubMed] [Google Scholar]
- Jack J, Noble D, Tsien R. Electric current flow in excitable cells. Oxford Univ Press; London: 1975. [Google Scholar]
- Jin L, et al. Single action potentials and subthreshold electrical events imaged in neurons with a fluorescent protein voltage probe. Neuron. 2012;75(5):779–785. doi: 10.1016/j.neuron.2012.06.040. http://www.pubmedcentral.nih.gov/articlerender.fcgi?artid=3439164&tool=pmcentrez&rendertype=abstract. Accessed 20 Jan 2014. [DOI] [PMC free article] [PubMed] [Google Scholar]
- Kampa BM, Stuart GJ, Kampa M. Calcium spikes in basal dendrites of layer 5 pyramidal neurons during action potential bursts. J Neurosci. 2006;26(28):7424–32. doi: 10.1523/JNEUROSCI.3062-05.2006. http://www.ncbi.nlm.nih.gov/pubmed/16837590. Accessed 31 Jan 2014. [DOI] [PMC free article] [PubMed] [Google Scholar]
- Kerr JND, Denk W. Imaging in vivo: watching the brain in action. Nature reviews Neuroscience. 2008;9(3):195–205. doi: 10.1038/nrn2338. http://www.ncbi.nlm.nih.gov/pubmed/18270513. Accessed 9 July 2014. [DOI] [PubMed] [Google Scholar]
- Koch C, Zador A. The function of dendritic spines: devices subserving biochemical rather than electrical compartmentalization. J Neurosci. 1993;13(2):413–22. doi: 10.1523/JNEUROSCI.13-02-00413.1993. http://www.ncbi.nlm.nih.gov/pubmed/8426220. Accessed 23 Aug 2014. [DOI] [PMC free article] [PubMed] [Google Scholar]
- Konnerth A, Obaid AL, Salzberg BM. Optical recording of electrical activity from parallel fibres and other cell types in skate cerebellar slices in vitro. J Physiol. 1987;393:681–702. doi: 10.1113/jphysiol.1987.sp016848. http://www.pubmedcentral.nih.gov/articlerender.fcgi?artid=1192418&tool=pmcentrez&rendertype=abstract. Accessed 13 Nov 2014. [DOI] [PMC free article] [PubMed] [Google Scholar]
- Kuhn B, Fromherz P, Denk W. High sensitivity of Stark-shift voltage-sensing dyes by one- or two-photon excitation near the red spectral edge. Biophys J. 2004;87(1):631–639. doi: 10.1529/biophysj.104.040477. http://www.pubmedcentral.nih.gov/articlerender.fcgi?artid=1304385&tool=pmcentrez&rendertype=abstract. Accessed 31 Jan 2014. [DOI] [PMC free article] [PubMed] [Google Scholar]
- Larkum ME, et al. Synaptic integration in tuft dendrites of layer 5 pyramidal neurons: a new unifying principle. Science (New York, N Y) 2009;325(5941):756–60. doi: 10.1126/science.1171958. http://www.ncbi.nlm.nih.gov/pubmed/19661433. Accessed 28 Jan 2014. [DOI] [PubMed] [Google Scholar]
- Loew LM. Design and characterization of electrochromic membrane probes. J Biochem Biophys Methods. 1982;6(3):243–260. doi: 10.1016/0165-022x(82)90047-1. http://www.ncbi.nlm.nih.gov/pubmed/7130621. [DOI] [PubMed] [Google Scholar]
- Matsukawa H, et al. Motor dysfunction and altered synaptic transmission at the parallel fiber-Purkinje cell synapse in mice lacking potassium channels Kv3.1 and Kv3.3. J Neurosci. 2003;23(20):7677–7684. doi: 10.1523/JNEUROSCI.23-20-07677.2003. http://www.ncbi.nlm.nih.gov/pubmed/12930807. [DOI] [PMC free article] [PubMed] [Google Scholar]
- Milojkovic BA, Zhou W-L, Antic SD. Voltage and calcium transients in basal dendrites of the rat prefrontal cortex. J Physiol. 2007;585(Pt 2):447–468. doi: 10.1113/jphysiol.2007.142315. http://www.pubmedcentral.nih.gov/articlerender.fcgi?artid=2375496&tool=pmcentrez&rendertype=abstract. Accessed 31 Jan 2014. [DOI] [PMC free article] [PubMed] [Google Scholar]
- Moreaux L, et al. Membrane imaging by simultaneous second-harmonic generation and two-photon microscopy. Optics Lett. 2000;25(5):320–2. doi: 10.1364/ol.25.000320. http://www.ncbi.nlm.nih.gov/pubmed/18059867. Accessed 13 Nov 2014. [DOI] [PubMed] [Google Scholar]
- Nevian T, et al. Properties of basal dendrites of layer 5 pyramidal neurons: a direct patch-clamp recording study. Nat Neurosci. 2007;10(2):206–214. doi: 10.1038/nn1826. http://www.ncbi.nlm.nih.gov/pubmed/17206140. Accessed 31 Jan 2014. [DOI] [PubMed] [Google Scholar]
- Noguchi J, et al. Spine-neck geometry determines NMDA receptor-dependent Ca2+ signaling in dendrites. Neuron. 2005;46(4):609–622. doi: 10.1016/j.neuron.2005.03.015. http://www.ncbi.nlm.nih.gov/pubmed/15944129. Accessed 24 Jan 2014. [DOI] [PMC free article] [PubMed] [Google Scholar]
- Nuriya M, et al. Imaging membrane potential in dendritic spines. Proc Natl Acad Sci U S A. 2006;103(3):786–790. doi: 10.1073/pnas.0510092103. http://www.pubmedcentral.nih.gov/articlerender.fcgi?artid=1334676&tool=pmcentrez&rendertype=abstract. [DOI] [PMC free article] [PubMed] [Google Scholar]
- Obaid A, Shimizu H, Salzberg B. Intracellular staining with potentiometric dyes: optical signals from identified leech neurons and their processes. Biol Bull. 1982;163:388. [Google Scholar]
- Palmer LM, Stuart GJ. Membrane potential changes in dendritic spines during action potentials and synaptic input. J Neurosci. 2009;29(21):6897–6903. doi: 10.1523/JNEUROSCI.5847-08.2009. http://www.ncbi.nlm.nih.gov/pubmed/19474316. Accessed 31 Jan 2014. [DOI] [PMC free article] [PubMed] [Google Scholar]
- Palmer LM, Stuart GJ. Site of action potential initiation in layer 5 pyramidal neurons. J Neurosci. 2006;26(6):1854–1863. doi: 10.1523/JNEUROSCI.4812-05.2006. http://www.ncbi.nlm.nih.gov/pubmed/16467534. Accessed 31 Jan 2014. [DOI] [PMC free article] [PubMed] [Google Scholar]
- Parsons TD, et al. Long-term optical recording of patterns of electrical activity in ensembles of cultured Aplysia neurons. J Neurophysiol. 1991;66(1):316–333. doi: 10.1152/jn.1991.66.1.316. http://www.ncbi.nlm.nih.gov/pubmed/1919674. [DOI] [PubMed] [Google Scholar]
- Parsons TD, et al. Optical recording of the electrical activity of synaptically interacting Aplysia neurons in culture using potentiometric probes. Biophys J. 1989;56(1):213–221. doi: 10.1016/S0006-3495(89)82666-9. http://www.pubmedcentral.nih.gov/articlerender.fcgi?artid=1280466&tool=pmcentrez&rendertype=abstract. Accessed 13 Nov 2014. [DOI] [PMC free article] [PubMed] [Google Scholar]
- Popovic MA, et al. The spatio-temporal characteristics of action potential initiation in layer 5 pyramidal neurons: a voltage imaging study. J Physiol. 2011;589(Pt 17):4167–4187. doi: 10.1113/jphysiol.2011.209015. http://www.pubmedcentral.nih.gov/articlerender.fcgi?artid=3180577&tool=pmcentrez&rendertype=abstract. Accessed 31 Jan 2014. [DOI] [PMC free article] [PubMed] [Google Scholar]
- Rall W. Cellular mechanisms subserving changes in neuronal activity. In: Woody E, editor. Brain info. University of California; Los Angeles: 1974. [Google Scholar]
- Roberts M. Signals and systems: analysis using transform methods and MATLAB. McGraw-Hill; Professional, New York: 2004. [Google Scholar]
- Rohr S, Salzberg BM. Characterization of impulse propagation at the microscopic level across geometrically defined expansions of excitable tissue: multiple site optical recording of transmembrane voltage (MSORTV) in patterned growth heart cell cultures. J Gen Physiol. 1994;104(2):287–309. doi: 10.1085/jgp.104.2.287. http://www.pubmedcentral.nih.gov/articlerender.fcgi?artid=2229204&tool=pmcentrez&rendertype=abstract. [DOI] [PMC free article] [PubMed] [Google Scholar]
- Ross WN, Krauthamer V. Optical measurements of potential changes in axons and processes of neurons of a barnacle ganglion. J Neurosci. 1984;4(3):659–72. doi: 10.1523/JNEUROSCI.04-03-00659.1984. http://www.ncbi.nlm.nih.gov/pubmed/6707730 [Accessed Accessed November 13, 2014] [DOI] [PMC free article] [PubMed] [Google Scholar]
- Rowan MJM, Tranquil E, Christie JM. Distinct Kv channel subtypes contribute to differences in spike signaling properties in the axon initial segment and presynaptic boutons of cerebellar interneurons. J Neurosci. 2014;34(19):6611–6623. doi: 10.1523/JNEUROSCI.4208-13.2014. http://www.ncbi.nlm.nih.gov/pubmed/24806686. Accessed 12 Sept 2014. [DOI] [PMC free article] [PubMed] [Google Scholar]
- Sabatini BL, Oertner TG, Svoboda K. The life cycle of Ca(2+) ions in dendritic spines. Neuron. 2002;33(3):439–452. doi: 10.1016/s0896-6273(02)00573-1. http://www.ncbi.nlm.nih.gov/pubmed/11832230. [DOI] [PubMed] [Google Scholar]
- Sala C, Segal M. Dendritic spines: the locus of structural and functional plasticity. Physiol Rev. 2014;94(1):141–88. doi: 10.1152/physrev.00012.2013. http://www.ncbi.nlm.nih.gov/pubmed/24382885. Accessed 13 July 2014. [DOI] [PubMed] [Google Scholar]
- Salzberg BM. Optical recording of neuronal activity in an invertebrate central nervous system: simultaneous monitoring of several neurons. J Neurophysiol. 1977;40:1281–1291. doi: 10.1152/jn.1977.40.6.1281. [DOI] [PubMed] [Google Scholar]
- Salzberg B. Optical signals from giant axon following perfusion or superfusion with potentiometric probes. Biol Bull. 1978;155:463–464. [Google Scholar]
- Segev I, Rall W. Excitable dendrites and spines: earlier theoretical insights elucidate recent direct observations. Trends Neurosci. 1998;21(11):453–60. doi: 10.1016/s0166-2236(98)01327-7. http://www.ncbi.nlm.nih.gov/pubmed/9829684. [DOI] [PubMed] [Google Scholar]
- Shoham D, et al. Imaging cortical dynamics at high spatial and temporal resolution with novel blue voltage-sensitive dyes. Neuron. 1999;24(4):791–802. doi: 10.1016/s0896-6273(00)81027-2. http://www.ncbi.nlm.nih.gov/pubmed/10624943. [DOI] [PubMed] [Google Scholar]
- Shu Y, et al. Modulation of intracortical synaptic potentials by presynaptic somatic membrane potential. Nature. 2006;441(7094):761–5. doi: 10.1038/nature04720. http://www.ncbi.nlm.nih.gov/pubmed/16625207. Accessed 21 Jan 2014. [DOI] [PubMed] [Google Scholar]
- Shu Y, et al. Properties of action-potential initiation in neocortical pyramidal cells: evidence from whole cell axon recordings. J Neurophysiol. 2007;97(1):746–60. doi: 10.1152/jn.00922.2006. http://www.ncbi.nlm.nih.gov/pubmed/17093120. Accessed 31 Jan 2014. [DOI] [PubMed] [Google Scholar]
- Stuart GJ, Dodt HU, Sakmann B. Patch-clamp recordings from the soma and dendrites of neurons in brain slices using infrared video microscopy. Pflügers Arch. 1993;423(5–6):511–8. doi: 10.1007/BF00374949. http://www.ncbi.nlm.nih.gov/pubmed/8351200. Accessed 12 Nov 2014. [DOI] [PubMed] [Google Scholar]
- Stuart GJ, Sakmann B. Active propagation of somatic action potentials into neocortical pyramidal cell dendrites. Nature. 1994;367(6458):69–72. doi: 10.1038/367069a0. http://www.ncbi.nlm.nih.gov/pubmed/8107777. Accessed 12 Nov 2014. [DOI] [PubMed] [Google Scholar]
- Svoboda K, Tank DW, Denk W. Direct measurement of coupling between dendritic spines and shafts. Science (New York, N Y) 1996;272(5262):716–719. doi: 10.1126/science.272.5262.716. http://www.ncbi.nlm.nih.gov/pubmed/8614831. Accessed 24 Aug 2014. [DOI] [PubMed] [Google Scholar]
- Tønnesen J, et al. Spine neck plasticity regulates compartmentalization of synapses. Nat Neurosci. 2014;17(5):678–685. doi: 10.1038/nn.3682. http://www.ncbi.nlm.nih.gov/pubmed/24657968. Accessed 10 July 2014. [DOI] [PubMed] [Google Scholar]
- Vetter P, Roth A, Häusser M. Propagation of action potentials in dendrites depends on dendritic morphology. J Neurophysiol. 2001;85(2):926–37. doi: 10.1152/jn.2001.85.2.926. http://www.ncbi.nlm.nih.gov/pubmed/11160523. [DOI] [PubMed] [Google Scholar]
- Waggoner A, Grinvald A. Mechanisms of rapid optical changes of potential sensitive dyes. Ann N Y Acad Sci. 1977;303:217–242. [PubMed] [Google Scholar]
- Wang D, et al. Improved probes for hybrid voltage sensor imaging. Biophys J. 2010;99(7):2355–2365. doi: 10.1016/j.bpj.2010.07.037. http://www.pubmedcentral.nih.gov/articlerender.fcgi?artid=3042572&tool=pmcentrez&rendertype=abstract. Accessed 31 Jan 2014. [DOI] [PMC free article] [PubMed] [Google Scholar]
- Willadt S, et al. Combined optogenetics and voltage sensitive dye imaging at single cell resolution. Front Cell Neurosci. 2014;8:311. doi: 10.3389/fncel.2014.00311. http://www.pubmedcentral.nih.gov/articlerender.fcgi?artid=4189389&tool=pmcentrez&rendertype=abstract. Accessed 20 Nov 2014. [DOI] [PMC free article] [PubMed] [Google Scholar]
- Wu J, Cohen L, Falk C. Fast multisite optical measurement of membrane potential with two examples. In: Mason WT, editor. Fluorescence and luminescence probes for biological activity. Academic; London: 1999. [Google Scholar]
- Wuskell JP, et al. Synthesis, spectra, delivery and potentiometric responses of new styryl dyes with extended spectral ranges. J Neurosci Methods. 2006;151(2):200–215. doi: 10.1016/j.jneumeth.2005.07.013. http://www.ncbi.nlm.nih.gov/pubmed/16253342. Accessed 31 Jan 2014. [DOI] [PubMed] [Google Scholar]
- Yu Y, Shu Y, McCormick DA. Cortical action potential backpropagation explains spike threshold variability and rapid-onset kinetics. J Neurosci. 2008;28(29):7260–7272. doi: 10.1523/JNEUROSCI.1613-08.2008. http://www.pubmedcentral.nih.gov/articlerender.fcgi?artid=2664555&tool=pmcentrez&rendertype=abstract. Accessed 31 Jan 2014. [DOI] [PMC free article] [PubMed] [Google Scholar]
- Yuste R, Denk W. Dendritic spines as basic functional units of neuronal integration. Nature. 1995;375(6533):682–684. doi: 10.1038/375682a0. http://www.ncbi.nlm.nih.gov/pubmed/7791901. [DOI] [PubMed] [Google Scholar]
- Zecević D. Multiple spike-initiation zones in single neurons revealed by voltage-sensitive dyes. Nature. 1996;381(6580):322–325. doi: 10.1038/381322a0. http://www.ncbi.nlm.nih.gov/pubmed/8692270. Accessed 29 July 2014. [DOI] [PubMed] [Google Scholar]
- Zhou W-L, et al. Dynamics of action potential backpropagation in basal dendrites of prefrontal cortical pyramidal neurons. Eur J Neurosci. 2008;27(4):923–936. doi: 10.1111/j.1460-9568.2008.06075.x. http://www.pubmedcentral.nih.gov/articlerender.fcgi?artid=2715167&tool=pmcentrez&rendertype=abstract. Accessed 31 Jan 2014. [DOI] [PMC free article] [PubMed] [Google Scholar]
- Zhou W-L, et al. Intracellular long-wavelength voltage-sensitive dyes for studying the dynamics of action potentials in axons and thin dendrites. J Neurosci Methods. 2007;164(2):225–239. doi: 10.1016/j.jneumeth.2007.05.002. http://www.pubmedcentral.nih.gov/articlerender.fcgi?artid=2001318&tool=pmcentrez&rendertype=abstract. Accessed 31 Jan 2014. [DOI] [PMC free article] [PubMed] [Google Scholar]