Abstract
Articular cartilage lines the load-bearing surfaces of long bones and undergoes compositional and structural degeneration during osteoarthritis progression. Contrast enhanced microcomputed tomography (μCT) is being applied to a variety of preclinical models, including the mouse, to map structural and compositional properties in 3-D. The thinness (~30–50 μm) and high cellularity of mouse articular cartilage presents a significant imaging challenge. Our group previously showed that mouse articular cartilage and proteoglycan (PG) content can be assessed by μCT with the ioxagalate-based contrast agent Hexabrix, but the voxel size used (6 μm) was deemed to be barely adequate. The objective of the present study is to assess the utility of a novel contrast agent, CA4+, to quantify mouse articular cartilage morphology and composition with high resolution μCT imaging (3 μm voxels) and to compare the sensitivity of CA4+ and Hexabrix to detect between-group differences. While both contrast agents are iodine-based, Hexabrix is anionic and CA4+ is cationic so they interact differently with negatively charged PGs. With CA4+, a strong correlation was found between non-calcified articular cartilage thickness measurements made with histology and μCT (R2 = 0.72, p < 0.001). Cartilage degeneration – as assessed by loss in volume, thickness and PG content – was observed in 34-week old mice when compared to both 7- and 12-week old mice. High measurement precision was observed with CA4+, with the coefficient of variation after repositioning and re-imaging samples equaling 2.8%, 4.5%, 7.4% and 5.9% for attenuation, thickness, volume, and PG content, respectively. Use of CA4+ allowed increased sensitivity for assessing PG content compared to Hexabrix, but had no advantage for measurement of cartilage thickness or volume. This improvement in imaging should prove useful in preclinical studies of cartilage degeneration and regeneration.
Keywords: articular cartilage, contrast agent, micro-computed tomography, mouse
Graphical abstract
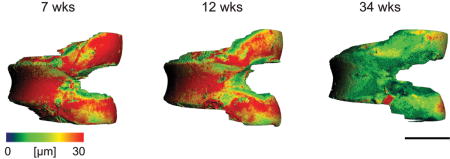
The thinness of mouse articular cartilage presents a significant imaging challenge, however contrast enhanced (μCT) can be utilized to map structural and compositional properties of cartilage in 3-D to study osteoarthritis progression. In this study, we validated a technique using CA4+, a cationic contrast agent, to quantify cartilage degeneration due to aging. Use of CA4+ allowed increased sensitivity for assessing proteoglycan content compared to Hexabrix. This improvement in imaging should prove useful in preclinical studies of cartilage degeneration and regeneration.
Introduction
Osteoarthritis (OA) affects about one-third of the population over the age of 65 in the United States1. Initiation, progression and severity of this joint disease are influenced by a number of factors, including gender, genetics, life style and aging2–4. End-stage disease is characterized by loss of articular cartilage, meniscal damage, as well as bone remodeling, including subchondral sclerosis and osteophyte formation5–7. Proteolytic degradation of the cartilage extracellular matrix, predominantly aggrecan and fibrillar collagens, underlies the loss of the tissue structure and function8–10. Aggrecan consists of a core protein which is extensively substituted with polyanionic glycosaminoglycan (GAG). Spatial organization of aggrecan into large aggregates on hyaluronan networks provides cartilage with resistance to compressive force due to their osmotic properties8,9. Changes in proteoglycan (PG) concentration or overall charge can lead to changes in mechanical properties and degradation of cartilage, therefore explaining the importance of monitoring PG content in OA studies11,12.
Murine models are extensively used to examine OA pathogenesis and in preclinical therapeutic screening studies, due to the development of reproducible surgical procedures for disease induction and availability of genetic models13–15. However, analysis of the cartilage in mouse models is challenging due to the small size of the joints and thinness of the articular cartilage. One imaging modality that allows sufficient resolution for quantifying mouse cartilage morphology and PG content is micro-computed tomography (μCT)16–18.
This nondestructive 3-D imaging technique is capable of very high resolution (voxels as small as 0.5 μm). μCT is used extensively to quantify bone morphometry. Since cartilage does not attenuate x-rays readily, contrast agents are utilized, such as the ioxaglate-based contrast agent, Hexabrix16,17,19. Its anionic nature causes it to be repelled by negatively charged molecules, such as GAG chains on aggrecan and, therefore, exhibits an inverse relationship with PG content19,20. Other metal-based contrast agents such as Microfil and phosphotungstic acid have been used to assess articular cartilage morphology, but these contrast agents are not well-suited for cartilage compositional analysis17,21. A novel contrast agent, CA4+, developed by Grinstaff et al, is an iodine-based agent that is electrostatically attracted to GAGs, thereby allowing direct assessment of PG content22.
CA4+ has been used in bovine and rabbit models where the articular cartilage is typically more than 100 μm thick23,24. Moreover, a recent study showed this agent can be used to measure GAG content of murine tibial plateau cartilage18. In the present study, we extend the use of CA4+ enhanced μCT imaging to validate morphology and compositional measurements of murine femoral articular cartilage. Although mouse models are extensively used to study OA; 3-D assessment of morphology and composition in this species has been limited16–18. Here, we validate the applicability of CA4+ for murine cartilage assessment by establishing the concentration and minimum incubation time, and determining the accuracy and precision of μCT-based measurements of articular cartilage volume, thickness and PG content compared to standard histomorphometric determinations using Safranin-O histology. We also compare the sensitivity of Hexabrix and CA4+ to assess between-group differences in articular cartilage morphology and composition.
Methods
Animal tissue
Female C57BL/6 mice from an in-house colony were used in all experiments. All animals were on a 12 hour light/dark cycle with free access to food. Animals were aged to either 7, 12 or 34 weeks, depending on the experiment and were euthanized with CO2 inhalation, in accordance with the Institutional Animal Care and Use Committee procedures at Rush University Medical Center. After sacrifice, hind limbs were harvested and fixed in 10% neutral buffered formalin for three days and stored in 70% EtOH at 4 °C until μCT scanning. Immediately before scanning, the knee joints were disarticulated and the soft tissue adherent to the distal femur was carefully removed. A total of 101 femurs obtained from 59 mice were used for all experiments conducted in this study. Femurs were randomly selected for each experiment.
Contrast agent
CA4+ was synthesized by the Grinstaff lab according to a previously published protocol and shipped to Rush University Medical Center25. Solution osmolality and pH were maintained at 400 mOsm/kg and 7.4, respectively, at solution concentrations of 6, 12, 24 and 48 mg/mL. During incubation, the distal femur was placed in a 1.5 mL micro-centrifuge tube filled with 1 mL of CA4+ overnight (except as noted below) at 4°C.
μCT scanning
Femurs were blotted on tissue paper to remove excess liquid and rigidly fixed within a μCT scanning holder, which was then sealed. Approximately 0.5 mL of 1x PBS was placed in the bottom of the holder to provide a humid environment and avoid sample dehydration. All samples were scanned in air, to avoid diffusion of the contrast agent from the cartilage into solution during imaging. Scanner settings were a voltage of 45 kVp, current of 200 μA, integration time of 1000 ms and a voxel size of 3 μm (Scanco Medical μCT50, Basserdorf, Switzerland). See supplementary data for scanner optimization data (Supplementary Fig.1&2).
Segmentation and analysis
600 slices were acquired in the transverse plane and were rotated to the sagittal plane for cartilage semi-automatic segmentation. Slices were contoured to include subchondral bone, calcified cartilage, the non-calcified articular cartilage and air (Supplemental Fig. 3, left panel). Histograms, in linear attenuation units, were made using the manufacturer’s software and showed three peaks: (i) bone and calcified cartilage, (ii) articular cartilage and (iii) air. Optimal thresholds separating the 3 peaks were chosen through the manufacturer’s script (Adaptive Thresholding, Scanco). For quantitative characterization of articular cartilage morphology, the manufacturer’s software was used to calculate articular cartilage thickness and volume with a sphere fitting method using an OpenVMS IPL script. The average attenuation was calculated over the entire articular cartilage volume using MATLAB, representing the average PG density of the specimen (μCT attenuation values, cm−1). PG content for the articular cartilage was represented by multiplying the average attenuation by volume (units: mm2)
Optimal CA4+ concentration
To determine the optimal concentration of CA4+, 12 left femurs from 12-week old mice were divided into 4 concentration groups (6, 12, 24 and 48 mg/mL of CA4+). Each femur was scanned twice, once before and once after incubation in one of the concentrations of CA4+. All samples were incubated overnight in CA4+ to ensure complete saturation of the articular cartilage. The optimal concentration was defined as the concentration that gave the largest separation between the bone/calcified cartilage, articular cartilage and air peaks in the linear attenuation coefficient histograms. The signal-to-noise (SNR, ) and contrast-to-noise (CNR, ) was also calculated for all samples. To determine how well CA4+ was desorbed from the cartilage, the femurs which had been incubated in the optimal concentration were bathed in 2 mL of PBS overnight and rescanned. The attenuation from the three scans (before CA4+ immersion, after CA4+ immersion and after CA4+ desorption) were compared.
Diffusion kinetics of CA4+
To assess diffusion kinetics, five right femurs from 12-week old mice were scanned and then incubated in CA4+ (12 mg/mL) for variable lengths of time (5, 10, 20, 30, 60, 90 and 240 minutes) and rescanned. The average attenuation of the cartilage was normalized to its maximum attenuation in order to compare relative change in cartilage attenuation over time. Normalized attenuations were averaged over the samples at each time point and an exponential model was used to characterize diffusion of CA4+ into the cartilage.
Trypsin digestion of femoral cartilages for PG removal
Left and right femurs of 15–12-week old mice were randomly assigned to digestion or non-digested (control) groups. Femurs were carefully dissected and controls were placed immediately into 10% neutral buffered formalin for fixation for three days and then stored in 70% EtOH at 4 °C. The contralateral femurs were placed into 500 μL micro-centrifuge tubes with 50 μL trypsin solution (Gibco 0.5% Trypsin, 0.2% EDTA) for incubation at 37°C for 2, 4 or 8 hours. Digested femurs were rinsed with PBS containing 5% fetal bovine serum to terminate enzymatic activity, and fixed in 10% formalin for three days and then stored in 70% EtOH at 4 °C. Specimens were incubated with CA4+ and scanned with μCT, according to settings described above. The average articular cartilage attenuation, thickness and volume were compared between control and digested samples. A separate set of samples was digested for 1, 4, 8 and 24 hours for histology. For the 8 and 24 hour digestions, two or three consecutive 4-hour digestions were performed replenishing trypsin to ensure enzymatic activity throughout the time course.
Effect of skeletal maturation and aging on articular cartilage morphology and composition
Right femurs from mice of ages 7, 12 and 34 weeks (n = 10/age group) were used since we expected cartilage thinning with age16. Each femur was incubated overnight in CA4+ (12 mg/mL), scanned and analyzed as described above.
Thickness measurement validation
After μCT scanning, the 10 femurs from the 7-week old mice were decalcified, paraffin embedded, sectioned at a thickness of 6 μm and mounted onto silane coated glass slides (Gold Seal UltraStick, ThermoFisher). Sagittal sections (n=3) from the central portions of the medial condyle, lateral condyle and patellar groove were stained with Safranin-O/Fast Green. Only sections without folds were examined (total sections measured = 21) with OsteoMeasure (Osteometrics, Georgia) on a Nikon microscope with a 20x objective. Measurements of articular cartilage thickness were made every 50 μm throughout the extent of the joint surface (80–100 measurements per section). The average thickness measurement from μCT was made by analyzing 21 μCT slices centered around the matched histology section (Supplemental Figure 1). All measurements were made by one observer and the intra-observer coefficient of variation, measured by repeating thickness measurements on 5 samples, was found to be 9% for histology and 5% for μCT.
Precision of CA4+ imaging and comparison of sensitivity of CA4+ and Hexabrix imaging
To measure the precision of CA4+ enhanced μCT, 5 femurs from each age group were scanned as part of the aging study (trial 1), desorbed in PBS overnight, incubated in CA4+ overnight (12 mg/mL) and rescanned after repositioning (trial 2). Precision was quantified by calculating the difference between the trial 1 and trial 2 scans and determining the coefficient of variation (the standard deviation of the mean difference divided by the mean difference)26.
For assessing the sensitivity to measure cartilage characteristics with CA4+ and Hexabrix, 4 femurs were incubated in Hexabrix (Mallinckrodt Inc., St. Louis, MO) at a concentration of 15% (v/v) in accordance with our previously established method and compared to the 5 CA4+ samples from trial 1 (mentioned above)16. All scans were performed using the same settings (45 kVp, 200 μA, 1000 ms integration time and 3 μm voxel size). The means and standard deviations for thickness, volume and attenuation were used to calculate the sample sizes needed to detect between-group differences in the range of 1% to 25% with β = 0.80 and α = 0.050 (PS, Dupont-Plummer)27.
Statistical Analysis
To quantify the diffusion kinetics for CA4+, we utilized an exponential model to fit the increase in attenuation with increasing incubation time. Paired t-tests were used to compare the average histology and μCT thickness measurements. Linear regression analysis was performed to quantify the correlation between μCT-derived and histologically-derived cartilage thickness measurements. Bland-Altman analysis was also performed on μCT and histology thickness measurements to determine agreement between both imaging modalities. Repeated measures ANOVA with LSD post-hoc analysis for group effect and paired t-test for comparison at each digest time were used to determine if differences existed for the CA4+ desorption experiment. To measure differences in cartilage characteristics due to age, we performed one-way ANOVA with LSD post-hoc tests. A p-value less than 0.050 indicated significance.
Results
Optimization of CA4+ concentration and diffusion kinetics
The linear attenuation coefficient histograms were analyzed to determine which concentration (1) had the best SNR and CNR and (2) demonstrated the best separation between the bone/calcified cartilage, non-calcified cartilage and air peaks. Of the 4 concentrations tested, 24 mg/ml provided the highest SNR and CNR, however the cartilage and bone peaks were nearly merged (Fig. 1). The concentration that provided the best separation for all samples tested was the 12 mg/ml concentration, while either air/non-calcified cartilage or bone/calcified cartilage and non-calcified cartilage were poorly separated in at least one sample with the other three concentrations. Therefore 12 mg/ml was utilized in all further studies.
Figure 1.
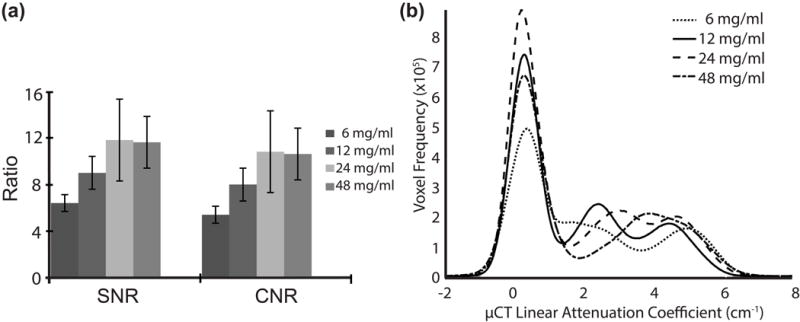
(a) SNR and CNR results from the varying concentrations and (b) μCT image histograms of representative samples from varying CA4+ concentrations (6, 12, 24, and 48 mg/mL).
To determine if CA4+ could be fully removed from the non-calcified cartilage, samples from the 12 mg/mL group were desorbed overnight in 1x PBS and rescanned (Fig. 2). A significant effect was found (p = 0.013) from repeated measures ANOVA between the 3 scans (pre-CA4+, post-CA4+ and desorbed). Post-hoc analysis found significant differences between pre-CA4+ and post-CA4+ (p = 0.024) and post-CA4+ and desorbed scans (p = 0.022). However no significant difference was found between pre-CA4+ and desorbed scans (p = 0.452), indicating successful removal of contrast agent from the samples.
Figure 2.
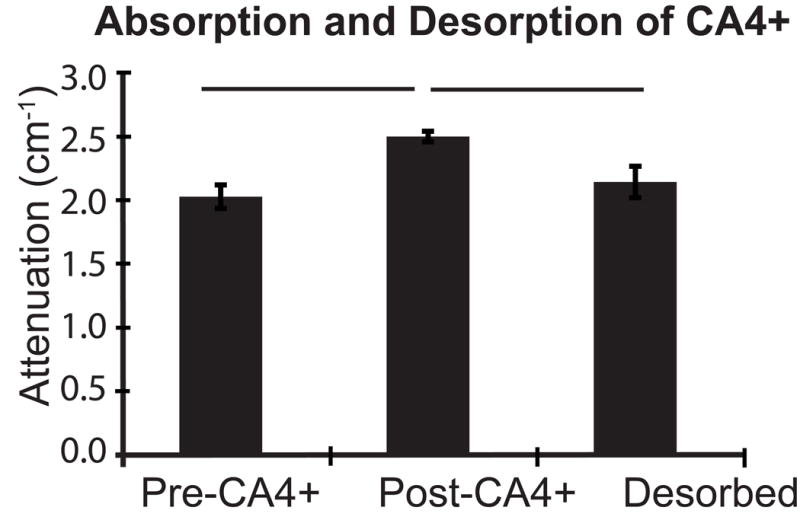
Mean linear attenuation coefficient and standard deviations for 3 femurs which were scanned before and after overnight immersion in CA4+ followed by an overnight desorption in 1x PBS; bars indicate p < 0.050.
To assess the diffusion kinetics, 5 femurs were scanned at varying times of immersion in CA4+ and the normalized attenuation values were fit with an exponential model (Fig. 3). From this curve it can be concluded that a mouse femur should be immersed in CA4+ for a minimum of 40 minutes prior to μCT scanning.
Figure 3.
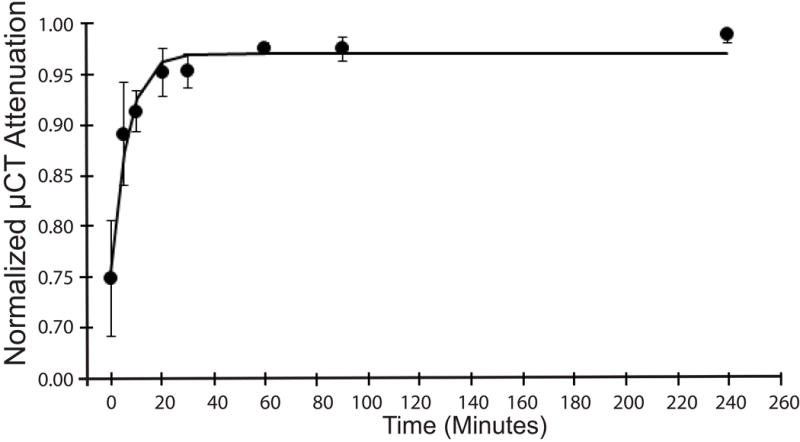
Diffusion kinetics of CA4+ in mouse articular cartilage quantified by serially immersing mouse femurs (n = 5) in CA4+ and scanning at the following time points 0, 5, 10, 20, 30, 60, 90 and 240 minutes. Data were fit to an exponential mode and the time constant tau was found to be 6.3 minutes.
Validation of μCT thickness measurements
Validation of μCT thickness measurements was limited to femurs obtained from 7 week old mice because the tidemark was not consistently identifiable in the histology sections of the older mice (Fig. 4).
Figure 4.
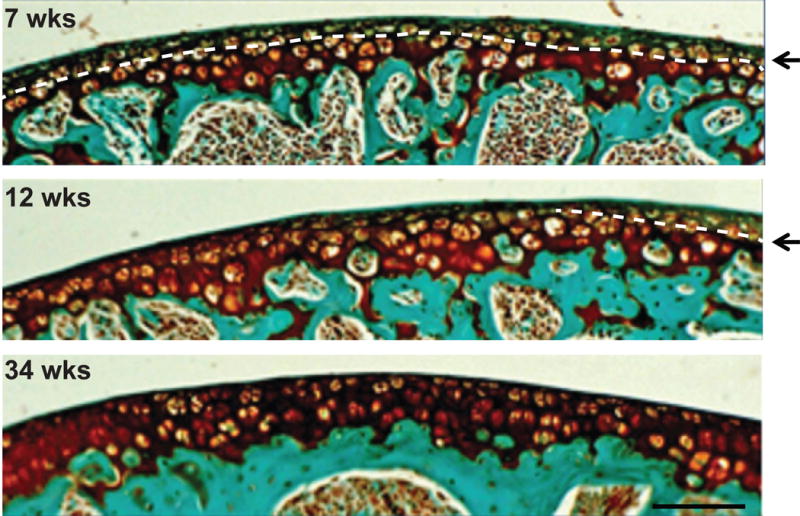
Representative Safranin-O stained histology images showing the ease of tidemark identification at 7-weeks as compared to 12- and 34-weeks of age (arrows and dotted line indicated tidemark). At 34- weeks of age, it is nearly impossible to differentiate between calcified cartilage and articular cartilage.
Measurements made with histology and μCT were not different (p = 0.523, paired t-test, Fig. 5a); and a significant correlation was found between both modalities (R2 = 0.72, p < 0.001, Fig. 5b). Mean differences between thickness measurements made with both modalities were assessed using the Bland-Altman test and indicated the two techniques can be used interchangeably, as no bias was observed and the confidence interval was centered around 0.0 μm (95% C.I.: −3.6 – 4.1 μm).
Figure 5.
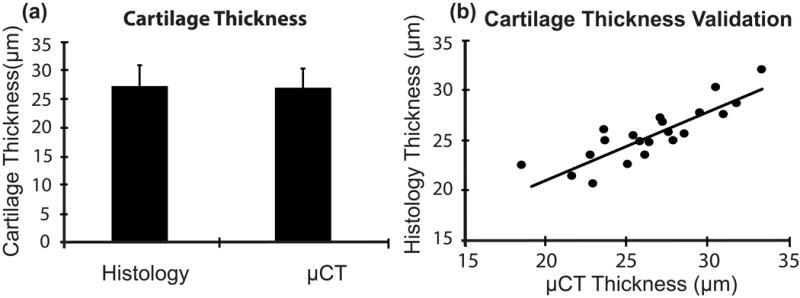
(a) Average non-calcified cartilage thickness + standard deviation of specimens from 7-week old mice (21 sections from 10 femurs) measured using histology (27.01 μm) and μCT (26.73 μm); (b) correlation between μCT-derived and histology-derived cartilage thickness measurements (R2 = 0.72, p < 0.001). For these analyses, each histology section was considered to be an independent observation.
Alteration in non-calcified cartilage attenuation following depletion of PG with trypsin
To determine the ability of μCT to detect changes in PG content, femurs (n = 5/group) were digested with trypsin, as described in the Methods. Contralateral femurs were not exposed to the protease and used as undigested controls. PG digestion was monitored by histological evaluation using Safranin-O staining, and examples of undigested, 1, 4, 8 and 24 hr digested specimens are shown in Figure 6.
Figure 6.
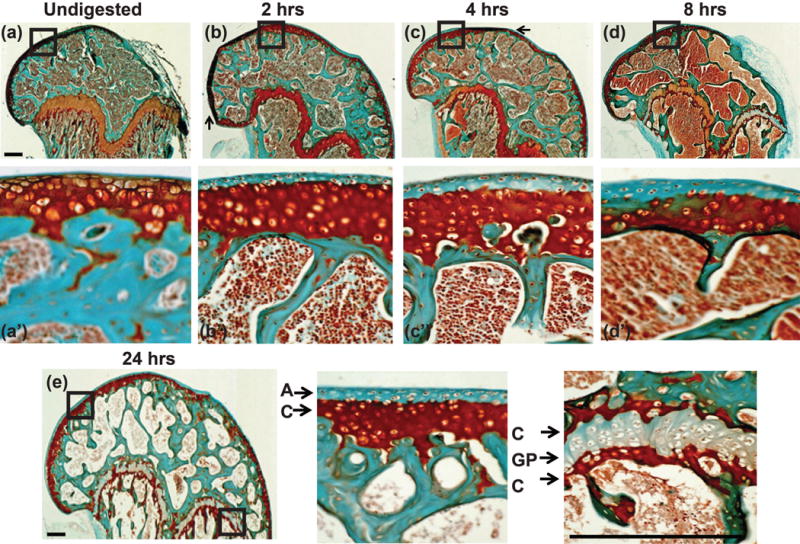
Safranin-O and Fast Green stained section of distal mouse femur post trypsin digestion for (a, a′) undigested, (b, b′) 1, (c, c′) 4, (d, d′) 8 and (e, e′, e″) 24 hours. Close up of boxed regions can be seen in a′, b′, c′, d′, e′, and e″. Dark red stain indicates the presence of PG molecules. The articular cartilage was almost completely depleted of PG after 1 hour of trypsin digestion across the entire distal femur, scale bar = 0.25 mm. Small arrows (a–d) indicate regions with folding artifact.
Notably, the protease only cleared PG from the superficial aspect of the distal femur surface even after 24 hours of incubation (Fig. 6a′–e′). PG depletion from the growth plate region did not change after 8 hours. The presence of intense Safranin-O stained zones at both the proximal and distal borders of the growth plate and deep to the tidemark at the articular surface suggests resistance to PG digestion in calcified cartilage.
On average for all digestion times, the treated femurs had 14% lower attenuation and 29% lower PG content, respectively, than the contralateral control femurs (Fig. 7a, b). However, there were no differences for cartilage volume (p = 0.103) or thickness (p = 0.465) between the control and digested samples (Fig. 7c). No significant differences for attenuation, PG content or non-calcified cartilage morphology were observed between the digestion times (p > 0.100).
Figure 7.
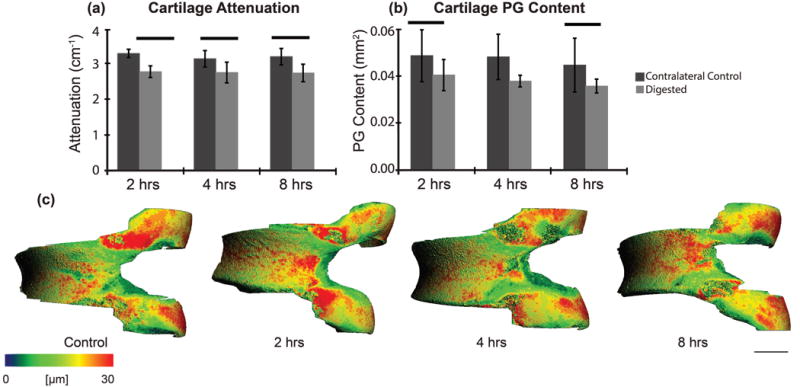
Articular cartilage (trypsin sensitive layer) (a) attenuation (p < 0.001) and (b) PG content (p = 0.001) post-trypsin digestion at 2, 4 and 8 hours compared to the contralateral controls and (c) representative thickness maps for control and digested samples. Bars indicate p < 0.050 and scale bar = 0.5 mm.
Changes in femoral articular cartilage during skeletal maturation and aging
Femurs from three age groups (7, 12, 34 week old mice; n = 10/group) were analyzed. μCT imaging showed that 34-week old mice had 10% and 12% increased average attenuation compared to the 7-week (p = 0.003) and 12-week old mice (p = 0.001), respectively (Fig. 8a). The 34-week old mice had 20% and 25% less PG content than the 7-week old (p = 0.027) and 12-week old mice (p = 0.006), respectively (Fig. 8b). The 34-week old mice had 33% (p = 0.005) and 43% (p = 0.001) less non-calcified cartilage volume than the 7-week and 12-week old mice, respectively (Fig. 8d) and 21% (p = 0.002) and 20% (p = 0.003) thinner cartilage compared to 7-week and 12-week old mice, respectively (Fig. 8d). No significant differences were found for x-ray attenuation (p = 0.513), PG content (p = 0.527), cartilage thickness (p = 0.889) or volume (p = 0.385) between the 7-week and 12-week old mice.
Figure 8.
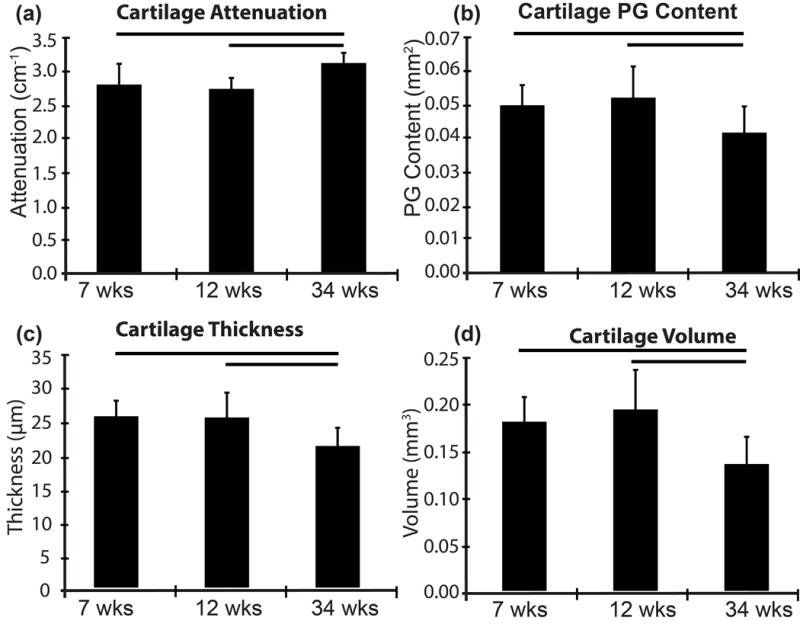
Alterations in (a) Mean linear attenuation (b) PG content (c) thickness and (d) volume of non-calcified articular cartilage due to age measured by μCT. Bars indicates p < 0.010.
To understand why the μCT attenuation was higher in older mice, which contradicts previously published findings16 of decreased attenuation in aged rodent femoral cartilage, sections from each age group were stained with Safranin-O. The femoral cartilage from 7 and 12-week old mice had frequent areas of low PG content in the superficial non-calcified cartilage layer, which were absent in sections from 34-week old mice (Fig. 9). The μCT attenuation is averaged over the entire non-calcified cartilage volume, meaning that the average attenuation for the younger animals was decreased because of the larger volumes.
Figure 9.
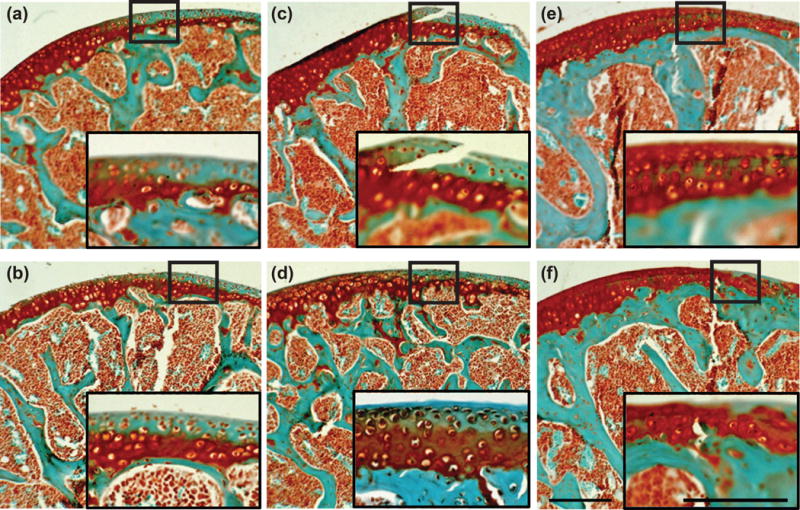
Safranin-O and Fast Green stained distal femur sections of (a. b) 7-, (c, d) 12- and (e, f) 34-week old mice. Zoomed in sub-images depict areas of low PG content in the non-calcified articular cartilage at 7- and 12-weeks as compared to 34-weeks which has a relatively small region of low PG content. Scale bars = 0.25 mm.
Representative 3-D images of each age group showed that between 7 and 12 weeks of age, thinning of cartilage had occurred mainly in the femoral condyles (Fig. 10). However, at 34 weeks, cartilage thinning was also apparent across the entire patellar groove. This agrees with the histological findings that by 34 weeks the majority of the non-calcified cartilage was lost.
Figure 10.
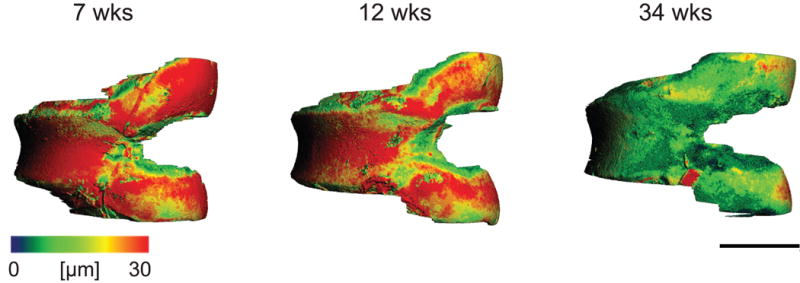
Representative non-calcified articular cartilage thickness maps for 7 week, 12 week, and 34 week old mice. Scale bar = 1 mm.
μCT precision with CA4+
To measure precision, 5 samples from each age group were desorbed and placed in CA4+ overnight, repositioned and rescanned with μCT. No significant differences were found between any of the quantified cartilage characteristics. The coefficients of variation were 2.8% for attenuation, 4.5% for thickness, 7.4% for volume, and 5.9% for PG content.
Sensitivity of CA4+ and Hexabrix for detecting between-group differences
Sensitivity or the ability to distinguish between-group differences of cartilage characteristics was compared between CA4+ (n=5) and Hexabrix (n = 4, Fig 11). CA4+ and Hexabrix-enhanced μCT imaging yielded similar sensitivities in detecting between-group differences for cartilage thickness and volume (Fig. 11a and 11b). However, CA4+ had better sensitivity than Hexabrix for assessing between-group PG differences (Fig. 11c).
Figure 11.
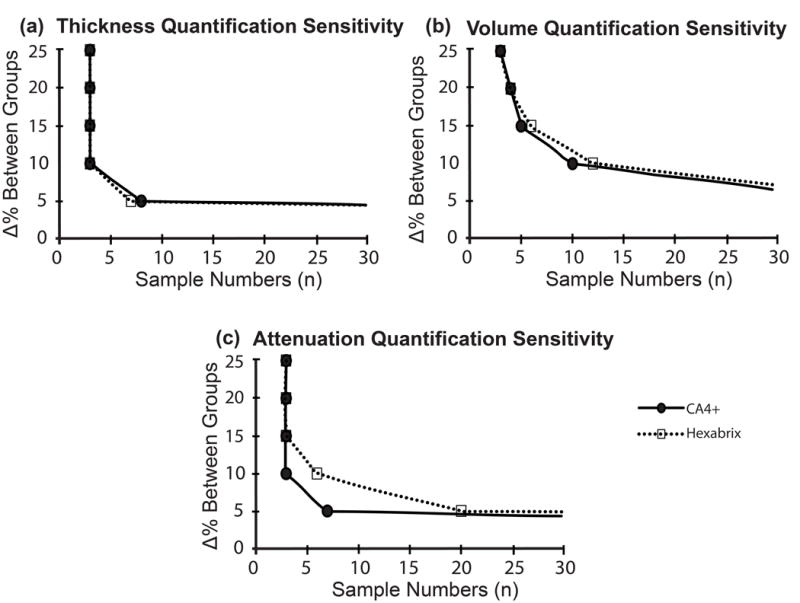
Power analysis was performed using the average and standard deviation of each method (power = 0.8 and α = 0.05), and the number of samples required to detect a difference ranging from 1–25% was calculated for (a) cartilage thickness, (b) cartilage volume and (c) μCT attenuation.
Discussion
In this study we demonstrated the ability of high resolution CA4+ enhanced μCT to accurately measure mouse articular cartilage morphology and composition with high precision. A minimum incubation time of 40 minutes at a concentration of 12 mg/mL was sufficient as compared to 5 hours in rabbit and 24 hours in bovine23,24, similar to Lakin et al. findings in mouse tibial plateau18. In this study we validated μCT derived morphology measurements and demonstrated the ability of CA4+ to increase the measurement sensitivity compared to Hexabrix for measuring PG content, thus supporting a reduced number of samples needed in preclinical studies.
Articular cartilage is usually defined as the non-calcified cartilage covering the calcified cartilage and subchondral bone. Histologically, the delineation between non-calcified cartilage and the calcified cartilage is readily determined in larger animals because the tidemark is usually regions in the mouse joint due to inconsistencies in the demarcation of the tidemark. Along with Saf-O staining, we also performed H&E staining (data not shown), but differentiating the tidemark remained difficult. Our histological analysis after trypsin digestion of intact femurs demonstrated that PGs were almost completely removed from the non-calcified cartilage and growth plate cartilages only within 1 hour. Hence, when performing histological evaluation of mouse joints, it is important to consider that substantial portion of Safranin-O positive ‘articular cartilage’ is made up of calcified cartilage. For femoral cartilages, only a 10–40 μm deep layer of (non-calcified) articular cartilage is covering the subchondral bone areas. A corresponding decrease in PG content was observed with μCT, however there were no changes in structural measurements between digested and control samples indicating μCT-based measurements characterize the non-calcified cartilage layer of the distal femur, excluding the calcified cartilage zone. Hence, compared to histology, a major advantage of μCT is a reduction in user-induced variability in morphology and compositional measurements. Other important advantages of μCT are that the measurements are inherently three-dimensional and do not rely on sampling relatively small regions of the tissue.
The increase in resolution and CA4+ caused a reduction in measurement variability by nearly 50% with this technique as compared to our previous established technique with Hexabrix16. This improvement could be due to the contrast agent and/or the increase in resolution (use of 3 μm as opposed to 6 μm voxels). When Hexabrix and CA4+ were directly compared at high resolution (3 μm voxel size), there were no differences in the morphology measurements, however CA4+ provided a higher sensitivity to quantify compositional measurements. Thus, the increase in resolution most likely reduced the variability in measuring cartilage morphology regardless of contrast agent, but CA4+ reduced the variability in measuring compositional differences compared to Hexabrix.
Several contrast-enhanced μCT imaging techniques have been established recently to quantify cartilage characteristics. Hexabrix is the most commonly used contrast agent for such studies20,28–30. Due to the anionic charge of Hexabrix, it is repelled by PG molecules in cartilage and, therefore, provides an indirect measurement of PG content. However, CA4+ has a strong cationic charge and, therefore, is attracted to anionic glycosaminoglycans (and possibly oligosaccharides) substituted on PG core proteins and thus has a direct relationship to the contents of these macromolecular components of the cartilage matrix. This difference in charge probably accounts for the increased sensitivity for measuring PG content when using CA4+ compared to Hexabrix, in agreement with a previous report for human articular cartilage31. Lakin et al have recently demonstrated that a strong correlation exists between CA4+ μCT attenuation and GAG content and material elastic properties in the mouse tibial plateau18.
Articular cartilage is known to undergo degradation due to aging. Studies have shown: (1) an increase in the stiffness of the cartilage matrix, (2) a decrease in permeability and (3) reduction in thickness with age in mouse models32–34. Although we were able to observed cartilage thinning between 12-week old mice and 34-week old mice, we did not observe any differences between 7 and 12-week old mice. Previous contrast enhanced μCT studies using 8 and 16-week old mice19 and 6 and 14-week old mice16, found significant decreases in global thickness and volume and increases in attenuation. The 7 and 12 week old mice used here may have been too close in terms of skeletal maturation stages to show significant differences35. We did, however, notice apparent local cartilage thinning at 12 weeks compared to 7 weeks in the femoral condyles. Sub-compartmental quantification was not conducted in this study, but represents the focus of ongoing studies in relation to injury- and ageing- induced changes in the knee joint cartilages of C57BL/6 mice.
In conclusion, we validated the novel cationic contrast agent CA4+ for μCT-based measurement of mouse cartilage and demonstrated high accuracy and precision. CA4+ enhanced μCT imaging provided a sensitive method to measure both composition and morphology of mouse articular cartilage. The establishment of this technique in the mouse allows for (1) improved specificity and sensitivity of measuring compositional and morphological characteristics of articular cartilage (non-calcified cartilage) as compared to traditional histological assessment and (2) the ability to produce a 3-D map of the entire articular surface. This technique may prove useful in delineating bone/calcified cartilage and articular cartilage to assess concurrent and/or temporal and spatially distinct remodeling events during development and progression of OA.
Supplementary Material
Acknowledgments
Research reported in this paper was supported by the National Institutes of Health under award number R01-AR057066 and The Katz-Rubschlager Endowment of OA Research. The content is solely the responsibility of the authors and does not necessarily represent the official views of the National Institutes of Health.
Footnotes
DRS, AP, MWG, MM and MMM conceived and designed the experiments. MM, MMM, DC and JL performed the experiments. MM and DC analyzed the data. JDF, BDS and MWG contributed reagents and materials. MM, DC, AP and DRS wrote the manuscript. MM, MMM, DC, JL, JDF, BDS, MWG, AP and DRS have read and approved the final version.
References
- 1.Zhang Y, Jordan JM. Epidemiology of osteoarthritis. Clin Geriatr Med. 2010;26:355–369. doi: 10.1016/j.cger.2010.03.001. [DOI] [PMC free article] [PubMed] [Google Scholar]
- 2.Murphy L, et al. Lifetime risk of symptomatic knee osteoarthritis. Arthritis Rheum. 2008;59:1207–1213. doi: 10.1002/art.24021. [DOI] [PMC free article] [PubMed] [Google Scholar]
- 3.Felson DT, et al. The prevalence of knee osteoarthritis in the elderly: the framingham osteoarthritis study. Arthritis & Rheumatism. 1987;30:914–918. doi: 10.1002/art.1780300811. [DOI] [PubMed] [Google Scholar]
- 4.Abramson SB, Attur M. Developments in the scientific understanding of osteoarthritis. Arthritis Res Ther. 2009;11:227. doi: 10.1186/ar2655. [DOI] [PMC free article] [PubMed] [Google Scholar]
- 5.Glyn-Jones S, et al. Osteoarthritis. Lancet. 2015;386:376–387. doi: 10.1016/S0140-6736(14)60802-3. [DOI] [PubMed] [Google Scholar]
- 6.Hayami T, et al. Characterization of articular cartilage and subchondral bone changes in the rat anterior ccruciate ligament transection and meniscectomized models of osteoarthritis. Bone. 2006;38:234–243. doi: 10.1016/j.bone.2005.08.007. [DOI] [PubMed] [Google Scholar]
- 7.Burr DB, Gallant MA. Bone remodelling in osteoarthritis. Nature Reviews Rheumatology. 2012;8:665–673. doi: 10.1038/nrrheum.2012.130. [DOI] [PubMed] [Google Scholar]
- 8.Buckwalter JA, Mankin HJ, Grodzinsky AJ. Articular cartilage and osteoarthritis. Instr Course Lect. 2005;54:465–480. [PubMed] [Google Scholar]
- 9.Roughley PJ. The structure and function of cartilage proteoglycans. Eur Cell Mater. 2006;12:92–101. doi: 10.22203/ecm.v012a11. [DOI] [PubMed] [Google Scholar]
- 10.Goldring MB, Marcu KB. Cartilage homeostasis in health and rheumatic diseases. Arthritis Res Ther. 2009;11:224. doi: 10.1186/ar2592. [DOI] [PMC free article] [PubMed] [Google Scholar]
- 11.Cs-Szabo G, Roughley PJ, Plaas AH, Glant TT. Large and small proteoglycans of osteoarthritic and rheumatoid articular cartilage. Arthritis Rheum. 1995;38:660–668. doi: 10.1002/art.1780380514. [DOI] [PubMed] [Google Scholar]
- 12.Kuettner KE. In: Rhematology. Klippe JH, Dieppe PA, editors. Mosby-Year Book Europe Limited; 1994. pp. 1–6. Ch. 6. [Google Scholar]
- 13.Plaas A, et al. Intraarticular TGFb1 and treadmill running results in synovitis, chondrophyte formation and cartilage erosion in murine knee joints. Ablation of ADAMTS5 prevents pathogenic tissue remodeling and promotes chondrogenic responses, including articular cartilage growth in treated knee joints. Journal of Orthopaedic Research. 2010 [Google Scholar]
- 14.Glasson SS, Blanchet TJ, Morris EA. The surgical destabilization of the medial meniscus (DMM) model of osteoarthritis in the 129/SvEv mouse. Osteoarthritis Cartilage. 2007;15:1061–1069. doi: 10.1016/j.joca.2007.03.006. [DOI] [PubMed] [Google Scholar]
- 15.Fassler R, et al. Mice lacking alpha 1 (IX) collagen develop noninflammatory degenerative joint disease. Proc Natl Acad Sci U S A. 1994;91:5070–5074. doi: 10.1073/pnas.91.11.5070. [DOI] [PMC free article] [PubMed] [Google Scholar]
- 16.Kotwal N, Li J, Sandy J, Plaas A, Sumner DR. Initial application of EPIC-æCT to assess mouse articular cartilage morphology and composition: effects of aging and treadmill running. Osteoarthritis & Cartilage. 2012;20:887–895. doi: 10.1016/j.joca.2012.04.012. [DOI] [PMC free article] [PubMed] [Google Scholar]
- 17.Gu XI, et al. High reolution micro Arthrography of hard and soft tissue in a murine model. Osteoarthritis & Cartilage. 2012;20:1011–1019. doi: 10.1016/j.joca.2012.05.004. [DOI] [PMC free article] [PubMed] [Google Scholar]
- 18.Lakin BA, et al. Contrast-enhanced CT using a cationic contrast agent enables non-destructive assessment of the biochemical and biomechanical properties of mouse tibial plateau cartilage. Journal of orthopaedic research : official publication of the Orthopaedic Research Society. 2016;34:1130–1138. doi: 10.1002/jor.23141. [DOI] [PMC free article] [PubMed] [Google Scholar]
- 19.Xie L, Lin AS, Levenston ME, Guldberg RE. Quantitative assessment of articular cartilage morphology via EPIC-microCT. Osteoarthritis Cartilage. 2009;17:313–320. doi: 10.1016/j.joca.2008.07.015. [DOI] [PMC free article] [PubMed] [Google Scholar]
- 20.Kerckhofs G, Sainz J, Wevers M, Van de Putte T, Schrooten J. Contrast-enhanced nanofocus computed tomography images the cartilage subtissue architecture in three dimensions. Eur Cell Mater. 2013;25:179–189. doi: 10.22203/ecm.v025a13. [DOI] [PubMed] [Google Scholar]
- 21.Das Neves Borges P, Forte A, Vincent E, Dini TL, Marenzana D, Rapid M. automated imaging of mouse articular cartilage by microCT for early detection of osteoarthritis and finite element modelling of joint mechanics. Osteoarthritis Cartilage. 2014;22:1419–1428. doi: 10.1016/j.joca.2014.07.014. [DOI] [PMC free article] [PubMed] [Google Scholar]
- 22.Bansal PN, et al. Cationic contrast agents improve quantification of glycosaminoglycan (GAG) content by contrast enhanced CT imaging of cartilage. J Orthop Res. 2010 doi: 10.1002/jor.21312. [DOI] [PubMed] [Google Scholar]
- 23.Lakin BA, et al. Contrast enhanced CT attenuation correlates with the GAG content of bovine meniscus. Journal of orthopaedic research : official publication of the Orthopaedic Research Society. 2013;31:1765–1771. doi: 10.1002/jor.22421. [DOI] [PMC free article] [PubMed] [Google Scholar]
- 24.Stewart MS, et al. Contrast-enhanced CT with a High-addinity Cationic Contrast agent for imaging ex vivo bovine, intact ex vivo rabbit and in vivo rabbit cartilage. Radiology. 2013;266:141–150. doi: 10.1148/radiol.12112246. [DOI] [PMC free article] [PubMed] [Google Scholar]
- 25.Joshi NS, Bansal PN, Stewart RC, Snyder BD, Grinstaff MW. Effect of contrast agent charge on visualization of articular cartilage using computed tomography: exploiting electrostatic interactions for improved sensitivity. J Am Chem Soc. 2009;131:13234–13235. doi: 10.1021/ja9053306. [DOI] [PubMed] [Google Scholar]
- 26.Gluer CC, et al. Accurate assessment of precision errors: how to measure the reproducibility of bone densitometry techniques. Osteoporosis International. 1995;5:262–270. doi: 10.1007/BF01774016. [DOI] [PubMed] [Google Scholar]
- 27.Dupont WD, Plummer WD., Jr Power and sample size calculations. A review and computer program. Control Clin Trials. 1990;11:116–128. doi: 10.1016/0197-2456(90)90005-m. [DOI] [PubMed] [Google Scholar]
- 28.Xie L, Lin AS, Guldberg RE, Levenston ME. Nondestructive assessment of sGAG content and distribution in normal and degraded rat articular cartilage via EPIC-microCT. Osteoarthritis Cartilage. 2010;18:65–72. doi: 10.1016/j.joca.2009.07.014. [DOI] [PMC free article] [PubMed] [Google Scholar]
- 29.Benders KE, et al. Formalin fixation affects equilibrium partitioning of an ionic contrast agent-microcomputed tomography (EPIC-muCT) imaging of osteochondral samples. Osteoarthritis Cartilage. 2010;18:1586–1591. doi: 10.1016/j.joca.2010.10.005. [DOI] [PubMed] [Google Scholar]
- 30.Li XF, et al. Observation of sGAG content of human hip joint cartilage in different old age groups based on EPIC micro-CT. Connect Tissue Res. 2015;56:99–105. doi: 10.3109/03008207.2015.1009052. [DOI] [PMC free article] [PubMed] [Google Scholar]
- 31.Lakin BA, et al. Contrast-enhanced CT facilitates rapid, non-destructive assessment of cartilage and bone properties of the human metacarpal. Osteoarthritis Cartilage. 2015;23:2158–2166. doi: 10.1016/j.joca.2015.05.033. [DOI] [PMC free article] [PubMed] [Google Scholar]
- 32.Silberberg R, Silberberg M, Vogel A, Wettstein W. Ultrastructure of articular cartilage of mice of various ages. Am J Anat. 1961;109:251–275. doi: 10.1002/aja.1001090304. [DOI] [PubMed] [Google Scholar]
- 33.Stolz M, et al. Early detection of aging cartilage and osteoarthritis in mice and patient samples using atomic force microscopy 1. Nat Nanotechnol. 2009;4:186–192. doi: 10.1038/nnano.2008.410. [DOI] [PubMed] [Google Scholar]
- 34.Berteau JP, Oyen M, Shefelbine SJ. Permeability and shear modulus of articular cartilage in growing mice. Biomech Model Mechanobiol. 2015 doi: 10.1007/s10237-015-0671-3. [DOI] [PubMed] [Google Scholar]
- 35.Jerome C, Hoch B. Skeletal Systems. In: Treuting PM, Dintzis SM, editors. Comparative anatomy and histology– a mouse and human atlas. Elsevier; Boston: 2012. pp. 53–70. [Google Scholar]
Associated Data
This section collects any data citations, data availability statements, or supplementary materials included in this article.


