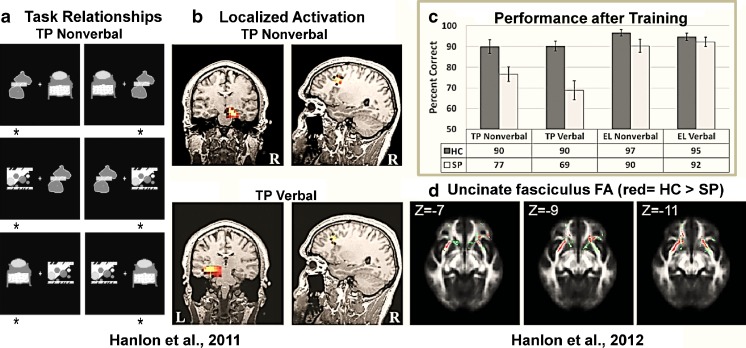
Fig. 4.
a. Project 3 task relationships for the nonverbal TP task. The 6 images represent the 6 possible stimulus pairings per trial. Each pairing is presented randomly and sequentially to the participant. The participant was asked to choose the correct stimulus in each pairing using a mouse button press (asterisks indicate the stimulus choice). b. Hippocampal and PFC activation from the sLORETA analysis, plotted on one HC’s MRI for each version of TP. These images show the most common activation pattern for HC. c. Performance results for nonverbal and verbal versions of the TP and Elemental (EL; control) tasks. d. Red tracts indicate where FA values were lower for SP compared to HC in the uncinate fasciculus (green = the uncinate fasciculus skeleton)

