Abstract
BACKGROUND
A validated scale is needed for objective and reproducible comparisons of facial fine lines before and after treatment in practice and clinical studies.
OBJECTIVE
To describe the development and validation of the 5-point photonumeric Allergan Fine Lines Scale.
METHODS
The Allergan Fine Lines Scale was developed to include an assessment guide, verbal descriptors, morphed images, and real subject images for each scale grade. The clinical significance of a 1-point score difference was evaluated in a review of multiple image pairs representing varying differences in severity. Interrater and intrarater reliability was evaluated in a live subject validation study (N = 289) completed during 2 sessions occurring 3 weeks apart.
RESULTS
A score difference of ≥1 point was shown to reflect a clinically significant difference (mean [95% CI] absolute score difference, 1.06 [0.92–1.21] for clinically different image pairs and 0.50 [0.38–0.61] for not clinically different pairs). Intrarater agreement between the 2 live subject validation sessions was almost perfect (weighted kappa = 0.85). Interrater agreement was substantial during the second rating session (0.76, primary end point).
CONCLUSION
The Allergan Fine Lines Scale is a validated and reliable scale for physician rating of severity of superficial fine lines.
Discontinuities in the facial skin surface, such as the development of superficial fine lines, are considered unattractive and are associated with aging.1,2 Many treatments are available for reducing the appearance of fine lines, such as topical retinoids,3,4 intradermal filler injections,5,6 mesotherapy,7,8 photodynamic therapy,9 chemical peels,10,11 and laser skin resurfacing.12 Given the growing availability of such treatments, the number of rejuvenation procedures has substantially increased in the past decade13 and is likely to continue to increase over the coming decades as the US population ages.14
Studies of the effectiveness of treatments for fine lines have primarily assessed outcomes using biophysical measurements, patient satisfaction, perceived effectiveness,6 numeric scales without images,3,5 and analog scales.15–18 However, no validated scales for the assessment of fine lines have been published. This report describes the development and validation of a photonumeric scale for the evaluation of superficial fine lines on the cheek and midface (Allergan Fine Lines Scale) that was developed to meet FDA requirements for validation of clinical rating scales.19 The objectives of this study were to determine the clinically significant difference in scale scores and to establish the interrater and intrarater reliability of the scale for rating fine lines in live subjects.
Methods
Scale Development
Figure 1 summarizes key steps in the creation and validation of the Allergan Fine Lines Scale. A 9-member team comprising 5 external members (3 board-certified dermatologists, 1 board-certified facial plastic surgeon, and 1 board-certified oculoplastic surgeon) and 4 Allergan employees (2 dermatologists, 1 plastic surgeon, and 1 clinical scientist) developed the scale from a pool of subject images captured by Canfield Scientific, Inc. (Canfield, Fairfield, NJ). A total of 396 men and women aged 18 years or older with Fitzpatrick skin Types I through VI and in good general health volunteered for image capture. All subjects provided informed photograph consent before image collection. Subjects were excluded if they had anything that would interfere with visual assessment of the area of interest. Full facial, 2-dimensional (2D) images were obtained using a 2D custom studio suite for facial imaging (Nikon D7100 Hi Res SLR). Two-dimensional images of the left side of the face taken at a 45° angle were cropped horizontally from the mid-glabella to the tragus and vertically from the lower eyelids to just below the chin to produce images of the area of interest for the Allergan Fine Lines Scale.
Figure 1.

Development and validation processes for the Allergan Fine Lines Scale.
Scale descriptors were created for each of the 5 grades of the scale (Table 1). Two members of the Allergan team met with each member of the scale development team for preliminary input on each scale grade. After preliminary scale grades were established, all 9 individuals involved in scale creation had a collaborative discussion about scale grades and descriptors. The wording for each grade was then finalized by the Allergan team.
TABLE 1.
Descriptors for the Allergan Fine Lines Scale
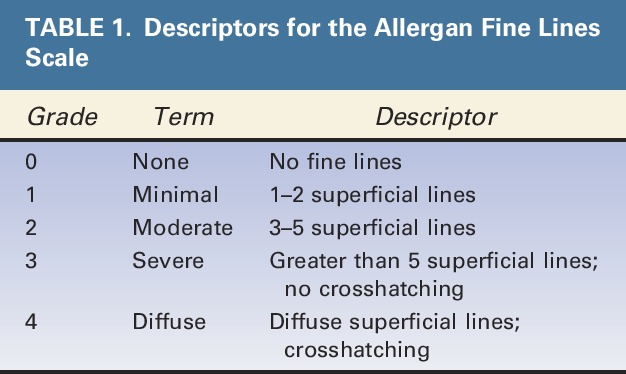
An assessment guide with a line drawing of anatomic markers demarcating the midface area of interest was created by Canfield based on detailed instructions from the Allergan team regarding anatomic markers (Figure 2). The drawing was then revised by Canfield multiple times after careful review by the Allergan team. The area of assessment for the Allergan Fine Lines Scale was defined as 1 cm in from the nasolabial fold to the left preauricular cheek and from the inferior orbital rim to above the mandible. The area of interest does not include nasolabial lines and crow's feet lines.
Figure 2.
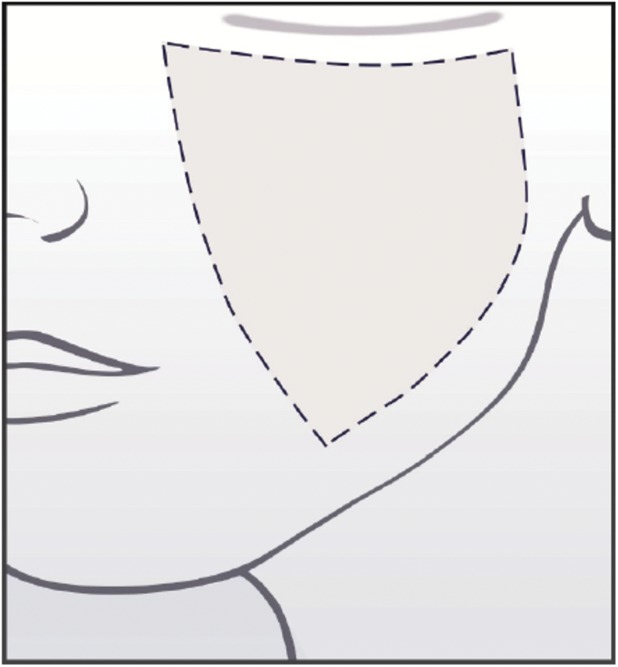
Assessment guide for the Allergan Fine Lines Scale.
A base image to demonstrate grade 2 fine lines was selected, and this image was morphed to represent all 5 grades of the scale. A Canfield graphics technician morphed the anatomic area of interest in the base image to match the descriptors provided for Grades 0, 1, 3, and 4. Alignment of the morphed images with the scale descriptors was achieved through an interactive process with the Allergan team.
A forced ranking review was performed to delineate the range of severity between Grades 2 and 3 and to confirm the selection of the best representative image to be used as Grade 2 on the scale. The 5 external scale developers performed the web-based forced ranking exercise on preselected images that represented the upper and lower boundaries of Grades 2 and 3.
To determine whether there was a clinically significant difference between grades of the scale, the 5 external scale developers were asked to perform an online clinical significance review. Multiple image pairs were selected to represent varying degrees of differences in severity (ranging from no difference to a 4-point difference). During the session, the scale developers determined whether there was a clinically significant difference (Yes/No) between images for each pair. After the session, the images from all image pairs were randomly mixed in with other images to be used in the morphed image scale validation (described in the following paragraph) and assigned a score by scale developers so that score differences between each image in each pair could be calculated.
The morphed scale was validated by having the 5 external scale developers use the scale to rate randomized images representing all grades of the scale during 2 web-based sessions occurring at least 3 days apart. A total of 296 images were rated (120 images in Session 1 and 176 images in Session 2). The scale had acceptable interrater and intrarater agreement (>0.5), so scale development proceeded using the morphed images.
For both the clinical significance review and morphed image scale validation review, scale developers were provided uniform hardware by Canfield to complete the reviews. Before the reviews, the scale developers completed web‐based PowerPoint training to familiarize themselves with the hardware, the review platform, and the purpose of the clinical significance and morphed image validation reviews. The scale developers were not allowed to discuss the review with one another, and each completed the image review independently.
After the morphed scale was created, 2 subject photographs representing each grade of the scale were selected to represent diversity in sex and Fitzpatrick skin type per grade. The final scale includes the scale descriptors for each grade, an assessment guide, the morphed images, and the real subject images (Figure 3).
Figure 3.
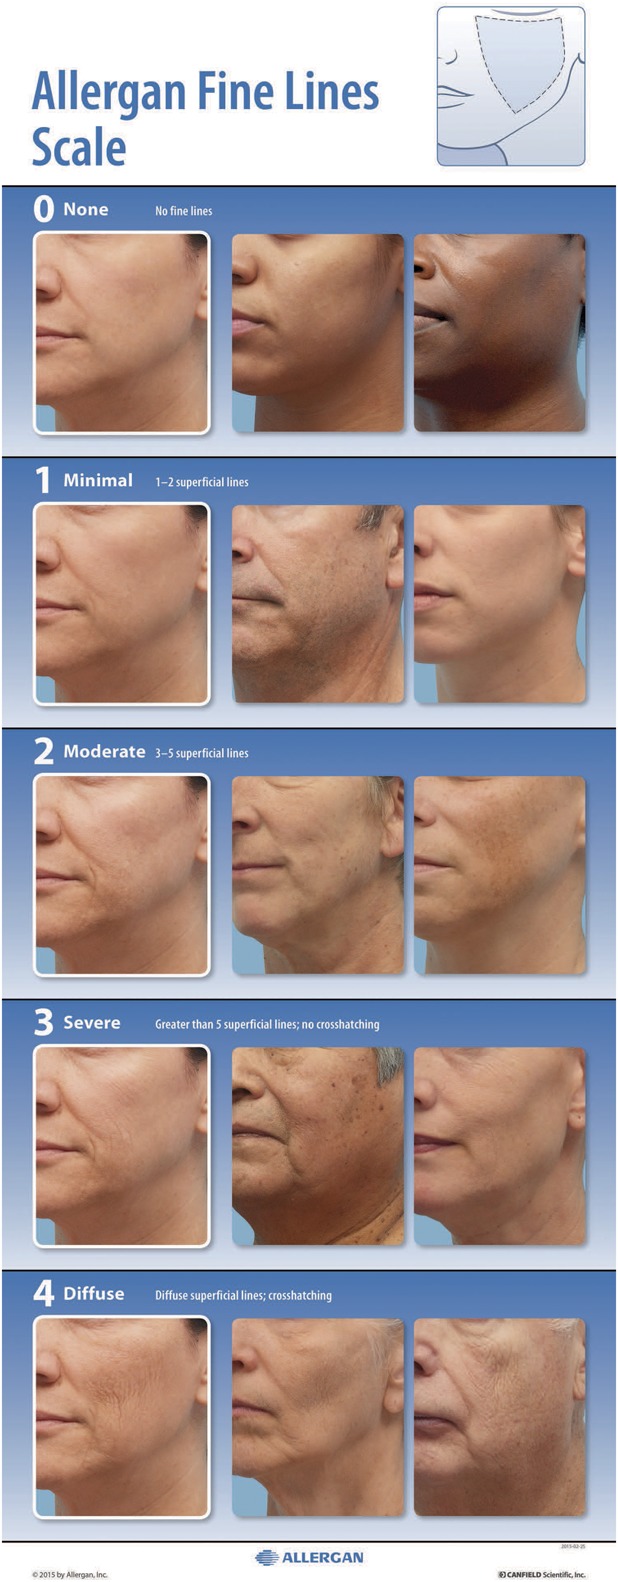
The Allergan Fine Lines Scale assigns a grade from none (0) to diffuse (4) that describes the density of superficial fine lines and crosshatching in the midface and cheek area delineated in the diagram shown in the upper right corner.
Scale Validation
The interrater and intrarater reliability of the final scale was evaluated in a live-subject rating validation study. Eight physician raters experienced in using aesthetic photonumeric scales who were not involved in scale development participated in two 2-day live validation sessions occurring 3 weeks apart. Before the first live validation session, all physician raters were trained on the use of the scale in an interactive group training session using 4 example subjects. Raters were instructed to count only superficial facial lines for determining the grade present and to exclude moderate and deep lines.
All subjects who qualified for the initial image-capture events were invited to attend the live validation sessions. Subjects were instructed to arrive clean shaven, to remove make-up and jewelry, to wear dark pants or jeans and a provided black T-shirt, to not drink alcohol excessively before the sessions, to try not to alter their usual routine (e.g., their facial care routine and normal sleep or hydration patterns) between sessions, and to not have tanning sessions or extensive sun exposure between sessions. On arrival at the study center for the first live validation session, subjects signed informed consent and were assessed for eligibility, age, sex, race (as reported by the subject), and Fitzpatrick skin type (determined by the investigator). Subjects were excluded if they had: their photographs included in the scale; anything that would interfere with visual assessment of the area of interest; any treatment with toxin/fillers, dental procedures, or surgery that would alter the area of interest within 2 weeks of the first validation session or plans to have one of these procedures between the 2 validation sessions; or diagnosis of pregnancy. Two-dimensional images of each subject were collected at the first live validation session using a 2D custom studio suite for facial imaging with Nikon D7100 Hi Res SLR camera. The first 5 subjects rated during the first validation session were considered run-in training subjects and were excluded from the analysis.
During the first and second live scale validation sessions, each physician rater evaluated all subjects on all scales (7 additional scales for other anatomic features were evaluated at the same sessions and are reported separately20–26). Raters had separate evaluation stations with an examination lamp, table, a stool for subject seating, supplies, and the photonumeric scale mounted and displayed for use in subject evaluation. Subjects presented themselves to each rater individually and proceeded from one rating station to the next in the same order until evaluated by all 8 raters. Raters were instructed to not discuss ratings with subjects or other raters. Raters took at least a 10-minute break every hour and at least a 30-minute lunch break to avoid rater fatigue.
Statistics
To determine the utility of the scale grades for detecting clinically significant differences in fine lines, absolute score differences for the image pairs deemed “clinically different” or “not clinically different” during scale development were summarized (mean, SD, range, 95% CI). For the live subject scale validation study, intrarater reliability was compared between Round 1 and Round 2 scores by calculating weighted kappa scores using Fleiss–Cohen weights.27 Kappa scores within the range of 0.0 to 0.20 indicate slight agreement, 0.21 to 0.40 indicate fair agreement, 0.41 to 0.60 indicate moderate agreement, 0.61 to 0.80 indicate substantial agreement, and 0.81 to 1.00 indicate almost perfect agreement.28 Interrater agreement was measured by determining the intraclass correlation coefficient (ICC [2,1]) and 95% CIs calculated using the formula described by Shrout and Fleiss.29 The a priori primary end point for the interrater agreement analysis was ICC (2,1) for the second rating session. SAS version 9.3 (Cary, NC) was used for all statistical analyses.
Sample Size Considerations
The sample size for the live subject validation sessions was calculated using the method described by Bonett.30 With up to 10 raters and an ICC of 0.5, a total of 66 subjects were needed to have a 95% CI with a width of 0.2 for interrater reliability. Considering potential loss of subjects between the 2 rounds, at least 80 subjects were to be enrolled. Because 289 subjects were eligible for the scale validation analysis, the number of subjects evaluated using the scale was substantially larger than the preplanned sample size of 80, and the overall number of assessments for some grades of this scale was larger than that for the other grades. To minimize imbalance in the number of subjects across scale grades and to meet the sample size requirement, the mean score across the 8 raters for each subject was used to assign an overall grade for each subject, and a subset of 115 subjects with minimum imbalance across the grades (>16 subjects per each of the 5 scale grades) was randomly selected from the eligible subjects using a prespecified procedure. This random selection of the subset was performed 20 times. Interrater and intrarater agreements calculated for each of the 20 subsets were combined using SAS procedure PROC MIANALYZE to obtain the overall interrater and intrarater agreements.
Results
Clinical Significance Determination by Scale Developers
The mean (95% CI) absolute difference in scores was 1.06 (0.92–1.21) for image pairs deemed clinically different and 0.50 (0.38–0.61) for image pairs not deemed clinically different (Table 2). The 95% CIs for the pairs deemed clinically different did not overlap with the CIs for the pairs deemed not clinically different, confirming that a 1-point difference in scores is clinically significant.
TABLE 2.
Difference in Scores on the Allergan Fine Lines Scale for Image Pairs Deemed Clinically Different or Not Clinically Different

Live-Subject Scale Validation Results
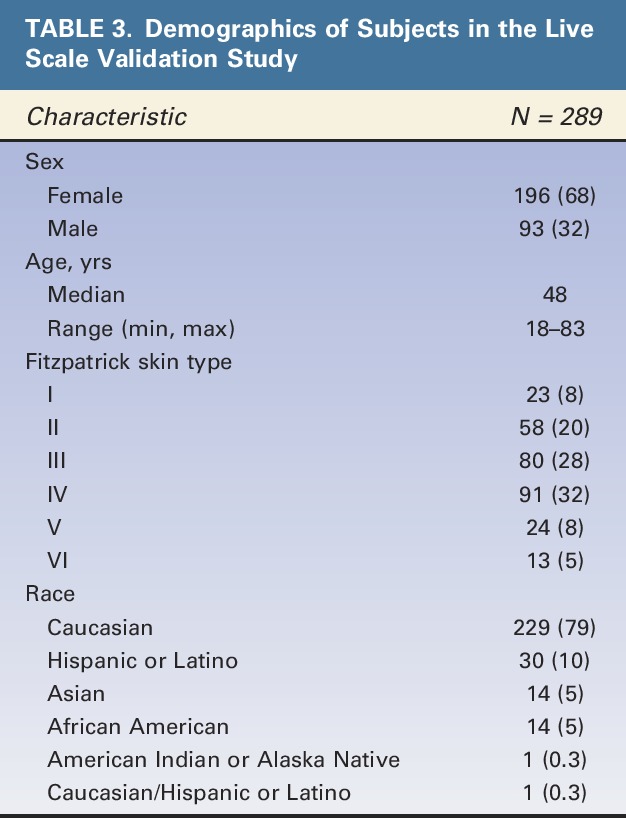
All 289 of the subjects who were eligible for the Allergan Fine Lines Scale validation and rated on the scale were selected in at least one of the 20 random subsets for analysis of intrarater and interrater agreement. Demographic characteristics of subjects in the final scale validation set are shown in Table 3. Most subjects were women (68%), Caucasian (79%), and had Fitzpatrick skin Type III (28%) or IV (32%). Median age was 48 years, and a broad span of ages was represented (range: 18–83 years).
TABLE 3.
Demographics of Subjects in the Live Scale Validation Study
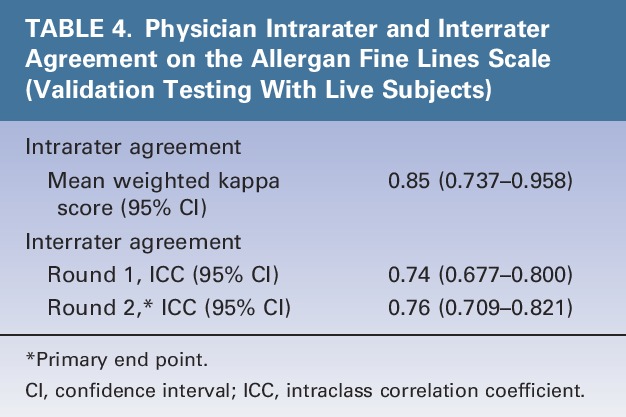
Intrarater agreement between the 2 live-subject rating sessions was almost perfect (mean weighted kappa = 0.85) (Table 4). Interrater agreement was substantial during the first (ICC = 0.74) and second rating sessions (ICC = 0.76, primary end point) (Table 4).
TABLE 4.
Physician Intrarater and Interrater Agreement on the Allergan Fine Lines Scale (Validation Testing With Live Subjects)
Discussion
The substantial to almost perfect level of interrater and intrarater agreement observed in the scale validation study indicates that the Allergan Fine Lines Scale is reliable and reproducible for the classification of superficial fine lines on the cheek and midface areas of live subjects. A 1-point difference in scale ratings was shown to reflect clinically significant differences, indicating that the scale has sufficient sensitivity for detecting clinically significant changes in the severity of fine lines.
The Allergan Fine Lines Scale describes visual changes in the density of fine lines in words. Superficial fine lines are generally considered to be smooth and not rough to the touch. Accordingly, discontinuities in the skin surface other than superficial fine lines are not considered when using the Allergan Fine Lines Scale. The Allergan Skin Roughness Scale (published separately23) may be used to assess textural irregularities, skin unevenness, and roughness that are not associated with fine lines.
Several validated scales are available for assessing the severity of wrinkles and lines in other areas of the face, including nasolabial folds,31–34 forehead lines,35–37 marionette lines,38 glabellar lines,36 crow's feet lines,36,37,39,40 perioral lines,41 and oral commissures.41 However, the Allergan Fine Lines Scale is the first validated scale for superficial fine lines on the cheek and midface.
Given the growing popularity of procedures for reducing fine lines,13 there is a need for a reliable validated photonumeric scale. This scale may be used in clinical trials and for pretreatment and posttreatment use by clinicians treating fine lines of the cheek and midface. The scale may also be useful for teaching and for informing and building trust with patients. Use of validated scales for formalized and reproducible consultation procedures can help establish clear patient expectations regarding likely treatment outcomes, thus empowering patients to make informed treatment decisions.42
Study Limitations
Clinical difference image comparisons by the scale developers showed that a 1-point change on the scale is indicative of a clinically significant difference in fine lines by experienced clinicians. However, clinically meaningful differences may vary from the subject's perspective, with a <1-point change considered meaningful to patients desiring a subtle change and other subjects perceiving only dramatic changes as meaningful. This scale is not intended for patient self-assessment of clinically meaningful improvements. The FACE-Q appraisal of lines scale may help to evaluate patient satisfaction with treatments for fine lines.43,44 Although the verbal descriptors for each grade on the scale are subjective, the descriptions were developed and refined by extensive discussion among a team of 9 experts to minimize inherent subjectivity.
Conclusions
The increasing popularity of facial rejuvenation procedures has created a need for a validated scale that can be broadly used for reliable assessment of facial fine lines. The Allergan Fine Lines Scale is a validated scale that includes user-friendly diagrams, detailed verbal descriptions, and morphed and real subject images that are representative of both sexes and multiple skin types. The scale demonstrated substantial interrater reliability and almost perfect intrarater agreement among physician raters, and 1-point score differences were shown to reflect clinically significant differences in skin quality. The scale is compliant with FDA guidelines for validated clinical outcome measures for use in clinical trials and may be a helpful tool for dermatologists and plastic surgeons who treat men and women seeking to improve facial skin quality.
Acknowledgments
The authors thank the following physicians for completing the scale validation study: David E. Bank, MD, FAAD; Sue Ellen Cox, MD; Timothy M. Greco, MD, FACS; Z. Paul Lorenc, MD, FACS; David J. Narins, MD, PC, FACS; William B. Nolan, MD; Robert A. Weiss, MD; and Margaret Weiss, MD. Statistical support was provided by Yijun Sun, PhD, and Shraddha Mehta, PhD of Allergan plc, Irvine, CA.
Footnotes
Supported by Allergan plc, Dublin, Ireland. Editorial support for this article was provided by Peloton Advantage, Parsippany, New Jersey and was funded by Allergan plc. The authors received an honorarium for participating in scale development and validation.
B. Hardas, A. Marx, and D.K. Murphy are employees of Allergan plc. L. Creutz provided medical writing services at the request of the authors, which was funded by Allergan plc. The remaining authors have indicated no significant interest with commercial supporters.
The opinions expressed in this article are those of the authors. The authors received no honorarium or other form of financial support related to the development of this article.
References
- 1.Fink B, Grammer K, Thornhill R. Human (Homo sapiens) facial attractiveness in relation to skin texture and color. J Comp Psychol 2001;115:92–9. [DOI] [PubMed] [Google Scholar]
- 2.Samson N, Fink B, Matts PJ, Dawes NC, et al. Visible changes of female facial skin surface topography in relation to age and attractiveness perception. J Cosmet Dermatol 2010;9:79–88. [DOI] [PubMed] [Google Scholar]
- 3.Ho ET, Trookman NS, Sperber BR, Rizer RL, et al. A randomized, double-blind, controlled comparative trial of the anti-aging properties of non-prescription tri-retinol 1.1% vs. prescription tretinoin 0.025%. J Drugs Dermatol 2012;11:64–9. [PubMed] [Google Scholar]
- 4.Ogden S, Samuel M, Griffiths CE. A review of tazarotene in the treatment of photodamaged skin. Clin Interv Aging 2008;3:71–6. [DOI] [PMC free article] [PubMed] [Google Scholar]
- 5.Lee BM, Han DG, Choi WS. Rejuvenating effects of facial hydrofilling using restylane vital. Arch Plast Surg 2015;42:282–7. [DOI] [PMC free article] [PubMed] [Google Scholar]
- 6.Kerscher M, Bayrhammer J, Reuther T. Rejuvenating influence of a stabilized hyaluronic acid-based gel of nonanimal origin on facial skin aging. Dermatol Surg 2008;34:720–6. [DOI] [PubMed] [Google Scholar]
- 7.Savoia A, Landi S, Baldi A. A new minimally invasive mesotherapy technique for facial rejuvenation. Dermatol Ther (Heidelb) 2013;3:83–93. [DOI] [PMC free article] [PubMed] [Google Scholar]
- 8.Prikhnenko S. Polycomponent mesotherapy formulations for the treatment of skin aging and improvement of skin quality. Clin Cosmet Investig Dermatol 2015;8:151–7. [DOI] [PMC free article] [PubMed] [Google Scholar]
- 9.Karrer S, Kohl E, Feise K, Hiepe-Wegener D, et al. Photodynamic therapy for skin rejuvenation: review and summary of the literature–results of a consensus conference of an expert group for aesthetic photodynamic therapy. J Dtsch Dermatol Ges 2013;11:137–48. [DOI] [PubMed] [Google Scholar]
- 10.Ghersetich I, Brazzini B, Peris K, Cotellessa C, et al. Pyruvic acid peels for the treatment of photoaging. Dermatol Surg 2004;30:32–6. [DOI] [PubMed] [Google Scholar]
- 11.Berardesca E, Cameli N, Primavera G, Carrera M. Clinical and instrumental evaluation of skin improvement after treatment with a new 50% pyruvic acid peel. Dermatol Surg 2006;32:526–31. [DOI] [PubMed] [Google Scholar]
- 12.Rhie JW, Shim JS, Choi WS. A pilot study of skin resurfacing using the 2,790-nm erbium: YSGG laser system. Arch Plast Surg 2015;42:52–8. [DOI] [PMC free article] [PubMed] [Google Scholar]
- 13.American Society of Plastic Surgeons. 2014 Plastic Surgery Statistics Report. Available from: http://www.plasticsurgery.org/Documents/news-resources/statistics/2014-statistics/plastic-surgery-statsitics-full-report.pdf. Accessed July 21, 2016. [Google Scholar]
- 14.Ortman JM, Velkoff VA, Hogan H. An Aging Nation: The Older Population in the United States. Washington, DC: U.S. Census Bureau; 2014. [Google Scholar]
- 15.Gold MH, Goldman MP, Rao J, Carcamo AS, et al. Treatment of wrinkles and elastosis using vacuum-assisted bipolar radiofrequency heating of the dermis. Dermatol Surg 2007;33:300–9. [DOI] [PubMed] [Google Scholar]
- 16.Dahan S, Rousseaux I, Cartier H. Multisource radiofrequency for fractional skin resurfacing-significant reduction of wrinkles. J Cosmet Laser Ther 2013;15:91–7. [DOI] [PubMed] [Google Scholar]
- 17.Fitzpatrick RE, Goldman MP, Satur NM, Tope WD. Pulsed carbon dioxide laser resurfacing of photo-aged facial skin. Arch Dermatol 1996;132:395–402. [PubMed] [Google Scholar]
- 18.McCall-Perez F, Stephens TJ, Herndon JH., Jr Efficacy and tolerability of a facial serum for fine lines, wrinkles, and photodamaged skin. J Clin Aesthet Dermatol 2011;4:51–4. [PMC free article] [PubMed] [Google Scholar]
- 19.U.S. Department of Health and Human Services, Food and Drug Administration. Guidance for Industry: Patient-reported Outcome Measures: Use in Medical Product Development to Support Labeling Claims. Available from: http://www.fda.gov/downloads/Drugs/Guidances/UCM193282.pdf. Accessed July 21, 2016. [Google Scholar]
- 20.Jones D, Donofrio L, Hardas B, Murphy DK, et al. Development and validation of a photonumeric scale for evaluation of volume deficit of the hand. Dermatol Surg 2016;42(Suppl 10):S195–202. [DOI] [PMC free article] [PubMed] [Google Scholar]
- 21.Carruthers J, Jones D, Hardas B, Murphy DK, et al. Development and validation of a photonumeric scale for evaluation of volume deficit of the temple. Dermatol Surg 2016;42(Suppl 10):S203–10. [DOI] [PMC free article] [PubMed] [Google Scholar]
- 22.Sykes JM, Carruthers A, Hardas B, Murphy DK, et al. Development and validation of a photonumeric scale for assessment of chin retrusion. Dermatol Surg 2016;42(Suppl 10):S211–18. [DOI] [PMC free article] [PubMed] [Google Scholar]
- 23.Donofrio L, Carruthers A, Hardas B, Murphy DK, et al. Development and validation of a photonumeric scale for evaluation of facial skin texture. Dermatol Surg 2016;42(Suppl 10):S219–26. [DOI] [PMC free article] [PubMed] [Google Scholar]
- 24.Jones D, Carruthers A, Hardas B, Murphy DK, et al. Development and validation of a photonumeric scale for evaluation of transverse neck lines. Dermatol Surg 2016;42(Suppl 10):S235–42. [DOI] [PMC free article] [PubMed] [Google Scholar]
- 25.Carruthers A, Donofrio L, Hardas B, Murphy DK, et al. Development and validation of a photonumeric scale for evaluation of static horizontal forehead lines. Dermatol Surg 2016;42(Suppl 10):S243–50. [DOI] [PMC free article] [PubMed] [Google Scholar]
- 26.Donofrio L, Carruthers J, Hardas B, Murphy DK, et al. Development and validation of a photonumeric scale for evaluation of infraorbital hollows. Dermatol Surg 2016;42(Suppl 10):S251–58. [DOI] [PMC free article] [PubMed] [Google Scholar]
- 27.Fleiss JL, Cohen J. The equivalence of weighted kappa and the intraclass correlation coefficient as measure of reliability. Educ Psychol Meas 1973;33:613–9. [Google Scholar]
- 28.Landis JR, Koch GG. The measurement of observer agreement for categorical data. Biometrics 1977;33:159–74. [PubMed] [Google Scholar]
- 29.Shrout PE, Fleiss JL. Intraclass correlations: uses in assessing rater reliability. Psychol Bull 1979;86:420–8. [DOI] [PubMed] [Google Scholar]
- 30.Bonett DG. Sample size requirements for estimating intraclass correlations with desired precision. Stat Med 2002;21:1331–5. [DOI] [PubMed] [Google Scholar]
- 31.Buchner L, Vamvakias G, Rom D. Validation of a photonumeric wrinkle assessment scale for assessing nasolabial fold wrinkles. Plast Reconstr Surg 2010;126:596–601. [DOI] [PubMed] [Google Scholar]
- 32.Day DJ, Littler CM, Swift RW, Gottlieb S. The wrinkle severity rating scale: a validation study. Am J Clin Dermatol 2004;5:49–52. [DOI] [PubMed] [Google Scholar]
- 33.Monheit GD, Thomas JA, Murphy DK, Walker PS. Photographic documentation from a double-blind randomized multicenter study comparing new hyaluronic acid-based fillers with crosslinked bovine collagen [poster]. Poster presented at the Annual Meeting of the American Academy of Dermatology; July 26–30, 2006; San Diego, CA.
- 34.Smith SR, Jones D, Thomas JA, Murphy DK, et al. Duration of wrinkle correction following repeat treatment with Juvederm hyaluronic acid fillers. Arch Dermatol Res 2010;302:757–62. [DOI] [PMC free article] [PubMed] [Google Scholar]
- 35.Carruthers A, Carruthers J, Hardas B, Kaur M, et al. A validated grading scale for forehead lines. Dermatol Surg 2008;34(Suppl 2):S155–60. [DOI] [PubMed] [Google Scholar]
- 36.Flynn TC, Carruthers A, Carruthers J, Geister TL, et al. Validated assessment scales for the upper face. Dermatol Surg 2012;38:309–19. [DOI] [PubMed] [Google Scholar]
- 37.Tsukahara K, Takema Y, Kazama H, Yorimoto Y, et al. A photographic scale for the assessment of human facial wrinkles. J Cosmet Sci 2000;51:127–39. [Google Scholar]
- 38.Carruthers A, Carruthers J, Hardas B, Kaur M, et al. A validated grading scale for marionette lines. Dermatol Surg 2008;34(Suppl 2):S167–72. [DOI] [PubMed] [Google Scholar]
- 39.Carruthers A, Carruthers J, Hardas B, Kaur M, et al. A validated grading scale for crow's feet. Dermatol Surg 2008;34(Suppl 2):S173–8. [DOI] [PubMed] [Google Scholar]
- 40.Kane MA, Blitzer A, Brandt FS, Glogau RG, et al. Development and validation of a new clinically-meaningful rating scale for measuring lateral canthal line severity. Aesthet Surg J 2012;32:275–85. [DOI] [PubMed] [Google Scholar]
- 41.Cohen JL, Thomas J, Paradkar D, Rotunda A, et al. An interrater and intrarater reliability study of 3 photographic scales for the classification of perioral aesthetic features. Dermatol Surg 2014;40:663–70. [DOI] [PubMed] [Google Scholar]
- 42.Jandhyala R. Improving consent procedures and evaluation of treatment success in cosmetic use of incobotulinumtoxinA: an assessment of the treat-to-goal approach. J Drugs Dermatol 2013;12:72–80. [PubMed] [Google Scholar]
- 43.Pusic AL, Klassen AF, Scott AM, Cano SJ. Development and psychometric evaluation of the FACE-Q satisfaction with appearance scale: a new patient-reported outcome instrument for facial aesthetics patients. Clin Plast Surg 2013;40:249–60. [DOI] [PubMed] [Google Scholar]
- 44.Klassen AF, Cano SJ, Schwitzer JA, Baker SB, et al. Development and psychometric validation of FACE-Q skin, lips and facial rhytides appearance scales and adverse effect checklists for cosmetic procedures. JAMA Dermatol 2016;152:443–51. [DOI] [PMC free article] [PubMed] [Google Scholar]


