Abstract
This study aimed to explore the value of contrast-enhanced computed tomography (CT) scans in the differential diagnosis of atypical adenomatous hyperplasia, adenocarcinoma in situ, minimal invasive adenocarcinoma (MIA), and invasive adenocarcinoma (IAC), which manifested as ground glass nodules (GGNs) or mixed GGNs.
Unenhanced and contrast-enhanced presurgical CT images of 136 cases of GGNs were compared. The nodules were diagnosed based on their solid portions and maximum dimensions, and the findings obtained using both contrast-enhanced and unenhanced CT images were analyzed in corroboration with the pathological diagnosis.
Most (53/56) preinvasive nodules showed increased mean CT values after contrast administration. In the MIA group, after contrast administration, enlargements of the solid portions were seen in 48 nodules (48/60), and the elevation of the mean CT value was observed in 12 nodules (12/60). The vast majority of IAC nodules (29/30) showed enlargement of the solid portions after contrast administration. Moreover, for group differences, findings obtained using this approach statistically match the pathological findings.
Contrast-enhanced CT scans are more useful than unenhanced CT scans for the diagnosis of GGNs, especially for pure GGNs, before surgery.
Keywords: adenocarcinoma, enhancement, lung, tomography, x-ray computed
1. Introduction
A new classification system for lung adenocarcinomas was published in 2011.[1] Atypical adenomatous hyperplasia (AAH), adenocarcinoma in situ (AIS), minimal invasive adenocarcinoma (MIA), and some invasive adenocarcinoma (IAC) lesions manifest as pure ground glass nodules (pGGNs), or mixed ground glass nodules (mGGNs), which contain solid portions. As early-stage lesions, preinvasive and MIA lesions are less invasive to local structures. Thus, many common signs (such as burrs, lobulation, vacuoles, and pleural indentations) of lung adenocarcinomas are seldom seen in these lesions. Computed tomography (CT) values contrast between ground glass opacities (GGOs) and the surrounding normal lung tissue is not very high, and this fact may complicate the assessment of some common signs. Presurgical diagnosis only based on conventional morphologic findings is very difficult. A pathological diagnosis must evaluate the maximum dimensions of the solid portions of the nodules according to the new categories of lung adenocarcinomas published in 2011. These evaluations are critical parameters for the differential diagnosis of AIS, MIA, and IAC lesions.
In this study, both unenhanced CT images and contrast-enhanced CT images were analyzed in association with the evaluation of the maximum dimensions of the solid portions of nodules to obtain presurgical diagnoses. The present study is aimed to explore the value of contrast-enhanced CT scans in the differential diagnosis of GGNs in comparison with the pathologic results.
2. Materials and methods
2.1. Patients
This study was approved by the Hua Dong Hospital. CT image data of patients with pulmonary GGNs were obtained at our hospital from January 2011 through January 2014, and reviewed retrospectively. All lesions were solitary, and most were surgically resected within 2 weeks after the CT examination. in all, 136 patients were enrolled in this study, including 42 men and 94 women with a mean age of 57.18 ± 10.61 years (range 30–78 years). The patient inclusion criteria are as follows: (1) a GGN size of less than 2 cm in its largest dimension (lesion size was measured on thin-section images); and (2) all nodules were pGGNs, or their solid portions were less than 5 mm. All of these nodules were diagnosed as preinvasive lesions or MIAs before surgery. These 136 cases included 7 cases of AAH, 49 cases of AIS, 50 cases of MIA, and 30 cases of IAC.
2.2. CT examination
Chest CT imaging (ranging from the apex to the base of the lung, including the chest wall and the axillary fossa) was performed on a 64-detector CT system (GE Light Speed VCT or GE Discovery CT750 HD, GE Healthcare, Milwaukee, WI) using the following protocol parameters: section width, 0.625 mm; reconstruction interval, 0.625 mm; pitch, 0.984; 120 kV; and 250 mA. All patients consented to the plan. All patients received a bolus of 80 to 100 mL of intravenous contrast medium (Optiray; Mallinckrodt Imaging, Hazelwood, MO [350 mg iodine/mL]) at a rate of 3 to 4 mL/s with the use of a power injector via an 18 or 20-gauge cannula in an antecubital vein. The enhanced CT scan commenced 60 seconds after the administration of the contrast medium.[2] Standard and high-resolution methods were used for image reconstructions.
2.3. Pathological analysis
The GGNs were resected by video-assisted thoracoscopy or thoracotomy surgery. Specimens were fixed in 10% formalin and embedded in paraffin. Representative hematoxylin-eosin stained sections were reviewed. For cases of equivocal pathological classifications under light microscopy, immunohistochemical analyses were performed for clarification. All histological preparations and analyses were performed by 2 senior pathologists, according to the guidelines provided by the new classifications of lung adenocarcinomas.[1]
2.4. CT window settings
It is very difficult to define the enhancement of GGNs (and especially small GGNs) because of the characteristics of GGNs, such as low intensities and small solid portions. The conspicuity of GGNs can be amplified by using display windows with wider window widths and higher window levels (Fig. 1). Therefore, we set the CT mediastinal window to be 700 HU/100 HU (window width/window level). This will be further addressed in the “Discussion” section.
Figure 1.
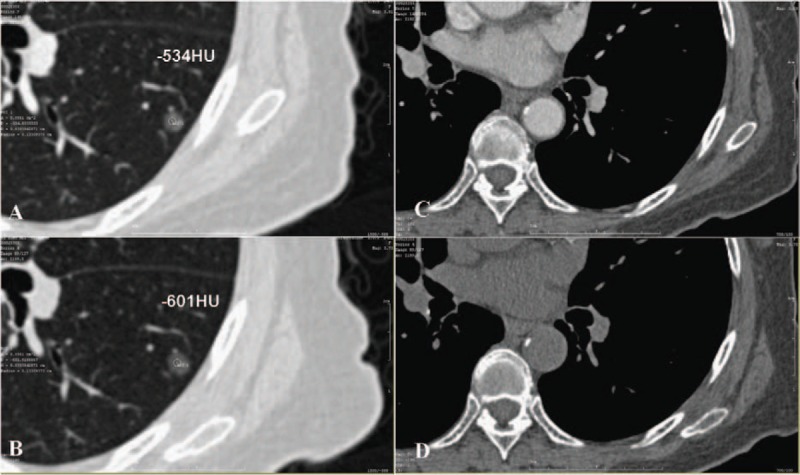
(A) After contrast image, the CT value of the GGN is −534 HU (ROI is 1.33 mm in diameter both in A and B). (B) Before contrast image, the CT value of the GGN is −601 HU. (C and D) Mediastinal window image after and before contrast. CT = computed tomography, GGN = ground glass nodule, ROI = region of interest.
2.5. CT imaging analysis
In lung CT imaging, a GGN lesion is defined as a hazy, increased attenuation in the lung with preservation of intact bronchial and vascular structures.[3] The method to measure pGGNs’ CT value is as follows: 3 regions of interest (ROIs) were measured, and the mean values both on unenhanced and contrast-enhanced CT images were evaluated. A quantitative evaluation of the largest dimensions of the solid portions of mGGNs in the mediastinal window (window width, 700 HU; window level, 100 HU) and their attenuations were measured and presented as means. When choosing an ROI, one should avoid the vessels in both pGGNs and mGGNs. The imaging analysis was conducted by 2 experienced thoracic radiologists who were blinded to the pathological results. For every GGN case, each radiologist independently reported the lesion location, GGN type, largest dimension of the solid portions of the mGGNs, CT values of each pGGN on pre and postcontrast-enhanced CT images, the likelihood of malignancy, and the nodule's definition according to new classifications of lung adenocarcinomas published in 2011. If discordance occurred, consensus was reached after mutual discussion.
2.6. Statistical analysis
Statistical analyses were performed using a commercially available computer software program (SPSS 17.0 for Windows; SPSS, Chicago, IL). The diagnoses of all nodules before surgery based on unenhanced and contrast-enhanced CT images of 3 different pathologic lesions were compared with the pathologic diagnoses, and evaluated using Pearson chi-square test. Independent t tests were used to compare age and GGN size among the different pathological groups. Statistical results were considered significant when the P value was less than .05. We calculated a receiver-operating characteristic (ROC) curve according to the largest dimensions of the solid portions of the nodules on both unenhanced and contrast-enhanced CT images and calculated the area under the curve (AUC) value. When analyzing the AUC results, AUCs between 0.50 and 0.70 were considered to have low diagnostic value, AUCs between 0.70 and 0.90 had medium diagnostic value, and AUCs above 0.90 had high diagnostic value.
3. Results
We divided the enhancement of all nodules into 2 patterns. The first pattern is that the nodules only had mean CT values elevation. Another pattern is the enlargement of nodule's solid portions after contrast administration. The nodules were divided into 3 groups (preinvasive diseases, MIAs, and IACs) based on the pathological results. The number of women were greater than the number of men in all 3 groups. There were no significant statistical differences in age between the preinvasive and MIA groups, or between the MIA and IAC groups (P = .114 and P = .4, respectively).
There were significant statistical differences in nodular size between the preinvasive and MIA groups, and between the MIA and IAC groups (P = .002 and P = .004, respectively; Table 1). Nodules were divided into 2 categories of enhancement based on pre and postcontrast-enhanced CT images. The categories were as follows: I—there was no solid nodule portion on either plain or contrast-enhanced CT images; however, there were elevations of CT values after contrast administration (Fig. 1); and II—there was enlargement of the solid portions of the nodules after contrast administration. There were 2 subtypes of this category as follows: A—there was no solid nodule portion on unenhanced images, and some solid nodule portions were observed after contrast administration in the mediastinal window; and B—some solid nodule portions were observed on unenhanced CT images and enlargements of the solid portions were observed on contrast-enhanced CT images (Figs. 2 and 3). To evaluate the enhancement of the nodules, the largest solid portions were measured in a mediastinal window.
Table 1.
Characteristics of the 3 groups with different pathological findings.
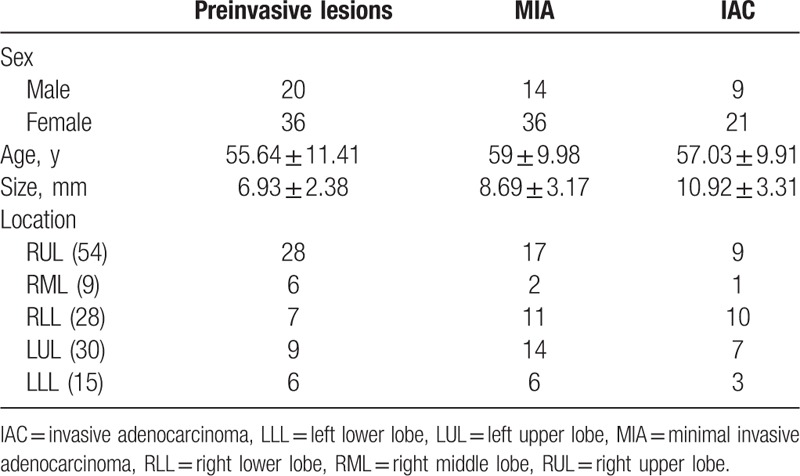
Figure 2.
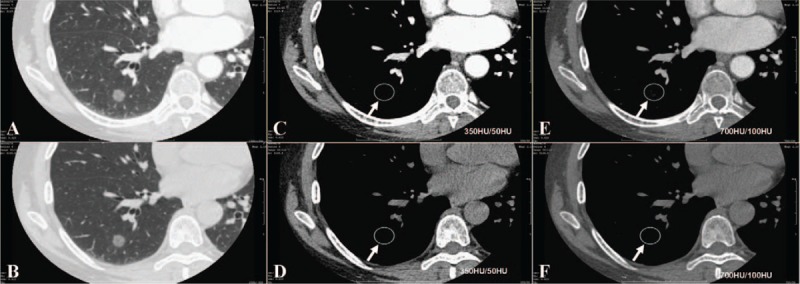
(A and B) Enhanced CT image (A, lung window) and unenhanced CT image (B, lung window); there is a pGGN in the RLL, there are no solid portions of the nodule in enhanced CT image and unenhanced CT image (C and D, in conventional mediastinal window-350 HU/50 HU), but there were some solid portions in adjusted mediastinal window (E and F, 700 HU/100 HU, arrow) after contrast, and there were no solid portions in adjusted mediastinal window before contrast. It was easily defined an enhancement of this small nodules through adjusted medeastinal window. CT = computed tomography, pGGN = pure ground glass nodule, RLL = right lower lobe.
Figure 3.
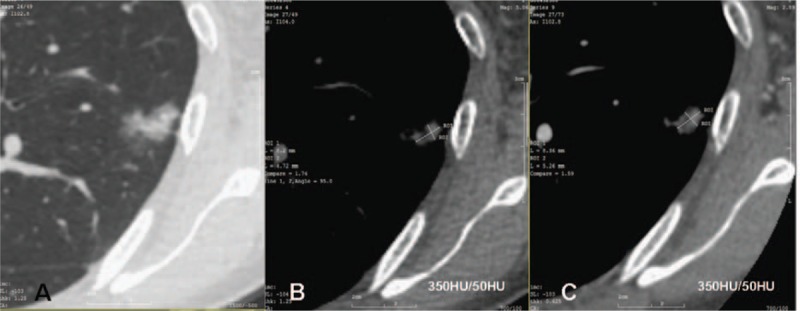
Lung window CT image (A) shown a mixed GGN. Enhanced CT image (C, after contrast, arrow) shown solid portions were bigger than unenhanced CT image (B, before contrast) in conventional mediastinal window setting (350 HU/50 HU). CT = computed tomography, GGN = ground glass nodule.
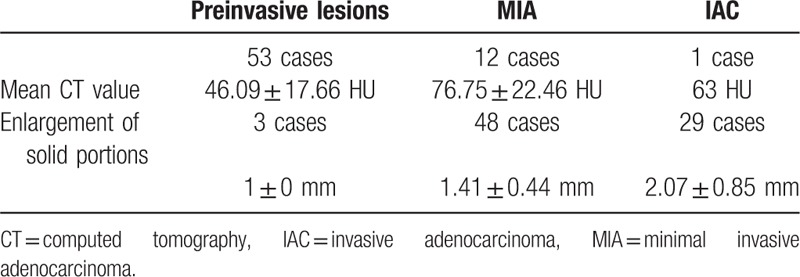
In general, the changes observed in preinvasive lesions after contrast enhancement were elevations of CT values (53/56). In 3 cases of preinvasive lesions, the enlargement of the solid portions of the nodules was observed. In these 3 cases, 2 did not present a solid portion on unenhanced CT images while presenting an approximately 1 mm solid portion on contrast-enhanced CT images, and 1 nodule presented a solid portion of approximately 1 mm on unenhanced CT images and a solid portion of approximately 2 mm on contrast-enhanced CT images in a mediastinal window. Among the MIAs, 48 (48/60) cases demonstrated enlargement of the solid portions, and 12 cases manifested as elevations of CT values. There were significant differences in the statistical analysis of mean CT value elevations between preinvasive lesions and MIAs (P = .000). In the IACs, most nodules (29/30) demonstrated enlargement of the solid portions after contrast enhancement (Table 2); however, only 1 nodule manifested as an elevation of the mean CT value, and was confirmed to be acinar-predominant IAC. There were significant statistical differences in solid portion enlargement after contrast administration between the MIA and IAC groups (P = .001).
Table 2.
Enhancement characteristics of the 3 different pathologic groups.
The AUCs results of analysis of solid portions in CT images is presented in Table 3 (Figs. 4 and 5). There was a significant statistical difference between the presurgical diagnosis based on unenhanced CT images and the pathological diagnosis (P < .05). However, there was no significant statistical difference between the presurgical diagnosis based on contrast-enhanced CT images and the pathological diagnosis (P > .05). There was an obvious improvement in presurgical diagnostic accuracy when using contrast-enhanced CT images compared to unenhanced CT images (Table 4).
Table 3.
AUCs of analysis of solid portions in different CT images.

Figure 4.
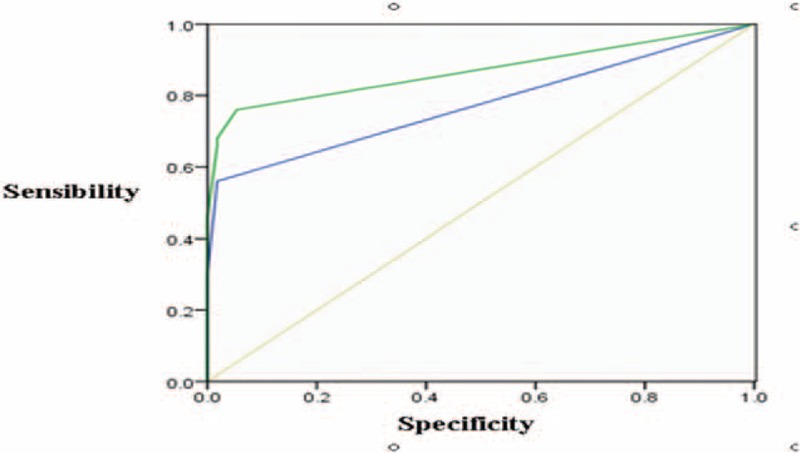
Preinvasive lesion versus MIA. There were medium value to differentiate diagnoses between preinvasive lesions and MIAs according to solid portions of nodules in unenhanced CT images (the AUC was 0.774 ± 0.048). There was medium value to differentiate diagnosis between preinvasive lesions and MIAs according to solid portions of nodules in enhanced CT images (the AUC was 0.869 ± 0.039). AUC = area under the curve, CT = computed tomography, MIA = minimal invasive adenocarcinoma.
Figure 5.
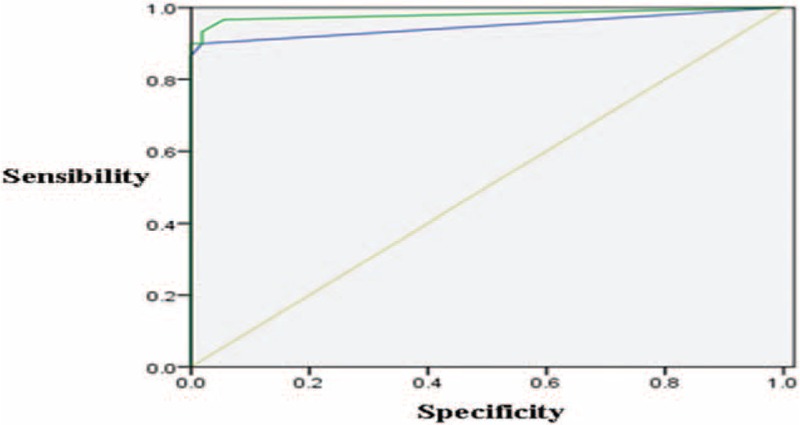
MIA versus IAC. There was high value to differentiate diagnosis between IACs and MIAs according to solid portions of nodules in unenhanced CT images (the AUC was 0.949 ± 0.033). There was high value to differentiate diagnosis between IACs and MIAs according to solid portions of nodules in enhanced CT images (the AUC was 0.981 ± 0.020). AUC = area under the curve, CT = computed tomography, IAC = invasive adenocarcinoma, MIA = minimal invasive adenocarcinoma.
Table 4.
Presurgical diagnostic accuracy on unenhanced and contrast-enhanced CT images.

4. Discussion
4.1. The diagnostic values of enhanced CT scan in solid nodules and its pathological basis
In the early 1970s, Folkman indicated that the growth and metastasis of tumors primarily depend on the generation of new blood vessels, and this view is commonly accepted today. The growth and metastasis of a tumor requires angiogenesis.[4]
We found that the conspicuity of GGNs can be amplified by using display windows with wider window widths and higher window levels. Therefore, we set the CT mediastinal window to be 700 HU/100 HU. In assessments of other diseases, many clinicians adjust the CT window to better display disease characteristics.[5,6] In applications such as chest diagnosis, CT window settings, similar to ours, are used to detect pulmonary emboli.[7,8] Such adjustments of CT window settings can also help the enhanced imaging of GGN. It is well-known that most solid lung cancers demonstrate obvious enhancement after contrast administration.[9] Moreover, the basis of enhancement is tumor angiogenesis. Swensen et al[10] believe that an enhancement of greater than 25 HU after contrast administration is an indication of a malignant lesion. Most studies about the enhancement characteristics of lung nodules have provided findings regarding solid nodules. Clinicians can better understand early lung cancers and the diagnosis of GGNs after the new classifications of lung adenocarcinomas were published. Such GGNs may be caused by partial airspace filling; interstitial thickening with inflammation, edema, fibrosis, or neoplastic proliferation; or interstitial thickening with partial airspace filling.[11]
In histopathology, type II alveolar epithelial cells and club cells may shift to AAH, AIS, or MIA along the alveoli and respiratory bronchioles.[11,12] The lesions manifest as pGGNs if they do not demonstrate invasion of the stroma, stromal proliferation, or framework collapse; while mGGNs demonstrate local multiple tumor cell pileups, framework collapse, and/or fibrous proliferation.[1,13] The enhancement patterns of preinvasive lesions, MIAs, and IACs are not clearly defined, resulting from a relative lack of research. In the past, research on lung nodule enhancement patterns mostly reported dynamic contrast features. In dynamic enhancement CT scans, patients receive more radiation; therefore, they are not commonly used, even though they can contribute to a better understanding of the enhancement features of lung nodules. Thus, in our research, we acquired contrast-enhanced scans within 60 seconds after contrast injection and compared them with unenhanced scans.[2]
4.2. Enhancement patterns of GGNs (pGGN and mGGN with no more than 5 mm solid portions) and its pathological basis
We analyzed the enhancement of preinvasive lesions, MIAs, and IACs that manifested as pGGNs and mGGNs (containing few solid portions). We divided the lesions into 2 categories of enhancement patterns: I—elevation of the mean CT value; II—enlargement of solid portions which has 2 subtypes. The enhancement patterns of GGNs are the same as those of solid lung cancers, and they depend on the types and quantities of vessels from tumor angiogenesis. Yamashita et al[9] indicated that the quantity of small vessels (diameters from 0.02–0.10 mm) correlated with maximum enhancement CT values better than those of large vessels (diameters greater than 0.1 mm) did. These vessels included microvessels which are precapillary structures with diameters normally less than 300 μm. Newly formed tumor blood vessels resemble steaks or blood sinus with thin tube walls that may incorporate only a single layer of endothelial cells. These endothelial cells are relatively immature, and frequently demonstrate fissures and the lack of basilar membranes.[14] The asymmetrical and disorderly distribution of microvessels, and the formation of extensive vascular webs lead to abundant anastomoses in tumors. Mosaic vessels, which are caused by tumor cells outside the vessels, sometimes directly connect with vessel lumens.[15]
The solid portions of nodules mostly represented fibrous proliferation, accumulations of multiple layers of tumorous cells, surrounding invasion, the collapse of alveoli, and tumor cells or secretions that fall off into the alveolar space on CT images. All the above characteristics may elevate the CT values of local tissues and may manifest as solid portions of nodules. Further elevations of CT values result from high-density contrast in the proliferative lumens of microvessels, which stimulate tumors after contrast agent administration. The solid portions of the nodules may emerge, or enlargement may occur with the gradual elevation of CT values. Our results show that the quantities of microvessels are in proportion to the malignancy of the nodules.[16–18]
4.3. Enhancement patterns in different pathological nodules
Our data revealed that, similar to some MIAs, the enhancement patterns of most preinvasive lesions mainly manifested as elevations of the mean CT value after contrast administration. Most MIAs and almost all IAC nodules manifested as enlargements of the solid portions. The development of AAH, AIS, MIA, and IAC is a dynamic process that involves multiple genes, and it is said that AAHs and AIS can develop into MIAs or IACs.[19,20] The size of an mGGN's solid portion is a clue to determine its malignancy. The bigger the solid portion, the greater the possibility of malignancy is. The invasiveness is greater if larger solid portions are found in the nodules.[12,13] Lee et al[21] indicated that the extent of the solid portions of nodules may help in the differential diagnosis of preinvasive lesions and IACs. One report stated that the prognosis of lung adenocarcinomas manifesting as pGGNs and mGGNs is better than that of ones manifesting as solid nodules.[22] pGGNs, mGGNs, or solid nodules on CT images have no strict correlations with different phases of lung adenocarcinomas. In our dataset, lesions with enhancement patterns manifested as elevated mean CT values had low malignancy grades, whereas lesions with enlargement of solid portions after contrast administration showed high malignancy grades.
4.4. Causes of solid portion enlargement after contrast administration in some preinvasive lesions
There was enlargement of the solid portions in 3 cases of preinvasive lesions after contrast administration. The solid portions of nodules are mostly tumor invasions to surrounding structures, but not in all lesions. We speculate that the solid portions of these 3 preinvasive lesions were fibrous proliferations or collapsed alveoli. Pulmonary and bronchial arteries supply the normal lung tissue. Therefore, there will be some enhancement of lesions after contrast administration, even without tumor angiogenesis.
Nakajima et al[23] reported that 10% of pGGNs were lung adenocarcinomas. In our study, a few MIA and IAC nodules, which are presented as pGGNs, showed elevations of mean CT values after contrast administration. This might have resulted from the limited resolution of the CT images, and the aerated state of the lung. Signs of tumor invasiveness observed in CT imaging are less conspicuous than those observed in microscopy.
Moreover, if the lepidic growth of tumorous cells along the alveolar wall is in multiple layers or if the lesions represented other subtypes of adenocarcinomas (such as acinar predominant, papillary predominant, micropapillary predominant, or solid predominant), the stroma of the myofibroblasts is infiltrated by tumor cells. All the above characteristics of lesions are also defined as invasion; they are presented as pGGNs on CT images resulting from low CT values, because the alveolar space was still filled with plenty of gas.
4.5. The values of enhanced CT scan in presurgical diagnosis of pGGN and mGGN (solid portions less than 5 mm)
The differential diagnosis between preinvasive lesions and MIAs is not very critical to the patient's prognosis because the 5-year disease-specific survival rate is 100% or nearly 100%.[1] Tumor size, lymph node metastasis, extent of resection, and prognosis are very different for MIAs and IACs because of the difference in their invasiveness. Therefore, it is critical to diagnose and treat patients when their lesions are still in MIA stage. Though a medium diagnostic AUC value was found to evaluate the solid portions of nodules in the differential diagnosis between MIAs and preinvasive lesions, a high diagnostic AUC value was found in the differential diagnosis between MIAs and IACs. Contrast-enhanced CT images may better help the diagnosis of both MIAs and IACs than unenhanced CT images. A diagnostic accuracy of 61.76% was achieved only based on the presurgical largest dimensions of the solid portions of the nodules. However, when combined with contrast-enhanced CT images, the diagnostic accuracy was elevated to 86.76%.
5. Conclusions
As a noninvasive examination, CT has become widely used in early lung cancer screening. It can be used to make relatively accurate diagnoses of preinvasive lesions, MIAs, and IACs. In particular, if a contrast-enhanced CT scan is performed, a good presurgical diagnosis can be made based on the enlargement of the solid portions of the nodules after contrast administration. A comprehensive evaluation, including lobulation, burrs, pleural indentations, vascular and bronchial features, and changes of nodule's solid portions after contrast administration, can help to make the diagnosis, to determine the timing of surgery, and to predict prognosis.
Footnotes
Abbreviations: AAH = atypical adenomatous hyperplasia, AIS = adenocarcinoma in situ, AUC = area under the curve, CT = computed tomography, GGOs = ground glass opacities, IAC = invasive adenocarcinoma, LLL = left lower lobe, LUL = left upper lobe, mGGNs = mixed ground glass nodules, MIA = minimal invasive adenocarcinoma, pGGNs = pure ground glass nodules, RLL = right lower lobe, RML = right middle lobe, ROC = receiver-operating characteristic, ROIs = regions of interest, RUL = right upper lobe.
FG and ML contributed equally to this paper.
Funding/support: This study was supported by the Research Program of Shanghai Hospital Development Center (SHDC22015025).
The authors report no conflicts of interest.
References
- [1].Travis WD, Brambilla E, Noguchi M, et al. International Association for the Study of Lung Cancer/American Thoracic Society/European Respiratory Society International multidisciplinary classification of lung adenocarcinoma. J Thorac Oncol 2011;6:244–85. [DOI] [PMC free article] [PubMed] [Google Scholar]
- [2].Chae EJ, Song JW, Seo JB, et al. Clinical utility of dual-energy CT in the evaluation of solitary pulmonary nodules: initial experience. Radiology 2008;249:671–81. [DOI] [PubMed] [Google Scholar]
- [3].Austin JH, Muller NL, Friedman PJ, et al. Glossary of terms for CT of the lungs: recommendations of the Nomenclature Committee of the Fleischner Society. Radiology 1996;200:327–31. [DOI] [PubMed] [Google Scholar]
- [4].Lee TY, Purdie TG, Stewart E. CT imaging of angiogenesis. Q J Nucl Med 2003;47:171–87. [PubMed] [Google Scholar]
- [5].Hoang JK, Glastonbury CM, Chen LF, et al. CT mucosal window settings: a novel approach to evaluating early T-stage head and neck carcinoma. AJR Am J Roentgenol 2010;195:1002–6. [DOI] [PubMed] [Google Scholar]
- [6].Jiang B, Takashima S, Hakucho T, et al. Adenocarcinoma of the lung with scattered consolidation: radiological-pathological correlation and prognosis. Eur J Radiol 2013;82:e623–7. [DOI] [PubMed] [Google Scholar]
- [7].Brink JA, Woodard PK, Horesh L, et al. Depiction of pulmonary emboli with spiral CT: optimization of display window settings in a porcine model. Radiology 1997;204:703–8. [DOI] [PubMed] [Google Scholar]
- [8].Bae KT, Mody GN, Balfe DM, et al. CT depiction of pulmonary emboli: display window settings. Radiology 2005;236:677–84. [DOI] [PubMed] [Google Scholar]
- [9].Yamashita K, Matsunobe S, Takahashi R, et al. Small peripheral lung carcinoma evaluated with incremental dynamic CT: radiologic-pathologic correlation. Radiology 1995;196:401–8. [DOI] [PubMed] [Google Scholar]
- [10].Swensen SJ, Viggiano RW, Midthun DE, et al. Lung nodule enhancement at CT: multicenter study. Radiology 2000;214:73–80. [DOI] [PubMed] [Google Scholar]
- [11].Park CM, Goo JM, Lee HJ, et al. Nodular ground-glass opacity at thin-section CT: histologic correlation and evaluation of change at follow-up. Radiographics 2007;27:391–408. [DOI] [PubMed] [Google Scholar]
- [12].Kim HY, Shim YM, Lee KS, et al. Persistent pulmonary nodular ground-glass opacity at thin-section CT: histopathologic comparisons. Radiology 2007;245:267–75. [DOI] [PubMed] [Google Scholar]
- [13].Henschke CI, Yankelevitz DF, Mirtcheva R, et al. CT screening for lung cancer: frequency and significance of part-solid and nonsolid nodules. AJR Am J Roentgenol 2002;178:1053–7. [DOI] [PubMed] [Google Scholar]
- [14].Jain RK. Delivery of novel therapeutic agents in tumors: physiological barriers and strategies. J Natl Cancer Inst 1989;81:570–6. [DOI] [PubMed] [Google Scholar]
- [15].Weidner N, Semple JP, Welch WR, et al. Tumor angiogenesis and metastasis: correlation in invasive breast carcinoma. N Engl J Med 1991;324:1–8. [DOI] [PubMed] [Google Scholar]
- [16].Bettencourt MC, Bauer JJ, Sesterhenn IA, et al. CD34 immunohistochemical assessment of angiogenesis as a prognostic marker for prostate cancer recurrence after radical prostatectomy. J Urol 1998;160:459–65. [PubMed] [Google Scholar]
- [17].Weidner N. Intratumor microvessel density as a prognostic factor in cancer. Am J Pathol 1995;147:9–19. [PMC free article] [PubMed] [Google Scholar]
- [18].Koukourakis MI, Giatromanolaki A, Thorpe PE, et al. Vascular endothelial growth factor/KDR activated microvessel density versus CD31 standard microvessel density in non-small cell lung cancer. Cancer Res 2000;60:3088–95. [PubMed] [Google Scholar]
- [19].Lee HJ, Goo JM, Lee CH, et al. Nodular ground-glass opacities on thin-section CT: size change during follow-up and pathological results. Korean J Radiol 2007;8:22–31. [DOI] [PMC free article] [PubMed] [Google Scholar]
- [20].Soda H, Nakamura Y, Nakatomi K, et al. Stepwise progression from ground-glass opacity towards invasive adenocarcinoma: long-term follow-up of radiological findings. Lung Cancer 2008;60:298–301. [DOI] [PubMed] [Google Scholar]
- [21].Lee SM, Park CM, Goo JM, et al. Invasive pulmonary adenocarcinomas versus preinvasive lesions appearing as ground-glass nodules: differentiation by using CT features. Radiology 2013;268:265–73. [DOI] [PubMed] [Google Scholar]
- [22].Park JH, Lee KS, Kim JH, et al. Malignant pure pulmonary ground-glass opacity nodules: prognostic implications. Korean J Radiol 2009;10:12–20. [DOI] [PMC free article] [PubMed] [Google Scholar]
- [23].Nakajima R, Yokose T, Kakinuma R, et al. Localized pure ground-glass opacity on high-resolution CT: histologic characteristics. J Comput Assist Tomogr 2002;26:323–9. [DOI] [PubMed] [Google Scholar]


