Abstract
Purpose
To examine the performance of the PROMIS Upper Extremity Function CAT relative to the PROMIS Physical Function CAT in patients seeking specialty care for upper extremity conditions.
Methods
This observational trial analyzed prospectively collected PROMIS Upper Extremity and Physical Function CAT scores from 5202 adult patients with 10344 outpatient clinic visits presenting to a tertiary orthopaedic clinic. Pearson’s correlation coefficient was utilized to evaluate the association between initial Physical Function and Upper Extremity scores, as well as the association between changes in Physical Function and Upper Extremity scores between visits. Differences in scores between populations presenting with hand conditions versus shoulder and elbow conditions were evaluated via Student’s t test, as were differences in scores between new and return patient visits.
Results
PROMIS Upper Extremity CAT scores were strongly correlated with PROMIS Physical Function CAT scores. However, patients averaged 8 points lower scoring on Upper Extremity CAT testing compared to Physical Function CAT scores. The Upper Extremity CAT demonstrated a ceiling effect at a score of 56 that impacted 7% of patients with a secondary ceiling at 50. Change in Physical Function and Upper Extremity scores between visits were moderately correlated with a mean difference of less than 1 point. Patients presenting for hand conditions achieved better Physical Function and Upper Extremity scores than patients presenting for shoulder and elbow conditions.
Conclusions
The PROMIS Upper Extremity module appears responsive to changes over time. However, the current Upper Extremity CAT has a ceiling score of 56 which does not allow for improvement of scores 0.6 SD higher than the presumptive normative population mean of 50. Although a specific assessment of upper extremity function is desirable, continued refinement of the PROMIS Upper Extremity CAT is required to better assess patients with higher levels of function.
Keywords: ceiling, hand, physical function, PROMIS, upper extremity
INTRODUCTION
Health care payers are now considering outcome data when assessing the cost-effectiveness of care and setting reimbursement rates1,2. As such, patient-reported outcome measures (PROMs) are increasingly emphasized. Intending on improving traditional PROMs delivered as fixed-length surveys limited by floor and ceiling effects and increased responder burden3,4, the National Institutes of Health commissioned the Patient-Reported Outcomes Measurement Information System (PROMIS). PROMIS utilizes item-response theory (IRT) and computer adaptive testing (CAT) to efficiently and precisely report patient symptoms and perceived function5,6. All PROMIS domain scores are normalized to a mean score of 50 and standard deviation of 10 intending to minimize floor and ceiling effects and ensure the results are readily understood and communicated7. Higher scores on all PROMIS CATs indicate more of the domain measured such that higher scores on Physical Function are associated with greater function.
The most rigorously evaluated PROMIS musculoskeletal domain is the Physical Function CAT, having been administered to patients with conditions of both the upper and lower extremities. A comparison of the PROMIS Physical Function CAT and the DASH found that the two instruments were strongly correlated with the PROMIS Physical Function CAT taking 75% less time to complete8. The Physical Function CAT also correlates well with the shortened QuickDASH9. However, PROMIS Physical Function is an imperfect measure in patients with primarily upper-extremity symptoms. Ceiling effects have been noted which may be due to the Physical Function CAT failing to select upper extremity questions for delivery and an insufficient number of high-difficulty upper extremity questions10. Furthermore, Hung et al. have identified relevant variance between patients with upper and lower extremity conditions when assessed with the PROMIS Physical Function CAT10.
A PROMIS Upper-Extremity CAT has been developed to more precisely evaluate outcomes in hand and upper extremity conditions with advantages and disadvantages noted by early research 11. This Upper Extremity CAT strongly correlates with both the DASH and QuickDASH as well as the PROMIS Physical Function CAT 3,11. The Upper Extremity CAT required the fewest questions and demonstrated high internal consistency, interperson reliability, and item reliability but responsiveness to change was not determined 3,4,12. Doring et al. found that the average PROMIS Upper Extremity scores indicated greater disability than general Physical Function scores in patients with symptomatic upper extremities3. That study, and several others5,13, reported no ceiling effect to the Upper Extremity CAT, however Beckman et al. reported that 10.8% of their population reached the maximum score which would compromise the surgeon’s ability to appropriately demonstrate treatment value14. Hung et al. also reported a ceiling effect without identification of a specific maximal score but reported the Upper Extremity CAT to be adequately reliable with good fit15. Provided these conflicting findings, the primary aim of this study was to evaluate the performance of the PROMIS Upper Extremity CAT for patients with upper extremity conditions relative to PROMIS Physical Function in a large patient cohort. We tested the null hypothesis that the PROMIS Upper Extremity CAT would demonstrate comparable ceiling and floor effects and correlate with PROMIS Physical Function scores. The secondary aim was to evaluate for differences in scores between patients with hand versus shoulder and elbow conditions.
METHODS
This observational trial analyzed prospectively collected PROMIS scores drawn from a series of greater than 10,614 consecutive outpatient clinic visits of 5,278 adult patients presenting to a tertiary upper extremity clinic from 6/22/2015–10/5/2016. Our Institutional Review Board deemed this study exempt as only de-identified data were used. At registration patients were given a tablet computer (iPad mini, Apple, Cupertino, CA) that automatically loads the designated PROMIS CATs. Those patients visiting one of four upper extremity-trained surgeons were administered both electronic PROMIS Physical Function-v1.2 and Upper Extremity-v1.0 CATs. Scores from patients who completed both CATs at one or more visits were included in the analysis. After applying these criteria, our final study group included data from 5202 patients with 10344 office visits. Data integrity was verified during this study period with capture and completion rates above 97% of all patients presenting to our center. Patient information was de-identified prior to use.
Statistical Analysis
Pearson correlations were used to evaluate the relationship between initial PROMIS Physical Function and Upper Extremity scores, the relationship of change in PROMIS scores from the first to second visit between the two modules, and the relationship of initial scores and change in scores with patient age at first clinic visit. Correlation coefficients (r) were interpreted as recommended by Evans: 0.00–0.19 very weak, 0.20–0.39 weak, 0.40–0.59 moderate, 0.60–0.79 strong, 0.80–1.00 very strong16. One-way ANOVA tested the impact of race and sex on the initial scores and magnitude of change in Physical Function and Upper Extremity scores. Paired Student’s t tests were used to compare the initial PROMIS Physical Function and Upper Extremity scores between patient populations (hand versus shoulder/elbow), as well as the magnitude of change in each score.
This study was designed to report on our department’s entire experience with the PROMIS Upper Extremity CAT to date at study inception. A power analysis confirmed that we were adequately powered for our smallest subgroup analysis (1800 patients with multiple visits to evaluate responsiveness) as 1294 patients would have provided 95% power to detect correlations at the level of r=0.10 with an α=0.05.
RESULTS
After applying the inclusion criteria, 5202 patients contributed data for analysis (Table 1). Patients in this cohort averaged 6 points (effect size 0.6) worse than the expected normal population mean in Physical Function scores but 15 points (effect size 1.5) worse in Upper Extremity scores (Table 2, Figure 1). Initial Physical Function and Upper Extremity scores were strongly correlated (r=0.69, P<0.05) (Figure 2). A mean difference of 8.4 was demonstrated between paired Physical Function and Upper Extremity scores (95% CI 8.2–8.6, P<0.05) (Figure 3). As Physical Function scores increased the Upper Extremity scores diverged such that they indicated progressively greater disability as patients reported higher perceived function (Figure 4). Initial scores on both the Physical Function and Upper Extremity CATs were higher for males (PF: 45 vs 42, UE: 37 vs 34) and Caucasian patients (PF:44 vs 42, UE:36 vs 32). Advancing age demonstrated a weak negative correlation with Physical Function (r=−.25) and Upper Extremity scores (r=−.15) (P<0.05).
Table 1.
Demographic characteristics of the 5202 patients included in the study population
| Age years (S.D.) | 55 (16) | |
|---|---|---|
| Sex | Male | 2485 (47.8%) |
| Female | 2717 (52.2%) | |
|
| ||
| Race | Caucasian/White | 4446 (85.5%) |
| African-American/Black | 621 (11.9%) | |
| Other | 135 (2.6%) | |
|
| ||
| Affected Region | Hand | 1921 (36.9%) |
| Shoulder/Elbow | 3281 (63.1%) | |
Table 2.
Mean, standard deviation, and range for initial PROMIS Physical Function and PROMIS Upper Extremity scores of the study population.
| PROMIS CAT | Mean (SD) | Range | Floor Effect | Ceiling Effect |
|---|---|---|---|---|
| Upper Extremity | 35 (10) | 15–56 | 1.2% | 7.2% |
| Physical Function | 44 (10) | 15–73 | 0.2% | 0.6% |
Figure 1.
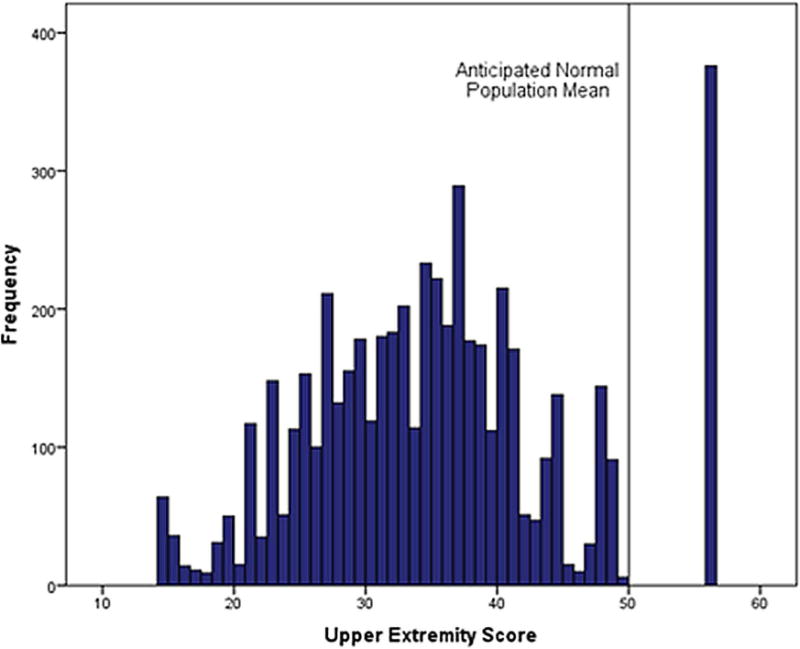
Histogram of initial PROMIS Upper Extremity scores.
Figure 2.
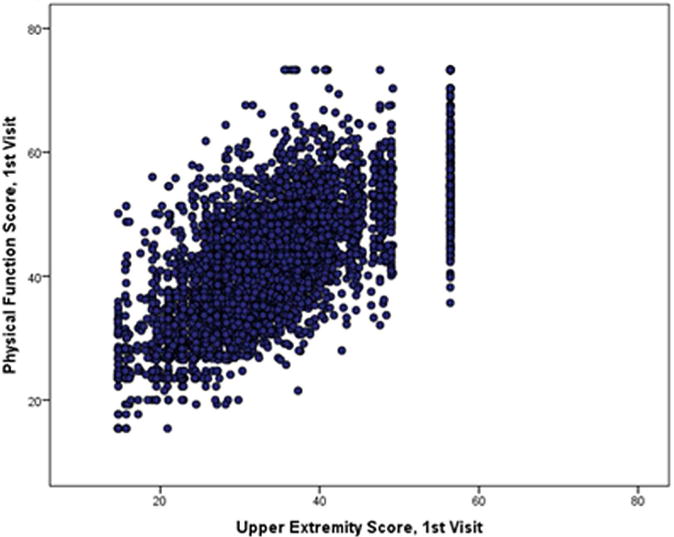
Correlation between initial PROMIS Physical Function and PROMIS Upper Extremity scores.
Figure 3.
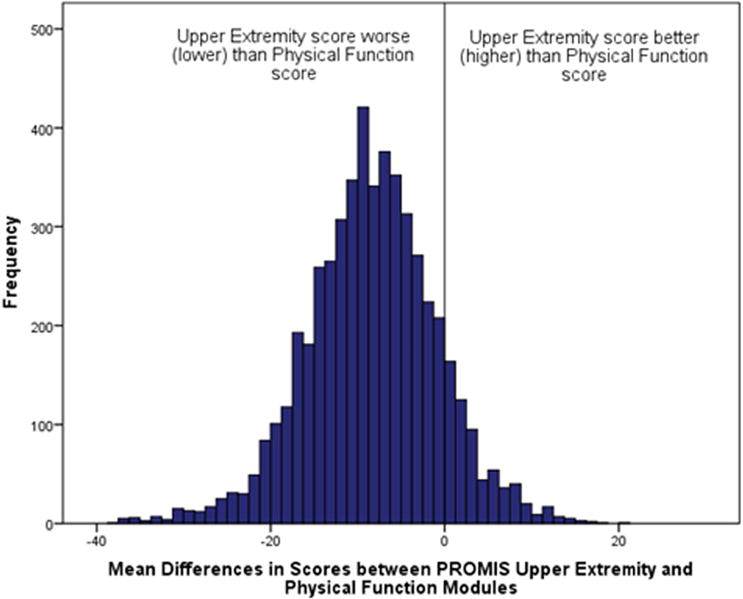
Histogram of differences between initial PROMIS Upper Extremity and PROMIS Physical Function scores.
Figure 4.
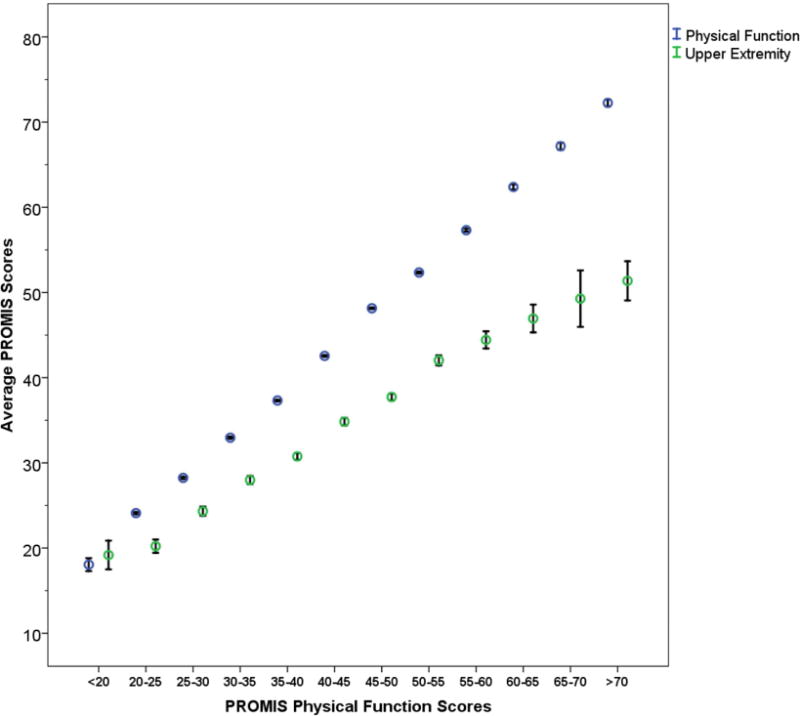
Mean values of PROMIS Upper Extremity and Physical Function scores according to 5 point binned categories of Physical Function. Bars = 95% confidence intervals.
1800 patients had both initial and return visits within the time frame of the study. A moderate correlation was demonstrated between the changes in Physical Function scores between visits with the changes in Upper Extremity scores (r=0.53, P<0.05) (Figure 5). The magnitude of change in the Upper Extremity scores (mean 6.1, SD 5.8) and Physical Function scores (mean 6.0, SD 5.8) for each patient was comparable with an absolute mean difference of 0.8 (95% CI 0.4–1.2, P<0.05). There was no correlation between patients’ age and change in Physical Function (r= −0.05) or Upper Extremity scores (r= −0.06) and no statistically significant association between sex or race with magnitude of change in either Physical Function (P=0.052, P= 0.60) or Upper Extremity scores (P=0.12, P= 0.60).
Figure 5.
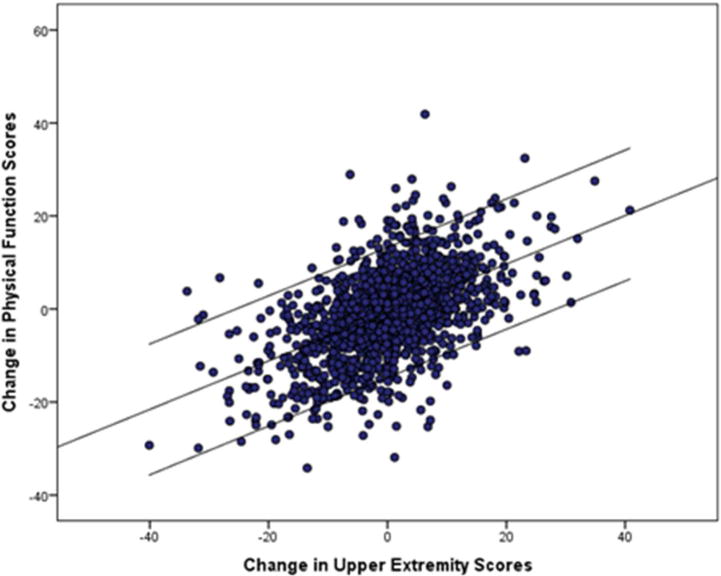
Change in PROMIS Physical Function scores between visits versus change in PROMIS Upper Extremity scores between visits with central best fit line and bordering 95% confidence intervals.
Patients presenting for a hand condition demonstrated higher initial Upper Extremity scores (P<0.05) and Physical Function scores (P<0.05) than patients presenting with shoulder or elbow conditions (Table 3). There was no difference in the magnitude of change in scores demonstrated by each group (P=0.41).
Table 3.
Average initial PROMIS Physical Function and PROMIS Upper Extremity scores for patients presenting with hand versus shoulder/elbow conditions.
| Physical Function (SD) | Upper Extremity (SD) | |
|---|---|---|
| Hand | 47 (10) | 38 (10) |
| Shoulder/Elbow | 42 (9) | 34 (9) |
DISCUSSION
The Upper Extremity CAT was developed with the intent of creating a measure that more accurately assessed upper extremity function than the Physical Function module10,11. Since the test has been made available, the Upper Extremity CAT has been shown to be both reliable and consistent. Our data indicated a strong correlation between Upper Extremity and Physical Function scores, a finding that confirms published correlations ranging from 0.48 to 0.773,11,14 However, when administering both the Upper Extremity CAT and Physical Function CAT to patients with upper extremity conditions, they indicate differential levels of absolute impairment. In our population of over 5000 patients, Upper Extremity scores consistently indicated greater disability but, in a non-uniform manner with the discrepancy increasing with better overall physical function. Doring et al. found a similar direction of disparity within 84 patients attending a hand clinic, with the Upper Extremity scores being on average 10 points lower than the Physical Function score3. It is intended that all PROMIS scores are standardized to a mean of 50 with a standard deviation of 10 in a normative population. However, the Upper Extremity function assessment produces a non-normal distribution that abruptly stops just above the presumed population mean. The mean difference of 8 points between Upper Extremity scores and Physical Function scores found in our study is presumably clinically relevant with an effect size of that difference of 0.8, suggesting function nearly a full standard deviation worse on the Upper Extremity CAT relative to the Physical Function CAT.
The difference in scores between the Upper Extremity and the Physical Function CAT may be due to the Upper Extremity module more precisely capturing the impact of isolated upper extremity conditions. However, another reason for this difference in scores is the strong ceiling effect in Upper Extremity scores. This inability to distinguish high levels of function would explain the increasing difference noted between Upper Extremity and Physical Function scores as patients are higher functioning overall. Hung recently reported that the Upper Extremity CAT demonstrated good psychometric properties but acknowledged a ceiling effect when analyzing 1,197 patient visits for hand conditions15. Doring et al reported no ceiling effect (0%) within their Upper Extremity data, but their data suggest a similar maximal score at approximately 56 3. It has been presumed that PROMIS scores can theoretically range from 0–100. However, Physical Function scores, in both this study and others, consistently fall within the range of 15–733,8. An even narrower range of possible scores is demonstrated by Upper Extremity scores3,13,14. Our data demonstrates a maximum PROMIS Upper Extremity score of 56, occurring in 7.2% of visits, while only 0.6% reached the maximum Physical Function score of 73. Notably, there is no difference between patients reporting the floor score on the Upper Extremity and Physical Function CATs (1.2% vs 0.2%). These data are comparable to examinations of the DASH which report no floor effect (0%) but a variable ceiling effect representing best function in 0.05%–7%17–20. There is also a secondary ceiling indicated by the gap in Upper Extremity scores between 50 and 56, where not a single patient scored within this range. That gap also appears consistent with data from Doring et al3. Considering the non-normal distribution and scale truncated upper scoring at 56, scores of 50 or above on the Upper Extremity CAT must be viewed qualitatively as good function as opposed to a true “mean” score and treatment effects will only be captured in patients with substantial perceived impairment.
While studies comparing PROMIS scores between patients with hand and patients with shoulder conditions are lacking, the DASH questionnaire has frequently been utilized within both groups. Using DASH scores at presentation, studies of thumb arthritis and surgical shoulder conditions suggest similar degrees of functional impairment21–24. However, others have found a significant difference between shoulder and hand populations with the hand population reporting better function by an average of 14 points on the DASH17,25. Within our study population, patients presenting with hand conditions reported better average function than patients with shoulder conditions. At this point, we cannot definitively determine if this represents globally worse self-perceived function or is a function of the content assessed by the PROMIS CATs.
Questionnaires specific to the upper extremity are more frequently used in hand and shoulder clinics than general physical function metrics due to their increased responsiveness to clinical improvement. Thus, the PROMIS Upper Extremity CAT may be more appealing to surgeons who primarily treat these populations. Our data indicates that while the Upper Extremity CAT does correlate with the widely used Physical Function test and demonstrates similar magnitudes of change (responsiveness) in scores over time, the resulting scores cannot be directly compared to Physical Function scores. Thus, when utilizing PROMIS scores to compare function across a variety of conditions, it may be more appropriate to use PROMIS Physical Function scores. If analysis will exclusively examine patients with upper extremity conditions associated with substantial functional impairment, the Upper Extremity CAT may be a useful alternative. If a patient scores at or above 50 at presentation, no treatment benefit will be recognized by this measure, and an alternative outcome measure may be more appropriate. Additionally, further research is needed to understand how Upper Extremity CAT scores correlate with other legacy outcome scales for specific disease states of the upper extremity.
Our study has several limitations. We have accepted an inconsistent amount of time between visits and cannot comment on treatment delivered between visits. However, we believe that this did not detract from our primary or secondary aim of this study, which focused on the relative performance and responsiveness of these PROMIS CATs as opposed to describing treatment outcomes. Second, we have broadly assessed populations of patients with either hand or shoulder/elbow conditions. There may be relevant differences in the performance of PROMIS CATs according to specific diagnoses within each of these anatomic regions that are not identified in our data. Finally, although we have found similar change over time on the PROMIS Physical Function and Upper Extremity CATs, future studies are needed to address whether the Upper Extremity CAT is appropriately responsive to change in upper extremity function after specific treatment interventions.
PROMIS CATs are still being developed and refined for assessing musculoskeletal health. We anticipate that extremity specific CATs could offer greater responsiveness to treatment and sensitivity to impairment at the expense of potentially compromising comparability of scores across orthopaedic conditions. However, at this time, the PROMIS Upper Extremity CAT does not demonstrate superiority over the Physical Function CAT and would be most improved by expanding its ability to distinguish higher levels of upper extremity function. An updated Upper Extremity CAT v2.0 is coming out in the near future with a scoring transformation available for v1.0 scores. This update has moved upper extremity items to their own scale instead of fitting them onto the metric used for general Physical Function. This may fill in the scores between 50 and 56 but is anticipated to increase the maximal score only slightly. Therefore, the ceiling effect may persist and deserves ongoing investigation.
Acknowledgments
Funding: Research reported in this publication was supported by the Washington University Institute of Clinical and Translational Sciences grant UL1TR000448, sub-award TL1TR000449, from the National Center for Advancing Translational Sciences (NCATS) of the National Institutes of Health (NIH), and Siteman Comprehensive Cancer Center and NCI Cancer Center Support Grant P30 CA091842, which supported the maintenance and use of REDCap electronic data capture tools, hosted in the Biostatistics Division of Washington University School of Medicine. The content is solely the responsibility of the authors and does not necessarily represent the official view of the NIH. This funding did not play a direct role in this investigation.
Footnotes
Publisher's Disclaimer: This is a PDF file of an unedited manuscript that has been accepted for publication. As a service to our customers we are providing this early version of the manuscript. The manuscript will undergo copyediting, typesetting, and review of the resulting proof before it is published in its final citable form. Please note that during the production process errors may be discovered which could affect the content, and all legal disclaimers that apply to the journal pertain.
Level of Evidence: Level II, Diagnostic
References
- 1.Beckmann JT, Hung M, Bounsanga J, Wylie JD, Granger EK, Tashjian RZ. Psychometric evaluation of the PROMIS Physical Function Computerized Adaptive Test in comparison to the American Shoulder and Elbow Surgeons score and Simple Shoulder Test in patients with rotator cuff disease. J Shoulder Elbow Surg. 2015;24(12):1961–1967. doi: 10.1016/j.jse.2015.06.025. [DOI] [PubMed] [Google Scholar]
- 2.Chung K, Burns P, Sears E. Outcomes research in hand surgery: where have we been and where should we go? Journal of Hand Surgery. 2006;31(8):1373–1379. doi: 10.1016/j.jhsa.2006.06.012. [DOI] [PubMed] [Google Scholar]
- 3.Döring AC, Nota SP, Hageman MG, Ring DC. Measurement of upper extremity disability using the Patient-Reported Outcomes Measurement Information System. J Hand Surg Am. 2014;39(6):1160–1165. doi: 10.1016/j.jhsa.2014.03.013. [DOI] [PubMed] [Google Scholar]
- 4.Fries J, Krishnan E, Rose M, Lingala B, Bruce B. Improved Responsiveness and Reduced Sample Size Requirements of PROMIS Physical Function Scales with Item Response Theory. Arthritis Research and Therapy. 2011;13(5):147. doi: 10.1186/ar3461. [DOI] [PMC free article] [PubMed] [Google Scholar]
- 5.Morgan JH, Kallen MA, Okike K, Lee OC, Vrahas MS. PROMIS Physical Function Computer Adaptive Test Compared With Other Upper Extremity Outcome Measures in the Evaluation of Proximal Humerus Fractures in Patients Older Than 60 Years. J Orthop Trauma. 2015;29(6):257–263. doi: 10.1097/BOT.0000000000000280. [DOI] [PubMed] [Google Scholar]
- 6.Cella D, Yount S, Rothrock N, et al. The Patient-Reported Outcomes Measurement Information System (PROMIS): Progress of an NIH Roadmap Cooperative Group during Its First Two Years. Medical Care. 2007;45(5):S3–S11. doi: 10.1097/01.mlr.0000258615.42478.55. [DOI] [PMC free article] [PubMed] [Google Scholar]
- 7.Brodke D, Saltzman C, Brodke D. PROMIS for Orthopaedic Outcomes Measurement. Journal of the American Academy of Orthopaedic Surgeons. 2016;24(11):744–749. doi: 10.5435/JAAOS-D-15-00404. [DOI] [PubMed] [Google Scholar]
- 8.Tyser AR, Beckmann J, Franklin JD, et al. Evaluation of the PROMIS physical function computer adaptive test in the upper extremity. J Hand Surg Am. 2014;39(10):2047–2051.e2044. doi: 10.1016/j.jhsa.2014.06.130. [DOI] [PubMed] [Google Scholar]
- 9.Overbeek CL, Nota SP, Jayakumar P, Hageman MG, Ring D. The PROMIS physical function correlates with the QuickDASH in patients with upper extremity illness. Clin Orthop Relat Res. 2015;473(1):311–317. doi: 10.1007/s11999-014-3840-2. [DOI] [PMC free article] [PubMed] [Google Scholar]
- 10.Hung M, Clegg DO, Greene T, Saltzman CL. Evaluation of the PROMIS physical function item bank in orthopaedic patients. J Orthop Res. 2011;29(6):947–953. doi: 10.1002/jor.21308. [DOI] [PubMed] [Google Scholar]
- 11.Hays RD, Spritzer KL, Amtmann D, et al. Upper-extremity and mobility subdomains from the Patient-Reported Outcomes Measurement Information System (PROMIS) adult physical functioning item bank. Arch Phys Med Rehabil. 2013;94(11):2291–2296. doi: 10.1016/j.apmr.2013.05.014. [DOI] [PMC free article] [PubMed] [Google Scholar]
- 12.Fries J, Rose M, Krishnan E. The PROMIS of better outcome assessment: responsiveness, floor and ceiling effects, and Internet administration. Journal of Rheumatology. 2011;38(8):1759–1764. doi: 10.3899/jrheum.110402. [DOI] [PMC free article] [PubMed] [Google Scholar]
- 13.Peters RM, Menendez ME, Mellema JJ, Ring D, Vranceanu AM. Sleep Disturbance and Upper-Extremity Disability. Arch Bone Jt Surg. 2016;4(1):35–40. [PMC free article] [PubMed] [Google Scholar]
- 14.Beckmann JT, Hung M, Voss MW, Crum AB, Bounsanga J, Tyser AR. Evaluation of the Patient-Reported Outcomes Measurement Information System Upper Extremity Computer Adaptive Test. J Hand Surg Am. 2016;41(7):739–744.e734. doi: 10.1016/j.jhsa.2016.04.025. [DOI] [PubMed] [Google Scholar]
- 15.Hung M, Voss MW, Bounsanga J, Crum AB, Tyser AR. Examination of the PROMIS upper extremity item bank. J Hand Ther. 2016 doi: 10.1016/j.jht.2016.10.008. [DOI] [PMC free article] [PubMed] [Google Scholar]
- 16.Evans JD. Straightforward statistics for the behavioral sciences. Pacific Grove, CA: Brooks/Cole Publishing; 1996. [Google Scholar]
- 17.Beaton DE, Katz JN, Fossel AH, Wright JG, Tarasuk V, Bombardier C. Measuring the whole or the parts? Validity, reliability, and responsiveness of the Disabilities of the Arm, Shoulder and Hand outcome measure in different regions of the upper extremity. J Hand Ther. 2001;14(2):128–146. [PubMed] [Google Scholar]
- 18.Angst F, John M, Pap G, et al. Comprehensive assessment of clinical outcome and quality of life after total elbow arthroplasty. Arthritis Rheum. 2005;53(1):73–82. doi: 10.1002/art.20911. [DOI] [PubMed] [Google Scholar]
- 19.Raven EE, Haverkamp D, Sierevelt IN, et al. Construct validity and reliability of the disability of arm, shoulder and hand questionnaire for upper extremity complaints in rheumatoid arthritis. J Rheumatol. 2008;35(12):2334–2338. doi: 10.3899/jrheum.080067. [DOI] [PubMed] [Google Scholar]
- 20.Slobogean GP, Noonan VK, O’Brien PJ. The reliability and validity of the Disabilities of Arm, Shoulder, and Hand, EuroQol-5D, Health Utilities Index, and Short Form-6D outcome instruments in patients with proximal humeral fractures. J Shoulder Elbow Surg. 2010;19(3):342–348. doi: 10.1016/j.jse.2009.10.021. [DOI] [PubMed] [Google Scholar]
- 21.Koorevaar RC, van ‘t Riet E, Gerritsen MJ, Madden K, Bulstra SK. The Influence of Preoperative and Postoperative Psychological Symptoms on Clinical Outcome after Shoulder Surgery: A Prospective Longitudinal Cohort Study. PLoS One. 2016;11(11):e0166555. doi: 10.1371/journal.pone.0166555. [DOI] [PMC free article] [PubMed] [Google Scholar]
- 22.Polson K, Reid D, McNair P, Larmer P. Responsiveness, minimal importance difference and minimal detectable change scores of the shortened disability arm shoulder hand (QuickDASH) questionnaire. Manual Therapy. 2010;15:404–407. doi: 10.1016/j.math.2010.03.008. [DOI] [PubMed] [Google Scholar]
- 23.Bisneto EN, Freitas MC, Paula EJ, Mattar R, Zumiotti AV. Comparison between proximal row carpectomy and four-corner fusion for treating osteoarthrosis following carpal trauma: a prospective randomized study. Clinics (Sao Paulo) 2011;66(1):51–55. doi: 10.1590/S1807-59322011000100010. [DOI] [PMC free article] [PubMed] [Google Scholar]
- 24.Davis TR, Pace A. Trapeziectomy for trapeziometacarpal joint osteoarthritis: is ligament reconstruction and temporary stabilisation of the pseudarthrosis with a Kirschner wire important? J Hand Surg Eur Vol. 2009;34(3):312–321. doi: 10.1177/1753193408098483. [DOI] [PubMed] [Google Scholar]
- 25.Kachooei AR, Moradi A, Janssen SJ, Ring D. The influence of dominant limb involvement on DASH and QuickDASH. Hand (N Y) 2015;10(3):512–515. doi: 10.1007/s11552-014-9734-7. [DOI] [PMC free article] [PubMed] [Google Scholar]


