Abstract
Background
Although time-domain measures of heart rate variability (HRV) are used to estimate cardiac autonomic tone and disease risk in multi-ethnic populations, the genetic epidemiology of HRV in Hispanics/Latinos has not been characterized.
Objective
Conduct a genome-wide association study (GWAS) of heart rate (HR) and its variability in the Hispanic Community Health Study / Study of Latinos, Multi-Ethnic Study of Atherosclerosis, and Women's Health Initiative Hispanic SNP-Health Association Resource project (n=13,767).
Methods
We estimated HR (beats/min), the standard deviation of normal-to-normal inter-beat intervals (SDNN, ms), and the root mean squared difference in successive, normal-to-normal inter-beat intervals (RMSSD, ms) from resting, standard twelve-lead electrocardiograms. We estimated associations between each phenotype and 17 million genotyped or imputed single nucleotide polymorphisms (SNPs), accounting for relatedness and adjusting for age, sex, study site, and ancestry. Cohort-specific estimates were combined using fixed-effects, inverse-variance meta-analysis. We investigated replication for select SNPs exceeding genome-wide (P<5×10⁻⁸) or suggestive (P<10-6) significance thresholds.
Results
Two genome-wide significant SNPs replicated in a European ancestry cohort, one for RMSSD (rs4963772; chromosome 12) and another for SDNN (rs12982903; chromosome 19). A suggestive SNP for HR (rs236352; chromosome 6) replicated in an African American cohort. Functional annotation of replicated SNPs in cardiac and neuronal tissues identified potentially causal variants and mechanisms.
Conclusions
This first GWAS of HRV and HR in Hispanics/Latinos underscores the potential for even modestly-sized samples of non-European ancestry to inform the genetic epidemiology of complex traits.
Keywords: Epidemiology, Genetic Association Studies, Electrocardiogram (ECG), Autonomic Nervous System, Ion Channels/Membrane Transport
Introduction
Elevated resting heart rate (HR) is associated with various cardiovascular diseases, including hypertension,1 acute myocardial infarction,2, 3 and sudden cardiac death.4 Even at rest, HR fluctuates cyclically, because it is autonomically influenced by baroreflex tone, vagal outflow, neurohumoral rhythms, emotion, and other factors.5 Cyclical HR fluctuation—termed heart rate variability (HRV)—is measured by time- and frequency-domain electrocardiogram (ECG) metrics.5 The relevance of these metrics for predicting morbidity and mortality independent of HR is well recognized.
Although HR and HRV have been used to estimate cardiac autonomic tone and disease risk in multi-ethnic populations, their genetic characterization remains incomplete despite substantial heritability.6, 7 The only HRV GWAS reported to date8 was small (n=747 related individuals) and used a lenient threshold for statistical significance (P<10-3). Furthermore, because HR GWAS have been conducted in European ancestry9, African American10, and Asian11 populations, the relevance of the identified loci to other populations remains unknown. Cardiovascular genetics may be particularly important for Hispanics/Latinos12, 13 due to their disproportionate burden of cardiac problems. Failures to extend GWAS analyses to diverse populations can reduce their global relevance and represent missed opportunities for discoveries and biological insights.14 We report the first GWAS of HR and HRV in Hispanic/Latino populations, providing new information about cardiac autonomic phenotypes in an understudied population.
Methods
HR and HRV
Standard, twelve-lead ECGs were digitally recorded from resting, supine, or semi-recumbent participants using comparable procedures across cohorts (Supplemental Methods).
Genotyping
Supplementary Table S1 lists the genotyping platforms and algorithms; SNP inclusion criteria; quality control; and imputation software. Imputation was based on the 1000 Genomes phase 1 reference panel15. We tested only SNPs and no insertions/deletions.
Statistical Analyses
GWAS scans of HR, RMSSD, and SDNN were performed separately for the Hispanic Community Health Study/Study of Latinos (HCHS/SOL), Women's Health Initiative (WHI) Hispanics, and Multi-Ethnic Study of Atherosclerosis (MESA) Hispanics. We combined results from these cohorts via inverse variance-weighted fixed effects meta-analysis. The P-value threshold for genome-wide statistical significance was 5 × 10⁻⁸ (the standard GWAS threshold16). P-values <10-6 were considered suggestive. Significant and suggestive were assessed in Phase 2 only if the minor allele frequency was >1% and the SNP represented a novel locus. We attempted replication separately in African Americans (AA) and European (EA) ancestry cohorts. No independent Hispanic/Latinos cohorts were available. The P-value threshold for replicating the five HRV SNPs was 0.05/10=0.005 (five SNPs evaluated in AA and EA – ten hypothesis tests). Similarly, the P-value threshold for replicating the two HR SNPs was 0.05/4=0.0125. Phase 2 used one-sided P-values.
We analyzed natural log of RMSSD and SDNN and untransformed HR. Analysis models adjusted for age, sex, BMI (HR only) and appropriate study-specific covariates (e.g., principal components of ancestry; Supplementary Methods). HCHS/SOL used mixed models accounting for genetic relatedness among participants and the study's complex sampling design.17 We investigated genomic inflation using λGC and quantile-quantile plots of P-values. Associated loci were visualized using LocusZoom.18 Meta-analysis results are available on dbGaP (https://www.ncbi.nlm.nih.gov/gap; accession number phs000930).
Participants were excluded from analysis for: atrial fibrillation; heart failure; angina; pacemaker implantation; ectopic beats; poor quality ECG; too few intervals for calculating HRV; HR <40 or HR >120; use of tricyclic antidepressant or anti-arrhythmic medications. HR analyses also excluded participants taking beta-blockers. Jackson Heart Study (JHS; Phase 2 cohort) also excluded participants taking digoxin or anticholinergic medications.
SNPs were excluded from Phase 1 analysis if the effective count of the minor allele was <30 or imputation quality was poor (RSQ ≤0.3). Effective count was defined as 2*MAF*(1-MAF)*n*oevar, where oevar measures imputation quality.
We examined whether SNP associations with HR from GWAS in European ancestry9 generalize to Hispanics/Latinos. The approach summarizes the evidence with an “r-value” and rejects the generalization null hypothesis for r-values <0.05,19 controlling the false discovery rate at 5%. We further investigated generalization with a figure comparing reported associations to Hispanic/Latino results.
We interrogated replicated loci to identify potentially causal variants. Briefly, we assessed whether variants lie within putative regulatory regions identified from ChIP-Seq (chromatin immunoprecipitation followed by sequencing) signals (Supplementary Methods). We prioritized SNPs within a putative promoter or enhancer that overlapped with a DNaseI hypersensitive site. To hypothesize likely modes of action for these potentially causal variants, we report eQTL targets and/or motifs disrupted by prioritized variants.
Results
The discovery study included 13,767 Hispanics/Latinos from three cohorts (13,184 for HR), with HCHS/SOL contributing 84% of participants. Phase 2 included a European ancestry cohort (4,730 participants for HRV traits; 7,073 for HR; females only) and African American ancestry cohorts (2,908 for HRV traits and 4,771 for HR). Table 1 describes the cohorts contributing data to either phase.
Table 1a.
Characteristics of Phase 1 Discovery Cohorts (Hispanic/Latino) and Phase 2 Replication Cohorts (European and African American) for GWAS of HRV phenotypes.
| Ancestry | Cohort | N | Age, yr Mean (SD) | Female % | RMSSD, ms Mean (SD) | RMSSD λGC | SDNN, ms Mean (SD) | SDNN λGC |
|---|---|---|---|---|---|---|---|---|
| Hispanic/Latino | HCHS/SOL | 10830 | 45.2 (13.6) | 59.4 | 36 (29) | 1.02 | 30 (23) | 1.02 |
| WHI | 1525 | 59.7 (6.4) | 100 | 22 (18) | 1.02 | 20 (15) | 1.01 | |
| MESA | 1412 | 61.4 (10.2) | 51.7 | 26 (23) | 0.97 | 22 (17) | 0.97 | |
|
| ||||||||
| European | WHI | 4730 | 67.4 (6.2) | 100 | 21 (21) | NA | 19 (16) | NA |
|
| ||||||||
| African | JHS | 1428 | 59.7 (11.7) | 61.6 | 31 (26) | NA | 26 (20) | NA |
| American | MESA | 1480 | 62.2 (10.1) | 54.1 | 33 (28) | NA | 27 (20) | NA |
| Table 1b. Characteristics of Phase 1 Discovery Cohorts (Hispanic/Latino) and Phase 2 Replication Cohorts for GWAS of HR. | ||||||||
|---|---|---|---|---|---|---|---|---|
| Ancestry | Cohort | N | Age, yr Mean (SD) | Female % | HR, b/min Mean (SD) | BMI, kg/m2 Mean (SD) | λGC | |
| Hispanic/ Latino | HCHS/SOL | 10245 | 44.6 (13.5) | 58.8 | 63 (9) | 29.5 (5.9) | 1.06 | |
| WHI | 1527 | 59.9 (6.4) | 100 | 66 (10) | 29.4 (5.5) | 1.02 | ||
| MESA | 1412 | 61.4(10.2) | 51.7 | 63 (10) | 29.5 (5.1) | 1.00 | ||
|
| ||||||||
| European | WHI | 7073 | 66.2 (6.6) | 100 | 67 (10) | 28.3 (5.6) | NA | |
|
| ||||||||
| African | JHS | 1424 | 59.7 (11.7) | 61.6 | 64 (10) | 32.1 (7.3) | NA | |
| American | WHI | 3347 | 60.7 (6.7) | 100 | 68 (11) | 31.5 (6.4) | NA | |
Genome-wide Association Analysis
Meta-analyses of the three Phase 1 discovery cohorts yielded λGC values20 of 1.00, 1.00, and 1.01 for RMSSD, SDNN, and HR, respectively (Supplementary Table S2). These indices and quantile-quantile plots of P-values raised no concerns for genomic inflation (Figure 1).
Figure 1.
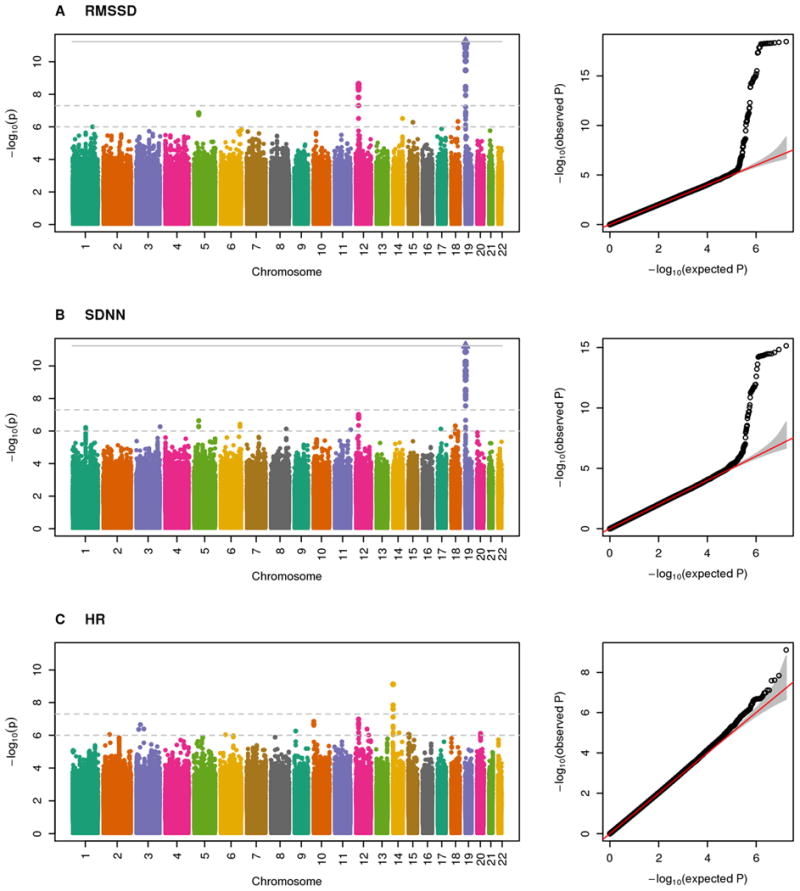
Manhattan and quantile-quantile plots for the meta-analyzed associations in Hispanics/Latinos for phenotypes (A) RMSSD, (B) SDNN, and (C) HR.
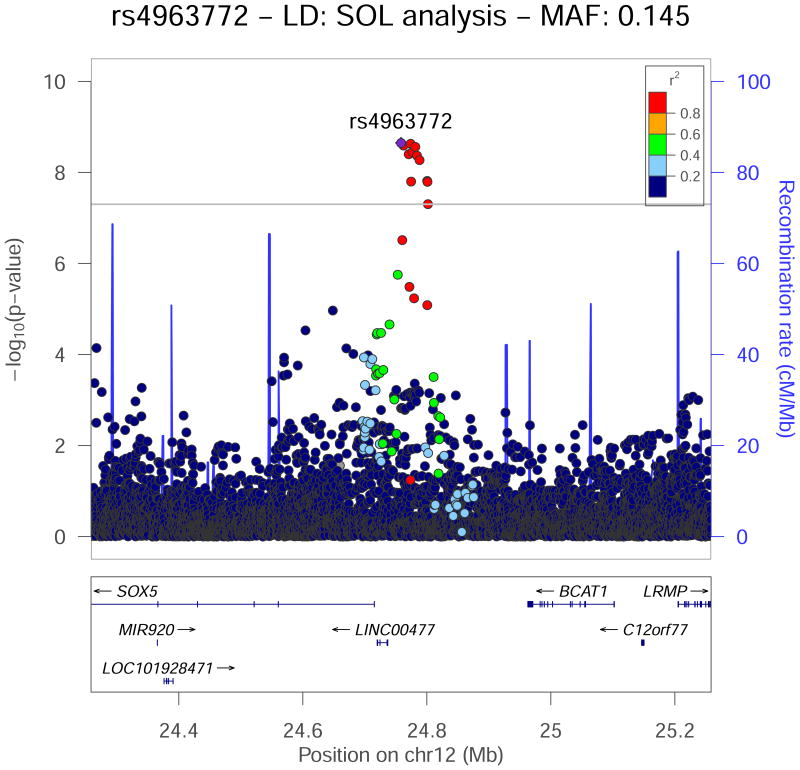
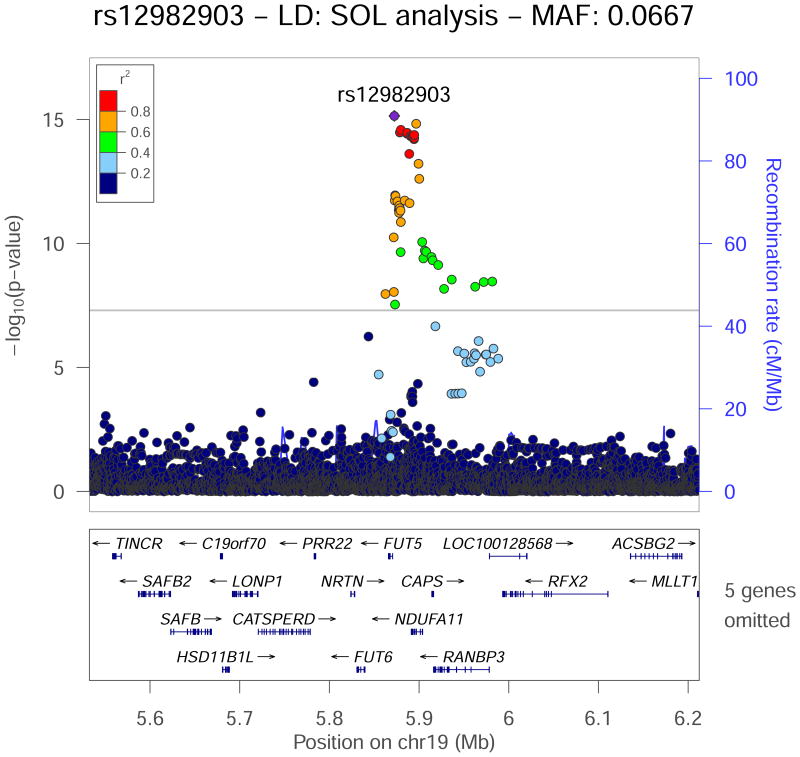
The GWAS scan of RMSSD yielded two genome-wide significant loci on chromosomes 12 and 19. The chromosome 19 locus overlapped the sole genome-wide significant locus for SDNN. The chromosome 12 locus approached genome-wide significance for SDNN (P=1.2×10⁻⁷). The HR analysis yielded one genome-wide significant locus on chromosome 14. All three traits yielded suggestive loci (Figure 1). We selected five HRV SNPs and two HR SNPs for Phase 2 (Table 2; Supplementary Table S3). We did not select the genome-wide significant SNP for HR because it overlaps a recognized HR locus.9
Table 2.
SNPs Selected for Phase 2.
| SNP | TRAIT | CHR | EFFECT ALLELE | NEAREST GENE | HA EAF | HA B | HA P-VALUE | EA EAF | EA B | EA P-VALUE | AA EAF | AA B | AA P-VALUE |
|---|---|---|---|---|---|---|---|---|---|---|---|---|---|
| RS4963772* | RMSSD | 12 | A | LINC00477 | 0.13-0.15 | 0.069 | 2×10⁻⁹ | 0.15 | 0.053 | 0.0046 | 0.03 | 0.047 | 0.2003 |
| RS12982903* | SDNN | 19 | G | FUT5 | 0.93-0.94 | 0.129 | 7×10-16 | 0.92 | 0.114 | 2×10⁻⁶ | 0.96-0.97 | -0.028 | 0.6596 |
| RS236352 | HR | 6 | G | PPIL1 | 0.67-0.68 | 0.605 | 9×10⁻⁷ | 0.66 | 0.226 | 0.0949 | 0.71-0.72 | 0.586 | 0.0067 |
| RS8009773 | RMSSD | 14 | A | C14orf177 | 0.74-0.77 | 0.048 | 3×10⁻⁷ | 0.84 | 0.012 | 0.2713 | 0.44-0.56 | 0.040 | 0.0155 |
| RS9428238 | SDNN | 1 | C | NHLH2 | 0.57-0.61 | 0.039 | 6×10⁻⁷ | 0.48 | 0.039 | 0.2434 | 0.72-0.75 | 0.009 | 0.3258 |
| RS149496015 | SDNN | 11 | C | OPCML | 0.98 | 0.193 | 8×10⁻⁷ | 0.97 | -0.053 | 0.8709 | 0.98-0.99 | -0.050 | 0.0433 |
| RS17180489 | HR | 14 | G | RGS6 | 0.90 | 1.200 | 7×10⁻⁷ | 0.87 | 0.579 | 0.0730 | 0.94-0.96 | -1.547 | 0.9524 |
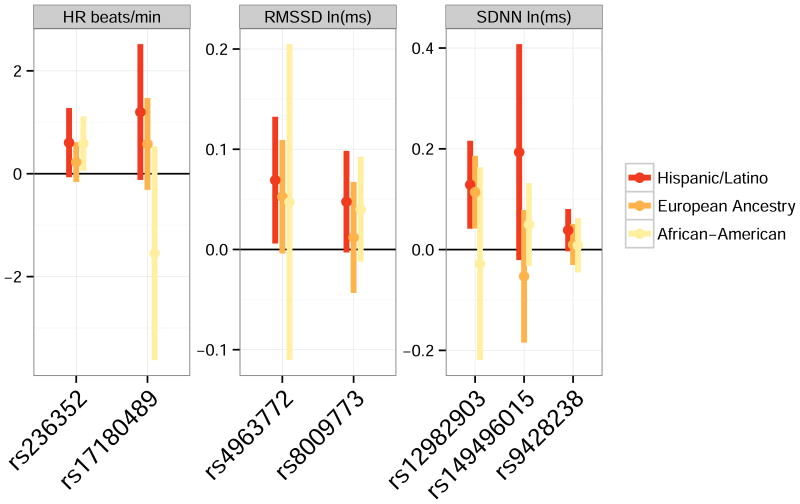
Two SNPs (*) were genome-wide significant in the Hispanic/Latino meta-analysis; all others were suggestive. The significance threshold for replication analysis is 0.005 for HRV SNPs and 0.0125 for HR SNPs; bold P-Values indicate replication. The Effect Allele is the allele associated with higher trait values in Phase 1. Figure 4 compares effect estimates across the three ancestry groups; Supplementary Table S3 includes additional SNP-level details.
Both genome-wide significant HRV loci replicated in the European ancestry sample (Table 2; replication P-value <0.005). Neither locus was statistically significant in the Phase 2 African American sample, where power was lower. None of the three suggestive HRV loci was statistically significant in Phase 2. Of these three SNPs, two had good imputation quality in Phase 2 data and one had modest imputation quality (Supplementary Table S4).
Of the two suggestive HR SNPs, rs236352 on chromosome 6 was significantly associated with HR in the African American Phase 2 sample (P-value <0.0125). The other suggestive HR SNP (rs17180489 on chromosome 14) was not significantly associated with HR in either Phase 2 cohort. Variant rs17180489 had good imputation quality in Phase 1 data, but only modest quality in Phase 2 (Supplementary Table S4).
Figures 2-4 show regional association plots for the three SNPs that replicated in Phase 2. Supplementary Figures S1-S7 are plots for all selected SNPs. Figure 5 summarizes results for the seven SNPs analyzed in both phases of the study for comparisons of effect sizes across ancestries.
Figure 2.
Regional association plot for the RMSSD genome-wide significant locus rs4963772 on chromosome 12, which replicated in the European ancestry Phase 2 cohort. −log10 P-values from the Hispanic/Latino meta-analysis are plotted on the vertical axis, and chromosome position is on the horizontal axis. Linkage disequilibrium r2 was estimated in the largest Phase 1 cohort, HCHS/SOL. Values of r2 with respect to rs4963772 are displayed using color. Nearby genes are displayed under the horizontal axis.
Figure 3.
Regional association plot for the SDNN genome-wide significant locus rs12982903 on chromosome 19, which replicated in the European ancestry Phase 2 cohort. −log10 P-values from the Hispanic/Latino meta-analysis are plotted on the vertical axis and chromosome position is on the horizontal axis. Linkage disequilibrium r2 was estimated in HCHS/SOL. Values of r2 with respect to rs12982903 are displayed using color. Nearby genes are displayed under the horizontal axis. Significant SNPs span a region with several genes.
Figure 4.
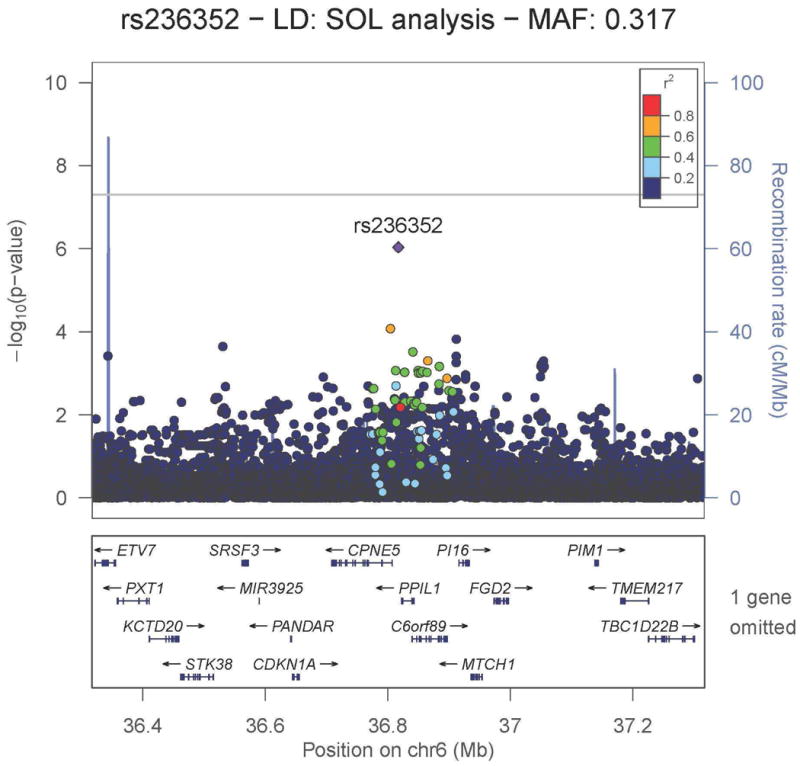
Regional association plot for the HR suggestive locus rs236352 on chromosome 6, which replicated in the African American Phase 2 cohort. −log10 P-values from the Hispanic/Latino meta-analysis are plotted on the vertical axis and chromosome 6 position is plotted on the horizontal axis. Linkage disequilibrium r2 was estimated in HCHS/SOL. Values of r2 with respect to rs236352 are displayed using color in the plot. Nearby genes are displayed under the horizontal axis.
Figure 5.
Comparison of associations (regression estimated β values) for the 7 SNPs selected for Phase 2 replication analysis. Bars represent confidence intervals using an α-level that incorporates an appropriate adjustment for multiplicity. For Hispanics/Latinos, α=5×10⁻⁸ for all confidence intervals. For European ancestry and African Americans, α=0.05/4 for HR and α=0.05/10 for SDNN and RMSSD.
The two replicated HRV SNPs explained 0.91% and 0.72% of the variability of RMSSD and SDNN, respectively, in HCHS/SOL. The chromosome 6 SNP explained 0.15% of the variability of HR; 1.17% when combined with the previously reported 21 HR SNPs.9
Following a reviewer's suggestion, we investigated associations of four candidate SNPs in genes ADBR2 and ADBR1 (Supplementary Table S5). Genome-wide summary data from this investigation are publically available21 to support future genetic investigations.
Generalization Analysis
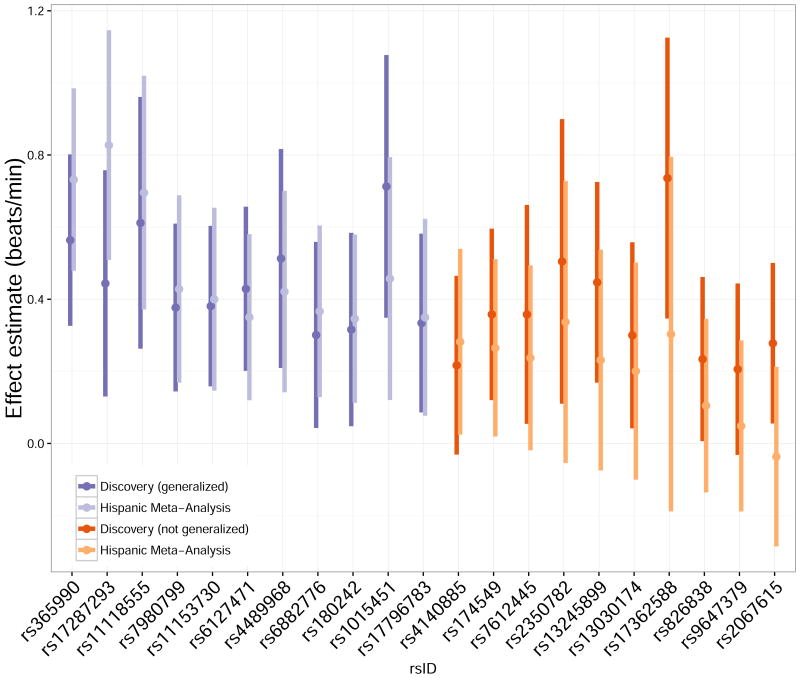
We evaluated genome-wide significant loci reported in a previous GWAS of HR in European ancestry populations (N≈181,000) for generalization to Hispanic/Latino populations. Eleven of the 21 reported HR SNPs generalized (r-value <0.05), with effects similar to those in the original report (Figure 6). Confidence bounds for 9 of the 10 remaining SNPs show that the summary results for Hispanics/Latinos are consistent with effects observed in the European ancestry study, supporting the interpretation that the association discovered in European ancestry cohorts generalizes to Hispanics/Latinos. For a single SNP, rs2067615, the direction of the effect estimate in Hispanics/Latinos was opposite to that in the European ancestry study. Generalization analysis for this SNP is inconclusive due to wide confidence bounds. There is no comparable published GWAS of HRV for similar generalization analyses.
Figure 6.
Generalization analysis of previously reported HR-associated SNPs. For each SNP, the left-hand darker bar shows a confidence interval (α=5×10⁻⁸) for the association (regression estimated β) as reported in 9. The right-hand lighter bar shows a confidence interval (α=0.05/21)) for the association in the Hispanic/Latino meta-analysis. Purple bars are for the eleven SNPs found to generalize to Hispanics/Latinos using the r-value approach; orange bars are for remaining ten SNPs. For the SNPs that generalized, there is evidence that the magnitude of association is similar in Hispanic/Latino compared to European ancestry. In addition, for SNPs that did not generalize, there is no compelling evidence of a different (or null) association in Hispanic/Latino compared to European ancestry populations. Point estimates for Hispanic/Latino associations tend to be attenuated compared to estimates for European ancestry, as expected due to the “winner's curse.”38 For rs2067615, point estimates have opposite sign but confidence intervals are wide and overlap.
Discussion
There is growing attention to the lack of diversity in GWAS,14, 22 which reduces the relevance of medical genomics globally and results in missed opportunities to leverage diversity to improve biological understanding. There are fewer extensively phenotyped epidemiological cohorts of non-Europeans; investigators must be resourceful to address the lack of diversity in GWAS. Therefore, we used three well-characterized Hispanic/Latino cohorts, with independent replication in European ancestry and African-American cohorts. We found novel associations between SNPs and heart rate or heart rate variability, despite modest sample sizes. The findings are the first of their kind in Hispanics/Latinos and provide insight into the biological mechanisms underlying SDNN, RMSSD, and HR.
At the chromosome 19 locus, the lead SDNN SNP (rs12982903) is in linkage disequilibrium with several potentially causal variants (r2 ≥ 0.8 in HCHCS/SOL), including: (1) rs12980262, (2) rs12974440, (3) rs12974991, (4) rs12975210, and (5) rs17271904 (Supplementary Figure 8). Variant rs12980262 is a missense alteration (g.5893047 G>A; c.557 C>T; p.Ala186Val) located in the last exon of NDUFA11 (NADH:ubiquinone oxidoreductase subunit A11). The altered protein is an isoform of a subunit of the membrane-bound mitochondrial complex I (NADH-ubiquinol reductase in the electron transport chain). Furthermore, ChIP-Seq data suggest that this SNP lies within a putative enhancer active in the fetal heart, right ventricle, and right atrium (home of the sinoatrial node) or pacemaker. Thus, variant rs12980262 may influence HRV through altered mitochondrial electron transport and/or gene regulation.
Non-coding SNPs (2) through (5) above lie within putative enhancers are active in various cardiac tissues and may also have regulatory roles. In particular, rs12974440, rs12974991, and rs12975210 overlap with a DNaseI hypersensitive site in several heart tissues and have been reported as eQTLs for downstream genes RANBP3 (in whole blood) and CAPS (in whole blood and brain). In this context, CAPS is a potentially interesting enhancer target because it encodes a protein (calcyphosine) that binds calcium (Ca++) and appears to be upregulated by cAMP and thyroid stimulating hormone in the thyroid.23 Although the exact function of calcyphosine remains unclear, thyroid effects on the heart are well recognized24 and the inward flow of Ca++ through T-type Ca++ channels (iCa) accelerates the autonomically controlled rate of phase 4 depolarization (and therefore discharge) of sinoatrial pacemaker cells in the right atrium.25
In addition to using epigenetic datasets in cardiac tissues, we examined data from neuronal progenitor cells. These progenitors give rise to tissues involved in the control of heart rate and its variability by the central and peripheral autonomic nervous systems. Three non-coding variants lie within putative enhancers in neuronal progenitor cells – rs17271904 (on chromosome 19; Supplementary Figure 8) and variants rs17287293 and rs11047543 in high LD with the lead RMSSD SNP (rs4963772 on chromosome 12). These variants may influence heart rate via central and/or peripheral autonomic nervous pathways. Moreover, KNOP1P1, 20kb upstream of rs4963772, has been associated with HR9, 26 and PR interval duration.27,28
The chromosome 6 HR SNP is within 200 kb of a locus that was suggestive in the large European ancestry HR GWAS (Supplemental Table 5 in 9). The gene closest to our lead SNP, PPIL1 (peptidylprolyl isomerase like 1), is proximal to a well-characterized QRS locus.29-32 Non-coding lead HR SNP rs236352 and its proxy rs236349 are likely functionally relevant in cardiac tissues (Supplementary Figure 8). Variant rs236352 lies within a predicted cardiac super-enhancer.33, 34 The putative super-enhancer overlaps a DNaseI hypersensitive site in cardiac tissues, ChIP-Seq peaks of RNA polymerase II, subunits of cohesion complexes (e.g., SMC3), and chromatin regulators (e.g., EP300), which are known to associate with super-enhancers.33, 35 Plausible right atrial gene targets of the super-enhancer that contains rs236352 are its eQTL targets, CPNE5, which encodes a Ca++-dependent, phospholipid-binding protein, and PPIL1. Both are expressed in the right atrium, although neither gene has been identified as an eQTL in cardiac tissue. Interestingly, lead SNP rs236352 is predicted to disrupt the DNA binding motif of a T-box transcription factor that regulates CPNE5 expression.36 Moreover, a short stretch of unannotated RNA overlapping the CPNE5 promoter is expressed differentially in the right (versus left) atrium, suggesting that the RNA may have a functional role in the right atrium. For example, if this unannotated RNA is an enhancer RNA associated with the super-enhancer, then it could have a regulatory role in the right atrium.37
The above mechanisms by which these replicated and epigenetically well-characterized HR and HRV loci may exert effects in the right atrium are biologically plausible. However, functional evaluation is needed to confirm the postulated underlying mechanisms. Clinical implications remain unclear. Moreover, associations for the lead SNP at the chromosome 19 and 12 loci were not statistically significant in the Phase 2 African American sample. For the RMSSD-rs4963772 association, this can be explained by the lower replication sample size, lower minor allele frequency, and therefore lower power for detecting association with this phenotype measured with error. Although the extent of measurement error is somewhat lower for RMSSD than SDNN and in studies with 30- versus 10- second ECG recordings (MESA versus HCHS/SOL and WHI), the same can reasonably be said about the SDNN-rs12982903 association, where low imputation quality may have further reduced power. Importantly, HRV and SNP measurement error should reduce statistical power but not introduce bias.
Because the European cohort in Phase 2 included only females, HRV-SNP associations were not replicated in males. However, these SNPs were genome-wide significant in Phase 1. There was no significant evidence that sex modifies the associations in the largest Phase 1 cohort, HCHS/SOL (P>0.05). However, the association signal of SNP rs4963772 (chromosome 12) was stronger in females than males in sex-stratified analyses.
Our GWAS discovered and replicated a novel HR-associated locus on chromosome 6. We are the first to detect this association, even though HR was analyzed in a European ancestry GWAS six times larger. Possible reasons include chance, gene-environment interaction, or population-specific variation.
Conclusion
HRV is an understudied phenotype, and the current finding of two genetic associations represents an advance in HRV genetics. In addition, we discovered a novel genetic association with HR, which replicated in African Americans. Functional annotation analysis revealed plausible mechanisms for these associations. This novel discovery of genetic association for a well-studied phenotype, HR, argues for the importance of efforts to expand genetic association studies to populations of diverse ancestry.
Supplementary Material
Acknowledgments
This work was supported by the National Institutes of Health contracts N01-HC65233, N01-HC65234, N01-HC65234, N01-HC65235, N01-HC65236, HHSN268201300005C AM03 and MOD03, HSN 26220/20054C, HHSN268201100046C, HHSN268201100001C, HHSN268201100002C, HHSN268201100003C, HHSN268201100004C, and HHSN271201100004C, N02HL64278, HHSN268201500003I, N01-HC-95159, N01-HC-95160, N01-HC-95161, N01-HC-95162, N01-HC-95163, N01-HC-95164, N01-HC-95165, N01-HC-95166, N01-HC-95167, N01-HC-95168, N01-HC-95169, N02-HL-6-4278, HHSN268201300046C, HHSN268201300047C, HHSN268201300048C, HHSN268201300049C, HHSN268201300050C; and grants UL1TR000124, DK063491, U01HG005152, R01ES017794, N01WH74316, U01CA137088, R01CA059045, R01HL127659, UL1-TR-000040, UL1-TR-001079, UL1-TR-001420, UL1TR000124, DK063491, HL111089, HL116747, R01HG006292 and R01HL129132, and R21HL121348. Additional funding was provided by Wyeth-Ayerst laboratories and the Laughlin Family.
Footnotes
The authors have no conflicts of interest related to this report.
Publisher's Disclaimer: This is a PDF file of an unedited manuscript that has been accepted for publication. As a service to our customers we are providing this early version of the manuscript. The manuscript will undergo copyediting, typesetting, and review of the resulting proof before it is published in its final citable form. Please note that during the production process errors may be discovered which could affect the content, and all legal disclaimers that apply to the journal pertain.
References
- 1.Wannamethee G, Shaper AG. The association between heart rate and blood pressure, blood lipids and other cardiovascular risk factors. J Cardiovasc Risk. 1994;1:223–30. doi: 10.1177/174182679400100307. [DOI] [PubMed] [Google Scholar]
- 2.Johansen CD, Olsen RH, Pedersen LR, Kumarathurai P, Mouridsen MR, Binici Z, Intzilakis T, Køber L, Sajadieh A. Resting, night-time, and 24 h heart rate as markers of cardiovascular risk in middle-aged and elderly men and women with no apparent heart disease. Eur Heart J. 2013;34:1732–9. doi: 10.1093/eurheartj/ehs449. [DOI] [PubMed] [Google Scholar]
- 3.Kannel WB, Kannel C, Paffenbarger RS, Cupples LA. Heart rate and cardiovascular mortality: the Framingham Study. Am Heart J. 1987;113:1489–94. doi: 10.1016/0002-8703(87)90666-1. [DOI] [PubMed] [Google Scholar]
- 4.Shaper AG, Wannamethee G, Macfarlane PW, Walker M. Heart rate, ischaemic heart disease, and sudden cardiac death in middle-aged British men. Br Heart J. 1993;70:49–55. doi: 10.1136/hrt.70.1.49. [DOI] [PMC free article] [PubMed] [Google Scholar]
- 5.Heart rate variability. Standards of measurement, physiological interpretation, and clinical use. Task Force of the European Society of Cardiology and the North American Society of Pacing and Electrophysiology. Eur Heart J. 1996;17:354–81. [PubMed] [Google Scholar]
- 6.Singh JP, Larson MG, O'Donnell CJ, Tsuji H, Evans JC, Levy D. Heritability of heart rate variability: the Framingham Heart Study. Circulation. 1999;99:2251–4. doi: 10.1161/01.cir.99.17.2251. [DOI] [PubMed] [Google Scholar]
- 7.Russell MW, Law I, Sholinsky P, Fabsitz RR. Heritability of ECG measurements in adult male twins. J Electrocardiol. 1998;30(Suppl):64–8. doi: 10.1016/s0022-0736(98)80034-4. [DOI] [PubMed] [Google Scholar]
- 8.Newton-Cheh C, Guo CY, Wang TJ, O'donnell CJ, Levy D, Larson MG. Genome-wide association study of electrocardiographic and heart rate variability traits: the Framingham Heart Study. BMC Med Genet. 2007;8(Suppl 1):S7. doi: 10.1186/1471-2350-8-S1-S7. [DOI] [PMC free article] [PubMed] [Google Scholar]
- 9.den Hoed M, Eijgelsheim M, Esko T, et al. Identification of heart rate-associated loci and their effects on cardiac conduction and rhythm disorders. Nature Genetics. 2013;45:621–631. doi: 10.1038/ng.2610. [DOI] [PMC free article] [PubMed] [Google Scholar]
- 10.Deo R, Nalls MA, Avery CL, et al. Common genetic variation near the connexin-43 gene is associated with resting heart rate in African Americans: a genome-wide association study of 13,372 participants. Heart Rhythm. 2013;10:401–8. doi: 10.1016/j.hrthm.2012.11.014. [DOI] [PMC free article] [PubMed] [Google Scholar]
- 11.Cho YS, Go MJ, Kim YJ, et al. A large-scale genome-wide association study of Asian populations uncovers genetic factors influencing eight quantitative traits. Nat Genet. 2009;41:527–34. doi: 10.1038/ng.357. [DOI] [PubMed] [Google Scholar]
- 12.Schroeder EB, Chambless LE, Liao D, Prineas RJ, Evans GW, Rosamond WD, Heiss G. Diabetes, glucose, insulin, and heart rate variability: the ARIC study. Diabetes Care. 2005;28:668–74. doi: 10.2337/diacare.28.3.668. [DOI] [PubMed] [Google Scholar]
- 13.Meyer ML, Gotman NM, Soliman EZ, Whitsel EA, Arens R, Cai J, Daviglus ML, Denes P, González HM, Moreiras J, Talavera GA, Heiss G. Association of glucose homeostasis measures with heart rate variability among Hispanic/Latino adults without diabetes: the Hispanic Community Health Study/Study of Latinos (HCHS/SOL) Cardiovasc Diabetol. 2016;15:45. doi: 10.1186/s12933-016-0364-y. [DOI] [PMC free article] [PubMed] [Google Scholar]
- 14.Bustamante CD, Burchard EG, DelaVega FM. Genomics for the world. Nature. 2011;475:163–5. doi: 10.1038/475163a. [DOI] [PMC free article] [PubMed] [Google Scholar]
- 15.Howie B, Marchini J, Stephens M. Genotype imputation with thousands of genomes. G3 (Bethesda) 2011;1:457–70. doi: 10.1534/g3.111.001198. [DOI] [PMC free article] [PubMed] [Google Scholar]
- 16.Pe'er I, Yelensky R, Altshuler D, Daly MJ. Estimation of the multiple testing burden for genomewide association studies of nearly all common variants. Genet Epidemiol. 2008;32:381–5. doi: 10.1002/gepi.20303. [DOI] [PubMed] [Google Scholar]
- 17.Conomos MP, Laurie CA, Stilp AM, et al. Genetic Diversity and Association Studies in US Hispanic/Latino Populations: Applications in the Hispanic Community Health Study/Study of Latinos. Am J Hum Genet. 2016;98:165–84. doi: 10.1016/j.ajhg.2015.12.001. [DOI] [PMC free article] [PubMed] [Google Scholar]
- 18.Pruim RJ, Welch RP, Sanna S, Teslovich TM, Chines PS, Gliedt TP, Boehnke M, Abecasis GR, Willer CJ. LocusZoom: regional visualization of genome-wide association scan results. Bioinformatics. 2010;26:2336–7. doi: 10.1093/bioinformatics/btq419. [DOI] [PMC free article] [PubMed] [Google Scholar]
- 19.Sofer T, Heller R, Bogomolov M, Avery CL, Graff M, North KE, Reiner AP, Thornton TA, Rice K, Benjamini Y, Laurie CC, Kerr KF. A powerful statistical framework for generalization testing in GWAS, with application to the HCHS/SOL. Genet Epidemiol. 2017 doi: 10.1002/gepi.22029. [DOI] [PMC free article] [PubMed] [Google Scholar]
- 20.Devlin B, Roeder K. Genomic control for association studies. Biometrics. 1999;55:997–1004. doi: 10.1111/j.0006-341x.1999.00997.x. [DOI] [PubMed] [Google Scholar]
- 21.Rich SS, Wang ZY, Sturcke A, Ziyabari L, Feolo M, O'Donnell CJ, Rice K, Bis JC, Psaty BM. Rapid evaluation of phenotypes, SNPs and results through the dbGaP CHARGE Summary Results site. Nat Genet. 2016;48:702–3. doi: 10.1038/ng.3582. [DOI] [PMC free article] [PubMed] [Google Scholar]
- 22.Popejoy AB, Fullerton SM. Genomics is failing on diversity. Nature. 2016;538:161–164. doi: 10.1038/538161a. [DOI] [PMC free article] [PubMed] [Google Scholar]
- 23.Shao W, Wang Q, Wang F, Jiang Y, Xu M, Xu J. Abnormal expression of calcyphosine is associated with poor prognosis and cell biology function in colorectal cancer. Onco Targets Ther. 2016;9:477–87. doi: 10.2147/OTT.S92226. [DOI] [PMC free article] [PubMed] [Google Scholar]
- 24.Polikar R, Burger AG, Scherrer U, Nicod P. The thyroid and the heart. Circulation. 1993;87:1435–41. doi: 10.1161/01.cir.87.5.1435. [DOI] [PubMed] [Google Scholar]
- 25.Choudhury M, Boyett MR, Morris GM. Biology of the Sinus Node and its Disease. Arrhythm Electrophysiol Rev. 2015;4:28–34. doi: 10.15420/aer.2015.4.1.28. [DOI] [PMC free article] [PubMed] [Google Scholar]
- 26.Eijgelsheim M, Newton-Cheh C, Sotoodehnia N, et al. Genome-wide association analysis identifies multiple loci related to resting heart rate. Hum Mol Genet. 2010;19:3885–94. doi: 10.1093/hmg/ddq303. [DOI] [PMC free article] [PubMed] [Google Scholar]
- 27.Pfeufer A, van Noord C, Marciante KD, et al. Genome-wide association study of PR interval. Nat Genet. 2010;42:153–9. doi: 10.1038/ng.517. [DOI] [PMC free article] [PubMed] [Google Scholar]
- 28.Welter D, MacArthur J, Morales J, Burdett T, Hall P, Junkins H, Klemm A, Flicek P, Manolio T, Hindorff L, Parkinson H. The NHGRI GWAS Catalog, a curated resource of SNP-trait associations. Nucleic Acids Res. 2014;42:D1001–6. doi: 10.1093/nar/gkt1229. [DOI] [PMC free article] [PubMed] [Google Scholar]
- 29.Hong KW, Lim JE, Kim JW, Tabara Y, Ueshima H, Miki T, Matsuda F, Cho YS, Kim Y, Oh B. Identification of three novel genetic variations associated with electrocardiographic traits (QRS duration and PR interval) in East Asians. Hum Mol Genet. 2014;23:6659–67. doi: 10.1093/hmg/ddu374. [DOI] [PubMed] [Google Scholar]
- 30.Ritchie MD, Denny JC, Zuvich RL, et al. Genome- and phenome-wide analyses of cardiac conduction identifies markers of arrhythmia risk. Circulation. 2013;127:1377–85. doi: 10.1161/CIRCULATIONAHA.112.000604. [DOI] [PMC free article] [PubMed] [Google Scholar]
- 31.Sotoodehnia N, Isaacs A, de Bakker PI, et al. Common variants in 22 loci are associated with QRS duration and cardiac ventricular conduction. Nat Genet. 2010;42:1068–76. doi: 10.1038/ng.716. [DOI] [PMC free article] [PubMed] [Google Scholar]
- 32.Holm H, Gudbjartsson DF, Arnar DO, Thorleifsson G, Thorgeirsson G, Stefansdottir H, Gudjonsson SA, Jonasdottir A, Mathiesen EB, Njølstad I, Nyrnes A, Wilsgaard T, Hald EM, Hveem K, Stoltenberg C, Løchen ML, Kong A, Thorsteinsdottir U, Stefansson K. Several common variants modulate heart rate, PR interval and QRS duration. Nat Genet. 2010;42:117–22. doi: 10.1038/ng.511. [DOI] [PubMed] [Google Scholar]
- 33.Hnisz D, Abraham BJ, Lee TI, Lau A, Saint-Andre V, Sigova AA, Hoke HA, Young RA. Super-enhancers in the control of cell identity and disease. Cell. 2013;155:934–47. doi: 10.1016/j.cell.2013.09.053. [DOI] [PMC free article] [PubMed] [Google Scholar]
- 34.Khan A, Zhang X. dbSUPER: a database of super-enhancers in mouse and human genome. Nucleic Acids Res. 2016;44:D164–71. doi: 10.1093/nar/gkv1002. [DOI] [PMC free article] [PubMed] [Google Scholar]
- 35.Kagey MH, Newman JJ, Bilodeau S, et al. Mediator and cohesin connect gene expression and chromatin architecture. Nature. 2010;467:430–5. doi: 10.1038/nature09380. [DOI] [PMC free article] [PubMed] [Google Scholar]
- 36.Mori AD, Zhu Y, Vahora I, Nieman B, Koshiba-Takeuchi K, Davidson L, Pizard A, Seidman JG, Seidman CE, Chen XJ, Henkelman RM, Bruneau BG. Tbx5-dependent rheostatic control of cardiac gene expression and morphogenesis. Dev Biol. 2006;297:566–86. doi: 10.1016/j.ydbio.2006.05.023. [DOI] [PubMed] [Google Scholar]
- 37.Hsu J, Hanna P, Van Wagoner DR, Barnard J, Serre D, Chung MK, Smith JD. Whole genome expression differences in human left and right atria ascertained by RNA sequencing. Circ Cardiovasc Genet. 2012;5:327–35. doi: 10.1161/CIRCGENETICS.111.961631. [DOI] [PMC free article] [PubMed] [Google Scholar]
- 38.Xiao R, Boehnke M. Quantifying and correcting for the winner's curse in genetic association studies. Genet Epidemiol. 2009;33:453–62. doi: 10.1002/gepi.20398. [DOI] [PMC free article] [PubMed] [Google Scholar]
Associated Data
This section collects any data citations, data availability statements, or supplementary materials included in this article.


