

Abstract
We describe the development of the first digital atlas of the normal squirrel monkey brain and present the resulting product, VALiDATe29. The VALiDATe29 atlas is based on multiple types of magnetic resonance imaging (MRI) contrast acquired on 29 squirrel monkeys, and is created using unbiased, nonlinear registration techniques, resulting in a population-averaged stereotaxic coordinate system. The atlas consists of multiple anatomical templates (proton density, T1, and T2* weighted), diffusion MRI templates (fractional anisotropy and mean diffusivity), and ex vivo templates (fractional anisotropy and a structural MRI). In addition, the templates are combined with histologically defined cortical labels, and diffusion tractography defined white matter labels. The combination of intensity templates and image segmentations make this atlas suitable for the fundamental atlas applications of spatial normalization and label propagation. Together, this atlas facilitates 3D anatomical localization and region of interest delineation, and enables comparisons of experimental data across different subjects or across different experimental conditions. This article describes the atlas creation and its contents, and demonstrates the use of the VALiDATe29 atlas in typical applications. The atlas is freely available to the scientific community.
Keywords: Brain, Atlas, Squirrel monkey, Magnetic Resonance Imaging, Template, Diffusion MRI, Segmentation
1. Introduction
The creation and application of image-based brain atlases is widespread in neuroanatomy and neuroscience research. Atlases are used as reference spaces to describe brain anatomy, and are frequently composed of two types of images: intensity images (or “templates”), and segmented images (or “labels”) (Cabezas et al. 2011). The template images establish a standard coordinate system which provides a common framework for reporting findings from neuroimaging experiments (Toga 1999). In a process called spatial normalization, new images are aligned with the templates and comparisons of brains can be made across subjects, time, or differing experimental conditions. In addition, the labelled images can be propagated from the atlas to the new data to identify regions of interest in a process called label propagation (Cabezas et al. 2011; Gee et al. 1993).
Atlases come in many forms. A single individual may be used as a template, such as the well-known Talairach atlas (Talairach 1967; Talairach and Tournoux 1988) of the human brain. Other human brain atlases attempt to capture anatomic variability across individuals by generating an average template from a population of subjects (Evans et al. 1992; Mazziotta et al. 1995). Additionally, multidimensional templates have been created from multiple imaging modalities (i.e. CT/MR (Tiede et al. 1993) and histology/MR (Eickhoff et al. 2005)), or from different contrasts from the same modality (i.e. MRI) (Mori et al. 2008; Rohlfing et al. 2008). Finally, a variety of atlases for different species have been developed, including the mouse (Kovacevic et al. 2005; Paxinos and Franklin 2004), rat (Schwarz et al. 2006; Wisner et al. 2016; Paxinos and Watson 2014), and fruit fly (Jenett et al. 2006), among others.
Of particular interest to the neuroimaging community are atlases based on nonhuman primates. Observations from nonhuman primate studies are often used as the “gold standard” from which many in vivo experiments on humans can be designed and validated. Because of this, a number of MRI-based nonhuman primate brain atlases have been created, including the common marmoset (Hikishima et al. 2011; Newman et al. 2009), the baboon (Greer et al. 2002), the vervet monkey (Woods et al. 2011), and the macaque (Rohlfing et al. 2012; Frey et al. 2011; Calabrese et al. 2015). Another commonly used primate model is the squirrel monkey, a New World monkey with a functional and microstructural organization of the central nervous system similar to that of humans (Nudo et al. 1995; Heffner and Masterton 1983), making this species particularly valuable for biomedical research (Abee 1989; Wang et al. 2013; Chen et al. 2003; Shi et al. 2016; Wilson et al. 2016; Kaas et al. 1984; Stepniewska et al. 2014; Kaas et al. 2012). However, no digital atlases exist which describe the organization of the squirrel monkey brain. Multiple paper atlases exist for this species (Akert 1963; Carpenter 1963; MacLean 1962), however, the two-dimensional nature of these paper atlases make it difficult to pool data across animals because they cannot take advantage of modern image registration techniques. Also, they do not offer MRI or connectivity-specific contrasts. For these reasons, most modern atlases are in digital format. A digital atlas of the squirrel monkey brain would be a powerful research tool with a range of clinical and research applications, and would be of interest to researchers who need to quantify and/or locate anatomical or functional differences in a single animal’s brain or across a population of animals.
In this work, we present a squirrel monkey brain atlas based on multiple MRI contrasts acquired on 29 specimens. Image templates are created using unbiased, nonlinear registration techniques and are presented in an unbiased population-averaged coordinate system. Thus, the atlas does not rely on the anatomy of a single subject, but rather is representative of numerous squirrel monkey brains, which should facilitate spatial normalization by minimizing the deformations required when matching new images to the templates. The atlas, named VALiDATe29 (VAnderbiLt Digital ATlas of the squirrel monkey brain), contains multiple co-registered MRI channels including proton density, T1, and T2*-weighted images, DTI derived contrasts, and ex vivo scans, making it broadly applicable to a variety of structural, functional, and validation studies. Finally, the templates are combined with histologically defined cortical labels, and diffusion-tractography defined white matter labels, making it a powerful tool for both spatial normalization and label propagation. Individual and preliminary aspects of this work have been described in (Gao et al. 2014; Gao et al. 2016), and the current VALiDATe29 atlas is being made available to the scientific community.
This paper is organized as follows. Section 2 describes the construction of the atlas, including image acquisition as well as an overview of the multiple channels and contrasts. Section 3 presents the results of atlas construction, including intensity templates and both white matter and cortical labels contained within the VALiDATe29 atlas. In addition, we describe distribution of the atlas and a summary of the files contained within. In Section 4, we demonstrate the use of the VALiDATe29 atlas for two typical applications. The first is propagation of the labels to individual animals to be used as seed regions – a process typical in studies of structural connectivity using diffusion tractography. Second, we demonstrate spatial normalization by calculating fractional anisotropy from individual monkeys and mapping these into atlas space, enabling comparisons across the population.
2. Materials and methods
2.1 Animals
The subjects used to construct this atlas were 29 young adult to adult-aged squirrel monkeys of two species, Saimiri Sciureus (N=21), and Saimiri Boliviensis (N=8). The use of both species in the creation of the atlas is considered appropriate, as there are no differences in the brains of these species described in the literature. In fact, until 1984, all South American squirrel monkeys were generally considered to be a single species. The animals (27 males, 2 females) ranged in age from 2.6 to 15.6 years (mean = 6.0, std = 3.9), and ranged in weight from 674 to 1250 g (mean = 911, std = 165). All animal procedures for this study were approved by the Vanderbilt University Animal Care and Use Committee, and followed guidelines of the National Institutes of Health for the care and use of laboratory animals.
2.2 MRI imaging
Not all animals underwent the same scanning procedures as they were scanned for different purposes in different projects (22 animals through NIH award numbers R01-NS078680: Biophysical Basis of Functional Connectivity by MRI and R01 NS069909: Representation of Nociception in SII and Thalamus of Primates; and 7 through NIH award number R01-NS058639: Biological Basis of Diffusion MRI of the brain).
2.2.1 In Vivo imaging
All in vivo imaging procedures were performed on a Varian 9.4 T, 21 cm horizontal bore imaging system, using a quadrature birdcage volume coil (inner diameter = 85mm). Monkeys were initially sedated with ketamine hydrochloride (20mg/kg) and atropine sulfate (0.08 mg/kg) and then anesthetized with isoflurane (0.7–1.2%) delivered in a 70:30 O2/N2O mixture. During MRI data acquisition, each monkey was maintained under stable anesthesia (isoflurane 0.5%-1.0%) and mechanically ventilated (40 respiration cycles/min), with head and body stabilized in an MR compatible frame. Vital signs including heart rate (Nonin), core body temperature (SA Instruments), respiration pattern and EKG (SA Instruments), end tidal CO2, and SpO2 (SurgiVet) were monitored and maintained at normal levels throughout the imaging session. Five in vivo imaging contrasts were included in this atlas:
Proton density-weighted contrast
Images were acquired using a 3D gradient echo (GE3D) sequence (TR = 5 ms, TE = 2.02 ms, flip angle = 15 degrees, matrix size 128 ×128 ×128, isotropic resolution of 0.5 × 0.5 ×0.5 mm3) resulting in proton density/T1-weighted contrast. This protocol was performed on 18 animals.
T1-weighted contrast
Images were acquired using a fast inversion recovery gradient echo sequence. Data were acquired with different voxel sizes (ranging from 1 × 1 × 1 mm3 to 0.5 × 0.5 × 1 mm3) because the sequence was optimized over time, with the final sequence resulting in 0.5 × 0.5 × 1 mm3 voxels (TR/TE = 3000/2.8 ms, echo train length ETL= 4, inversion recovery time TI = 600 ms, flip angle = 80 degrees, slice-thickness = 1.00 mm, inter-slice gap = 0 mm, number of slices = 28, matrix size 128 ×128). T1-weighted images from 12 monkeys were used in the creation of the atlas.
T2*-weighted contrast
Images were collected using a gradient echo multislice sequence (TR = 500 ms, TE = 20 ms, NEX = 2, flip angle = 35 degrees, matrix size = 512 × 512, slice-thickness = 1.00 mm, inter-slice gap = 0 mm, number of slices = 28, 0.125 × 0.125 × 1.0 mm3 resolution). A total of 22 monkeys were scanned with this sequence.
Diffusion contrasts
Diffusion weighted images (DWIs) were acquired with a spin-echo, echo planar imaging (SE-EPI) sequence. As for the T1-weighted contrast, data were acquired with different voxel sizes and numbers of diffusion weighting directions because the sequence was optimized over time. The final diffusion protocol was to collect data at 0.9mm isotropic resolution (TR = 6s, TE = 29ms, NSHOTS = 1, NEX = 10). The b-value was set to 2,500 s/mm2, with 86 uniformly space directions (Caruyer et al. 2013). The diffusion tensor was estimated using weighted linear least squares (WLLS), from which fractional anisotropy (FA) and mean diffusivity (MD) maps were derived. The large number of DWI’s and high b-value (compared to the commonly used b=1,000 s/mm2) allows the use of higher order, high angular resolution diffusion imaging (HARDI) models to be used in future versions of the atlas. In vivo diffusion imaging was performed on 7 squirrel monkeys.
2.2.2. Ex vivo Imaging
Ex vivo experiments were performed on six squirrel monkeys. The brains were perfusion fixed with 4% paraformaldehyde preceded by rinse with physiological saline. Brains were then removed and immersed for 3 weeks in phosphate-buffered saline (PBS) medium with 1mM Gd-DTPA in order to reduce longitudinal relaxation times (D’Arceuil et al. 2007). The brains were then placed in liquid Fomblin (California Vacuum Technology) and scanned on the same Varian 9.4 T magnet. Ex vivo imaging has several experimental advantages including longer scanning times and absence of motion. Together, this allows acquisition of data with higher signal-to-noise ratios and at a higher resolution compared to in vivo studies. We chose to include ex vivo templates because of their significantly increased contrast, and the additional value of the use of ex vivo and subsequent histology as a means to validate MRI techniques and aid image interpretation (Azadbakht et al. 2015; Bastiani et al. 2016; Calabrese et al. 2015; Choe et al. 2012; Knosche et al. 2015; Leergaard et al. 2010; McNab et al. 2009; Schilling et al. 2016).
Structural imaging
3D gradient echo sequence (GE3D) (TR = 50ms; TE = 3ms; flip angle = 45°) at 200um isotropic resolution. Sequence parameters were similar to a conventional “T1-contrast” type sequence (short TR, short TE), but we choose to designate this contrast as generically “structural” due to very different relaxation rates ex vivo (decreased T2, decreased T1, and similar T1 for both white and gray matter from the use of Gd), and potential confusion that may arise when comparing to conventional in vivo contrasts. All 6 monkeys’ structural scans were used in the creation of the atlas.
Diffusion imaging
Diffusion data were acquired with a 3D spin-echo diffusion weighted EPI sequence (TR = 410ms; TE = 41ms; NSHOTS = 4; NEX = 1; Partial Fourier k-space coverage = 0.75) at 300um isotropic resolution. Diffusion gradient duration and separation were 8ms and 22ms, respectively, and the b-value was set to 6,000 s/mm2. A larger diffusion weighting was chosen due to the decreased diffusivity of ex vivo tissue, which is approximately a third of that in vivo (Dyrby et al. 2011). A total of 101 diffusion weighted images with uniformly spaced directions (Caruyer et al. 2013) were acquired, with four additional image volumes collected at b= 0. FA maps were calculated using WLLS. One monkey’s ex vivo diffusion MRI was found to be corrupted, and not used in this study. Thus, 5 ex vivo FA maps were used in the atlas.
2.2.3 Cortical Labels
The VALiDATe29 atlas contains a total of 81 labels, comprised of 18 gray matter parcels and 57 white matter tracks (6 additional labels are ventricles). The cortical labels were histologically-defined for three squirrel monkey brains based on cytoarchitectural features revealed in Nissl stained sections. Detailed procedures summarizing these label maps are described in (Gao et al. 2014; Schilling et al. 2017; Sun et al. 2015), and briefly described here.
Following ex vivo scanning, the entire brain was cut serially on a freezing microtome in the coronal plane at 50 um thickness. The surface of the frozen tissue block was photographed using a Canon digital camera prior to cutting every third section (i.e., at 150um intervals). After sectioning, every 6th tissue section was mounted on a slide and stained for Nissl substance (with cresyl violet). Photomicrographs of the Nissl stained slides were obtained on a Leica SCN400 Brightfield Slide scanner at 20× magnification. Eighteen cortical regions of interest (ROIs) in the frontal and parietal lobes were manually labeled by an experienced neuroanatomist on the digitized Nissl-stained slides (labelling was performed using ITK-SNAP, Version 2.4.0). The labels in micrograph space were transformed to the frozen blockface space, and subsequently to the native ex vivo high resolution diffusion weighted space by a multi-step registration procedure described in (Choe et al. 2011), a process shown to result in registration errors of approximately one MRI voxel (300um in that study). Thus, for each of 3 monkeys, 18 cortical labels exist in ex vivo diffusion space.
2.2.4 WM labels
The white matter labels were developed based on three monkeys’ ex vivo diffusion weighted images using diffusion fiber tractography. Detailed procedures are described in (Gao et al. 2016).
Because of the structural similarities between the macaque and squirrel monkey brain, results of histological tracer injections of the macaque brain (as described in (Schmahmann and Pandya 2009)) were used as a reference to seed fiber tracking and for refining tracts. Tensor estimation, seed region selection, deterministic fiber tractography, and fiber tract trimming were performed in DSIStudio (Yeh et al. 2013). Tracking parameters (including FA threshold, step size, angular threshold) were manually tuned according to the characteristics of each WM bundle. The 3D fiber tracts were stored as fiber density maps, and thresholded, yielding a binary mask for each WM pathway. The masks were quality checked by a neuroanatomist with expertise in nonhuman primate brain structure, assessing the coarse shape and orientation of each tract, the gray matter structures next to each bundle, and the cortical regions connected by the pathways. This procedure resulted in 57 WM labels for each monkey, existing in ex vivo diffusion space.
2.3 Image preprocessing
For all contrasts, a series of image preprocessing steps was performed before template creation. First, intensity bias was corrected by applying the N3 nonparametric nonuniform intensity normalization method (Sled et al. 1998). Next, brain masks were bias corrected using FSL’s Brain Extraction Tool, BET (Smith 2002). However, the automatic BET brain extraction was developed for human MRI use, and often led to inaccurate skull stripping in the squirrel monkey brain (particularly near the eyeballs and frontal lobe). To improve brain mask quality, all masks were visually inspected, and manually corrected (using ITK-SNAP, version 2.4.0) as necessary.
For diffusion based contrasts, all volumes in a scan session were concatenated and corrected for movement, susceptibility induced distortions, and eddy currents using FSL’s topup and eddy algorithms (Andersson et al. 2003). The gradient table was rotated based on the transformations obtained from the corrections. Finally, the diffusion tensors were calculated using WLLS, from which FA and MD maps were generated.
2.4 Template creation
Creation of the brain templates used the same iterative, rigid and nonrigid registration approaches used to create the human MNI ICBM 152 nonlinear 6th generation brain atlas (Grabner et al. 2006), MNI pediatric atlases (Fonov et al. 2011), and the MNI macaque atlases (Frey et al. 2011). We have chosen to define the initial atlas space using the proton density contrasts, as this sequence was the most consistent across animals, had the highest isotropic resolution, and was performed on a large number of monkeys.
One monkey was chosen to serve as the initial target. Registration of the remaining monkeys (17, in this case) to the initial target was performed using a 7-parameter transformation (3 rotations, 3 translations, 1 scale) initialized by manually identified landmarks in each brain. All images were then resampled and averaged in this space to form the initial average. To provide an anatomically relevant coordinate system, the initial average was realigned so that (1) the midsagittal plane was aligned with the mid-plane of the image grid (x=0 plane), (2) the center of the anterior commissure (AC) and posterior commissure (PC) were brought into the same oblique-axial plane and (3) rotated so that the PC is directly posterior from the AC. The NIFTI image file coordinate system was then adjusted so that the AC landmark became the origin (0,0,0) of the image coordinate system. Finally, the initial target was resampled to a 0.3 mm isotropic grid.
Next, a 9-parameter transformation (3 translations, 3 rotations, 3 scales) was estimated to map each monkey to the initial template. Each MRI volume was resampled and averaged to create the next iteration of the target. This process was repeated again, this time estimating a 12-parameter transformation (3 translations, 3 rotations, 3 scales, 3 skews) to form the final rigid-registration target. Next, nonlinear registration based on the ANIMAL algorithm (Collins et al. 1995) was used to further refine the target. The ANIMAL algorithm follows a hierarchical approach to registration, where the initial linear fit is performed followed by increasingly higher resolution nonlinear fits (Collins et al. 1995; Toga 1999). Our nonlinear registration begins by estimating the deformation field, defined on a grid with 3 mm spacing, that best aligns each MRI volume to the target. All images are then resampled using the resulting deformation field, and averaged to form the next target iteration. To remove any potential bias from the previous target, all deformation fields were averaged together, and the inverse of this average deformation was applied to the current target. This spatially unbiased, averaged volume is then used as the target for the next registration step. This process is repeated twice, using grid spacing of 2mm, followed by 1mm, to form the final PD-weighted template.
Next, the other contrasts were registered to the final PD-weighted template. Of the 12 monkeys with T1-weighted images, 10 had been scanned with the GE3D sequence, and were included in the PD-template. For these monkeys, we begin with intra-subject registration by computing the optimal 6 parameter registration that mapped each T1 contrast to the corresponding PD contrast. The transforms were concatenated with the previous deformations derived in the PD-template creation. These 10 volumes were averaged in atlas space and served as the target for the final two T1-weighted volumes, which were registered using the ANIMAL algorithm, with grid spacing’s of 3, 2, and 1mm. This resulted in an intensity-averaged T1-template in atlas space. A similar procedure was applied to the T2* contrast, where for 13 monkeys we took advantage of intra-subject registration to transform to atlas space, while an additional 9 monkeys were separately registered using the ANIMAL algorithm. Averaging the transformed data from the 22 monkeys resulted in the T2* template.
For both in vivo (N=7) and ex vivo (N=5) DWI’s, registration to atlas space was performed using the non-diffusion weighted (b0) volume, which has T2 contrast. Again, an initial fit (this time to the T2* template), followed by progressively higher resolution nonlinear fits results in the transformation that best aligns the data with the atlas. These transformations were then applied to the DTI-derived FA and MD images, which were averaged together to create the in vivo FA template, the in vivo MD template, and the ex vivo FA template. Finally, the same procedure was applied to the ex vivo structural image of 6 monkeys to create the ex vivo structural template.
2.5 Atlas labeling
For three monkeys, WM and GM labels already existed in high resolution ex vivo diffusion space (Choe et al. 2012). Thus, these labels were concatenated into a single image for each monkey. The transformations derived above for the ex vivo b0 volumes were applied to label maps in order to propagate labels into atlas space. Next, majority voting was used to determine the final labels in atlas space (i.e. >=2/3 labels). Each pixel was assigned a single label, resulting in a total of 81 mutually exclusive labels covering both the left and right hemispheres.
3. Results
3.1 Image files and coordinate system
All atlas data are stored in NIfTI (http://nifti.nimh.nih.gov/nifti-1) data format with a grid size of 212*212*212 at 0.3mm isotropic resolution. A stereotaxic coordinate system is aligned with the image grid (Figure 1) so that the zero origin of the space coincides with the AC landmark in the midsagittal plane (x=0, y=0, z=0), the midsagittal plane is aligned with the middle plane of the image grid (x=0), and the AC-PC line defines the y-axis (x=0, z=0). Images are stored in “RAS” orientation, where x-coordinates increase from left to right direction, y-coordinates increase from posterior to anterior direction, and z-coordinates from inferior to superior. This coordinate system is not the same as an existing 2D histological atlas, which is based on the bony landmarks in the skull, but rather it is similar to the common Talairach space as well as other common NHP atlases (Paxinos, Frey, etc.).
Figure 1.
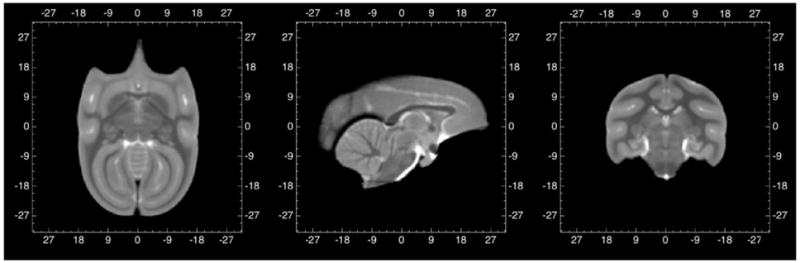
Coordinate system of VALiDATe29 squirrel monkey brain. All coordinates are in mm.
The VALiDATe29 squirrel monkey atlas is made available at (http://www.nitrc.org/projects/validate29). The following files are included in the distributions:
VALiDATe18-pd.nii.gz: PD-weighted template
VALiDATe12-t1.nii.gz: T1-weighted template
VALiDATe22-t2.nii.gz: T2*-weighted template
VALiDATe7-invivo-fa.nii.gz: fractional anisotropy template
VALiDATe7-invivo-md.nii.gz: mean diffusivity template
VALiDATe6-exvivo-structural.nii.gz: ex vivo structural template
VALiDATe5-exvivo-fa.nii.gz: ex vivo fractional anisotropy template
VALiDATe-brainmask.nii.gz: brain mask
VALiDATe3-labels.nii.gz: WM and GM label maps
VALiDATe-labels.txt: list of all label values and region names
3.2 Atlas channels
The structural channels for the VALiDATe29 squirrel monkey atlas are shown in Figure 2 for a range of axial slices. These include three in vivo structural templates (PD-weighted, T2*-weighted, and T1-weighted contrasts), two in vivo diffusion contrasts (mean diffusivity and fractional anisotropy), two ex vivo contrasts (fractional anisotropy and a structural contrast), and a set of 81 mutually exclusive labels. Select labels for both WM and GM regions of interest are shown as three-dimensional volume renderings in Figure 3.
Figure 2.
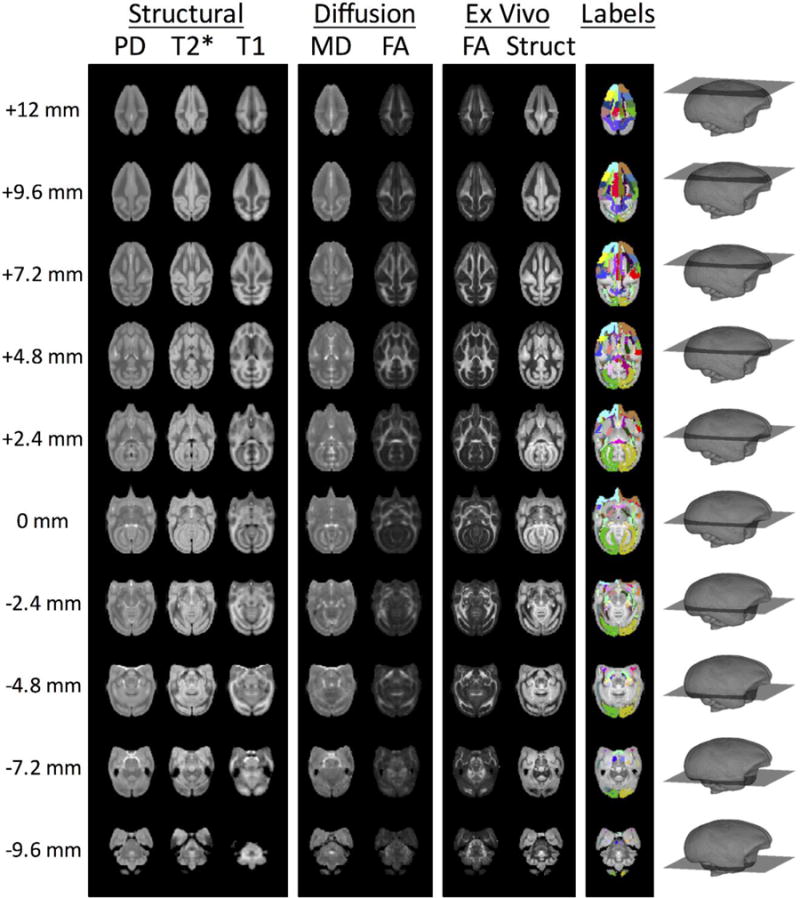
Representative slices of the existing atlas channels from VALiDATe29 squirrel monkey brain atlas. The slice z-coordinate is provided in the left-most column and graphically displayed in the right-most column.
Figure 3.
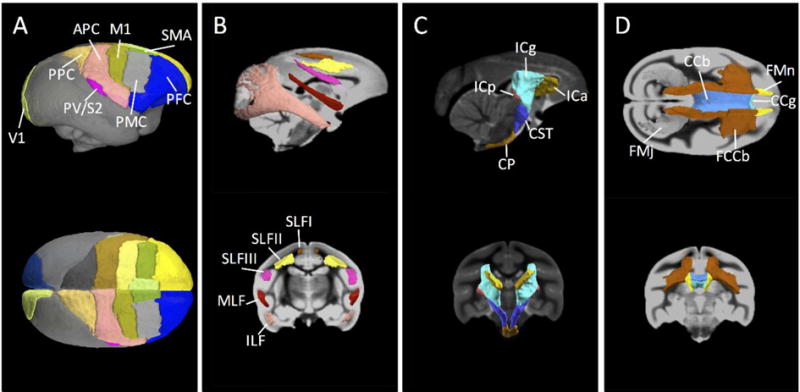
Surface renderings of selected VALiDATe29 labels. (A) Sagittal and axial views of cortical labels (note: gray rendering where no current cortical label exists). (B) Sagittal and coronal views of white matter parcels superior longitudinal fasciculus I (SLFI), SLFII, SLFIII, middle longitudinal fasciculus (MLF), and inferior longitudinal fasciculus (ILF) (both left and right are shown as same colors). (C) Sagittal and coronal views of anterior limb of the internal capsule (ICa), genu of the IC (ICg), posterior limb of the IC (ICp), cerebellar peduncle (CP), and corticospinal tract (CST). (D) Axial and coronal views of genu of the corpus callosum (CCg), body of the CC (CCb), splenium of the CC (CCs) (not visible in rendering), fiber extension of CCb (FCCb), forceps minor (FMn), and forceps major (FMj). White matter structures in the left and right hemispheres are rendered the same color for clarity.
3.3 Brain Variability
To assess geometric variability in the squirrel monkey brain, the nonlinear deformation fields that align each brain to the atlas were averaged together to create a map of the average displacement. This mean displacement map, shown in Figure 4, describes the average distance that locations in the individual brains had to be warped in order to match corresponding locations in the template space. The structures in the center of the brain display the least anatomical variability, with most deformation is on the order of 1–2 voxels (less than 0.6 mm). Regions of high anatomical variability (larger displacement) include the inferior (orbital) frontal cortex, the occipital cortex, cerebellum, and areas of the mid-brain. Thus, while linear registration provides modest alignment to the atlas in most areas of the brain (within 1–2 voxels), nonlinear registration is needed to ensure accuracy of both label propagation and spatial normalization in these regions of high variability.
Figure 4.
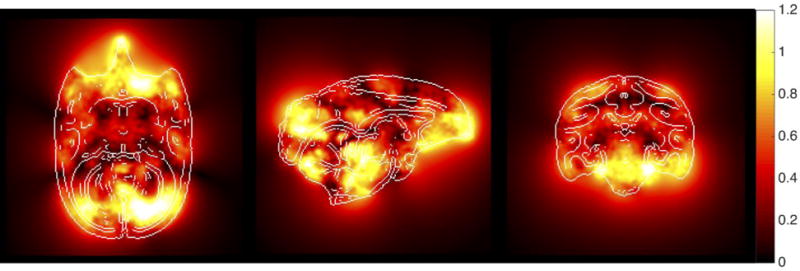
Mean displacement map. The deformation fields that nonlinearly align each subject to the atlas template were averaged to create the mean displacement map. This map displays the average distance (in mm) that each voxel from all brains was displaced in order to align with the corresponding location in the atlas, and represents inter-subject anatomical variability. The locations are the same slices as shown in Figure 1, with edges highlighted to facilitate visualization.
It is well known that fixation and brain removal from the skull can cause geometric changes in ex vivo specimens, specifically tissue shrinkage (Dyrby et al. 2011; Shepherd et al. 2009; Wehrl et al. 2015). An analysis of the affine transformation scaling factors of the ex vivo samples showed that the ex vivo linear dimensions were increased by an average of 8.6% (R/L), 7.5% (A/P), and 5.0% (S/I) in order to match the brain size of the atlas.
4 Applications
Here, we demonstrate the use the VALiDATe29 atlas for two typical atlas applications: label propagation and spatial normalization.
4.1 Label Propagation
The use of digital atlases to automatically segment or label regions of interest in individual images is prevalent in a number of medical imaging applications. The VALiDATe29 atlas contains specific tissue labels defined in atlas space that can serve as a priori anatomical information and greatly simplify automatic segmentation. If a transformation is computed from an individual animal’s image to an atlas template image, the digital labels can then be mapped back into the animal’s scans, directly labelling the anatomy. Here, we perform label propagation for the purpose of defining “seed regions” for subsequent diffusion tractography. Label propagation is demonstrated on four monkeys (monkeys not used when defining the atlas labels) that had undergone diffusion weighting imaging, and fiber tracking results for three major white matter bundles (the genu, body, and splenium of the corpus callosum) are shown in Figure 5.
Figure 5.
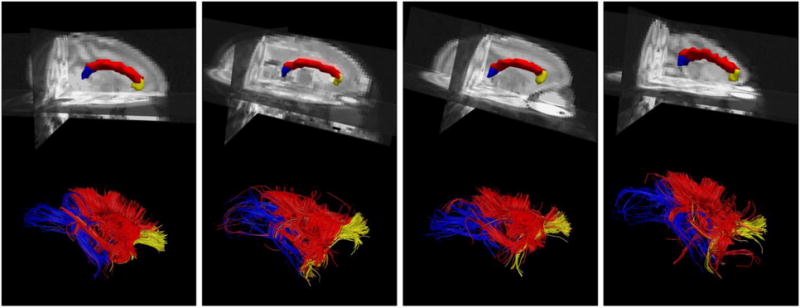
Example of label propagation for defining seed regions for fiber tracking. Parcellation results for the genu of the corpus callosum (yellow), body of the corpus callosum (red), and splenium of the corpus callosum (blue) are shown in four monkeys (top). 3D rendering of fiber tracts in each subject’s diffusion space, colored according to corpus callosum parcellation (bottom). Fiber tracking was performed with Diffusion Toolkit using the diffusion tensor model and default tracking parameters, and results were visualized using TrackVis.
4.2 Spatial Normalization
When analyzing imaging data across populations, it is useful to remove morphological differences between individual brains by transferring data from all subjects onto a single anatomical template. Once spatially normalized, pixel-wise or region-wise comparisons can be made across the population of brains. The VALiDATe29 atlas includes a variety of templates to facilitate spatial normalization. For example, Figure 6 demonstrates alignment of seven subjects’ FA maps, a common routine performed before such techniques as voxel-based morphometry (Ashburner and Friston 2000) or tract-based spatial statistics (Smith et al. 2007).
Figure 6.
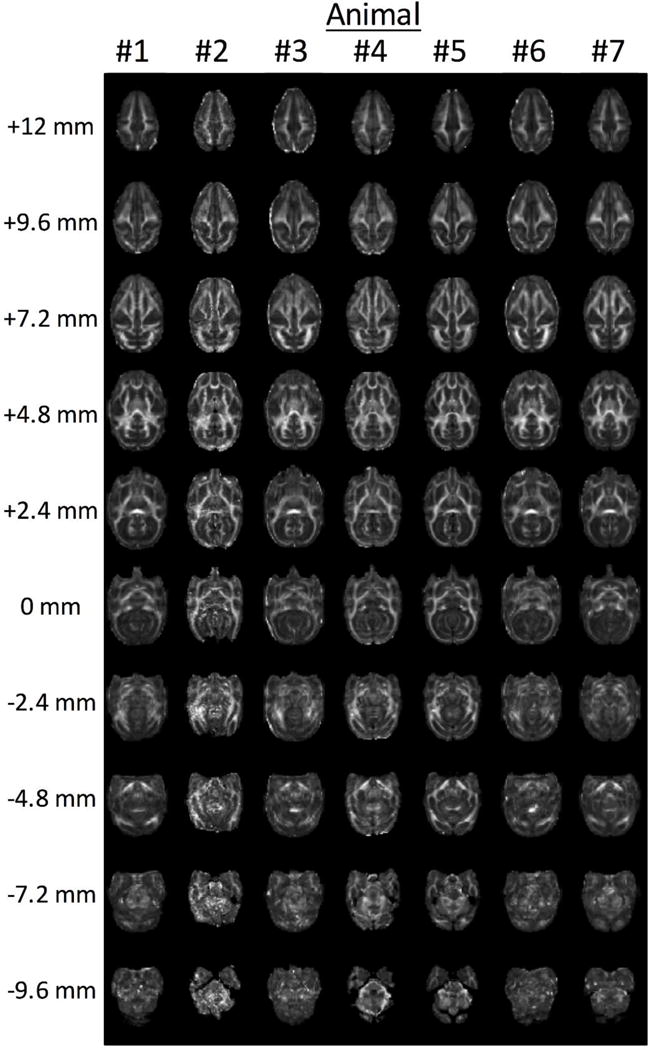
Example of spatial normalization of in vivo FA maps. FA maps for seven subjects were spatially registered to the FA template, a procedure common in multi-subject comparisons.
5. Discussion
In this study, we created a 3D MRI-based atlas of the squirrel monkey brain. The atlas, VALiDATe29, was created from the combination of 29 squirrel monkey brains, and is based on the average orientation and scale of a population of individual subject’s anatomical structures. A stereotaxic coordinate system was placed over the averaged brain templates to create a unique reference space for the squirrel monkey brain. The VALiDATe29 atlas is the first digital atlas of the squirrel monkey brain, and is made freely available to the scientific community (http://www.nitrc.org/projects/validate29). This atlas improves upon the existing printed atlas by employing a brain-based coordinate system, which is more directly related to the brain tissue than those based on surrounding bone. In addition, the use of nonrigid registration results in well-defined, high contrast templates (see Figure 1 and 2), enabling robust alignment of new image volumes and more accurate label propagation.
The atlas currently includes seven template images. This includes in vivo PD-weighted, T1-weighted, and T2*-weighted templates, as well as FA and MD templates derived from diffusion weighted images. Finally, an ex vivo structural template and ex vivo FA template are provided. In addition to the intensity-based templates, a labelled-based segmentation image is included which localizes 81 total structures in both the left and right hemispheres. Together, this multi-channel digital atlas will facilitate spatial normalization and label propagation, improving localization and delineation of brain structures, and providing the framework for pooling data across experiments, across animals, or across time.
The inclusion of a variety of MRI-based contrasts should make the atlas generally applicable to a variety of experimental and multi-modal studies (including electrophysiology and fMRI) and practical with a variety of brain warping algorithms. Additionally, the methodology used to create the atlas can incorporate additional contrasts and modalities. For example, we anticipate future releases to be augmented with high resolution histological data (Sun et al. 2015). This could, for example, be used for validating the accuracy of various diffusion MRI techniques for reconstructing an estimate of local fiber orientation distributions (Choe et al. 2012; Schilling et al. 2016), or confirming the validity of fiber tractography (Gao et al. 2013; Dyrby et al. 2007). Incorporation of fMRI, PET, and brain connectivity information is also readily performed.
A current limitation in the atlas is the small number of monkeys used to derive the labels (N=3). Because of the small number, simple majority voting was used for label map propagation to atlas space and final determination of parcels. With a larger number of source labels, the quality of propagation can be increased with multi-atlas fusion to improve label quality. Currently, many thin structures are not resolved completely in the atlas, for example the interface between the external capsule, claustrum, and extreme capsule narrows down to a width of a few hundred microns, causing discontinuities in the current representation of these tracks. As more data (labels) become available with the inclusion of more monkeys, label probability maps can be created to aptly represent some of these tracks.
Acknowledgments
This work was supported by the National Institute of Neurological Disorders and Stroke of the National Institutes of Health under award numbers RO1 NS058639, RO1 NS069909 and RO1 NS078680, as well as National Institutes of Health grant 1S10 RR 17789. We thank Chaohui Tang for her technical support on animal preparation.
Footnotes
Information Sharing Statement
The VALiDATe29 atlas of the squirrel monkey brain is made freely available to the scientific community at http://www.nitrc.org/projects/validate29.
References
- Abee CR. The Squirrel Monkey in Biomedical Research. ILAR Journal. 1989;31(1):11–20. doi: 10.1093/ilar.31.1.11. [DOI] [Google Scholar]
- Akert REK. Stereotaxic Atlas of the Brain of the Squirrel Monkey. University of Wisconsin Press; 1963. [Google Scholar]
- Andersson JL, Skare S, Ashburner J. How to correct susceptibility distortions in spin-echo echo-planar images: application to diffusion tensor imaging. Neuroimage. 2003;20(2):870–888. doi: 10.1016/S1053-8119(03)00336-7. [DOI] [PubMed] [Google Scholar]
- Ashburner J, Friston KJ. Voxel-based morphometry–the methods. Neuroimage. 2000;11(6 Pt 1):805–821. doi: 10.1006/nimg.2000.0582. [DOI] [PubMed] [Google Scholar]
- Azadbakht H, Parkes LM, Haroon HA, Augath M, Logothetis NK, de Crespigny A, et al. Validation of High-Resolution Tractography Against In Vivo Tracing in the Macaque Visual Cortex. Cereb Cortex. 2015;25(11):4299–4309. doi: 10.1093/cercor/bhu326. [DOI] [PMC free article] [PubMed] [Google Scholar]
- Bastiani M, Oros-Peusquens AM, Seehaus A, Brenner D, Mollenhoff K, Celik A, et al. Automatic Segmentation of Human Cortical Layer-Complexes and Architectural Areas Using Ex vivo Diffusion MRI and Its Validation. Front Neurosci. 2016;10:487. doi: 10.3389/fnins.2016.00487. [DOI] [PMC free article] [PubMed] [Google Scholar]
- Cabezas M, Oliver A, Llado X, Freixenet J, Cuadra MB. A review of atlas-based segmentation for magnetic resonance brain images. Comput Methods Programs Biomed. 2011;104(3):e158–177. doi: 10.1016/j.cmpb.2011.07.015. [DOI] [PubMed] [Google Scholar]
- Calabrese E, Badea A, Coe CL, Lubach GR, Shi Y, Styner MA, et al. A diffusion tensor MRI atlas of the postmortem rhesus macaque brain. Neuroimage. 2015;117:408–416. doi: 10.1016/j.neuroimage.2015.05.072. [DOI] [PMC free article] [PubMed] [Google Scholar]
- Carpenter MB. A stereotaxic atlas of the brain of the squirrel monkey. Archives of Neurology. 1963;9(1):104–104. doi: 10.1001/archneur.1963.00460070114017. [DOI] [Google Scholar]
- Caruyer E, Lenglet C, Sapiro G, Deriche R. Design of multishell sampling schemes with uniform coverage in diffusion MRI. Magn Reson Med. 2013;69(6):1534–1540. doi: 10.1002/mrm.24736. [DOI] [PMC free article] [PubMed] [Google Scholar]
- Chen LM, Friedman RM, Roe AW. Optical imaging of a tactile illusion in area 3b of the primary somatosensory cortex. Science. 2003;302(5646):881–885. doi: 10.1126/science.1087846. [DOI] [PubMed] [Google Scholar]
- Choe AS, Gao Y, Li X, Compton KB, Stepniewska I, Anderson AW. Accuracy of image registration between MRI and light microscopy in the ex vivo brain. [Research Support, N.I.H., Extramural] Magn Reson Imaging. 2011;29(5):683–692. doi: 10.1016/j.mri.2011.02.022. [DOI] [PMC free article] [PubMed] [Google Scholar]
- Choe AS, Stepniewska I, Colvin DC, Ding Z, Anderson AW. Validation of diffusion tensor MRI in the central nervous system using light microscopy: quantitative comparison of fiber properties. NMR Biomed. 2012;25(7):900–908. doi: 10.1002/nbm.1810. [DOI] [PMC free article] [PubMed] [Google Scholar]
- Collins DL, Holmes CJ, Peters TM, Evans AC. Automatic 3-D model-based neuroanatomical segmentation. Hum Brain Mapp. 1995;3(3):190–208. doi: 10.1002/hbm.460030304. [DOI] [Google Scholar]
- D’Arceuil HE, Westmoreland S, de Crespigny AJ. An approach to high resolution diffusion tensor imaging in fixed primate brain. Neuroimage. 2007;35(2):553–565. doi: 10.1016/j.neuroimage.2006.12.028. [DOI] [PubMed] [Google Scholar]
- Dyrby TB, Baare WF, Alexander DC, Jelsing J, Garde E, Sogaard LV. An ex vivo imaging pipeline for producing high-quality and high-resolution diffusion-weighted imaging datasets. [Research Support, Non-U.S. Gov’t Validation Studies] Hum Brain Mapp. 2011;32(4):544–563. doi: 10.1002/hbm.21043. [DOI] [PMC free article] [PubMed] [Google Scholar]
- Dyrby TB, Sogaard LV, Parker GJ, Alexander DC, Lind NM, Baare WF, et al. Validation of in vitro probabilistic tractography. Neuroimage. 2007;37(4):1267–1277. doi: 10.1016/j.neuroimage.2007.06.022. [DOI] [PubMed] [Google Scholar]
- Eickhoff SB, Stephan KE, Mohlberg H, Grefkes C, Fink GR, Amunts K, et al. A new SPM toolbox for combining probabilistic cytoarchitectonic maps and functional imaging data. Neuroimage. 2005;25(4):1325–1335. doi: 10.1016/j.neuroimage.2004.12.034. [DOI] [PubMed] [Google Scholar]
- Evans AC, Marrett S, Neelin P, Collins L, Worsley K, Dai W, et al. Anatomical mapping of functional activation in stereotactic coordinate space. Neuroimage. 1992;1(1):43–53. doi: 10.1016/1053-8119(92)90006-9. [DOI] [PubMed] [Google Scholar]
- Fonov V, Evans AC, Botteron K, Almli CR, McKinstry RC, Collins DL. Unbiased average age-appropriate atlases for pediatric studies. Neuroimage. 2011;54(1):313–327. doi: 10.1016/j.neuroimage.2010.07.033. doi: http://dx.doi.org/10.1016/j.neuroimage.2010.07.033. [DOI] [PMC free article] [PubMed] [Google Scholar]
- Frey S, Pandya DN, Chakravarty MM, Bailey L, Petrides M, Collins DL. An MRI based average macaque monkey stereotaxic atlas and space (MNI monkey space) Neuroimage. 2011;55(4):1435–1442. doi: 10.1016/j.neuroimage.2011.01.040. [DOI] [PubMed] [Google Scholar]
- Gao Y, Choe AS, Stepniewska I, Li X, Avison MJ, Anderson AW. Validation of DTI tractography-based measures of primary motor area connectivity in the squirrel monkey brain. [Research Support, N.I.H., Extramural Validation Studies] PLoS One. 2013;8(10):e75065. doi: 10.1371/journal.pone.0075065. [DOI] [PMC free article] [PubMed] [Google Scholar]
- Gao Y, Khare SP, Panda S, Choe AS, Stepniewska I, Li X, et al. (PMC4013108). A brain MRI atlas of the common squirrel monkey, Saimiri sciureus. Proc SPIE Int Soc Opt Eng. 2014 Mar 13;9038:90380C. doi: 10.1117/12.2043589. [DOI] [PMC free article] [PubMed] [Google Scholar]
- Gao Y, Parvathaneni P, Schilling K, Zu Z, Choe A, Stepniewska I, et al. A 3D high resolution ex vivo white matter atlas of the common squirrel monkey (Saimiri sciureus) based on diffusion tensor imaging; Paper presented at the In Proceedings of the SPIE Medical Imaging Conference; San Diego, California. 2016. Feb, [DOI] [PMC free article] [PubMed] [Google Scholar]
- Gee JC, Reivich M, Bajcsy R. Elastically deforming 3D atlas to match anatomical brain images. J Comput Assist Tomogr. 1993;17(2):225–236. doi: 10.1097/00004728-199303000-00011. [DOI] [PubMed] [Google Scholar]
- Grabner G, Janke AL, Budge MM, Smith D, Pruessner J, Collins DL. Symmetric atlasing and model based segmentation: an application to the hippocampus in older adults. Med Image Comput Comput Assist Interv. 2006;9(Pt 2):58–66. doi: 10.1007/11866763_8. [DOI] [PubMed] [Google Scholar]
- Greer PJ, Villemagne VL, Ruszkiewicz J, Graves AK, Meltzer CC, Mathis CA, et al. MR atlas of the baboon brain for functional neuroimaging. Brain Res Bull. 2002;58(4):429–438. doi: 10.1016/s0361-9230(02)00810-9. [DOI] [PubMed] [Google Scholar]
- Heffner RS, Masterton RB. The Role of the Corticospinal Tract in the Evolution of Human Digital Dexterity. Brain, Behavior and Evolution. 1983;23(3–4):165–183. doi: 10.1159/000121494. [DOI] [PubMed] [Google Scholar]
- Hikishima K, Quallo MM, Komaki Y, Yamada M, Kawai K, Momoshima S, et al. Population-averaged standard template brain atlas for the common marmoset (Callithrix jacchus) Neuroimage. 2011;54(4):2741–2749. doi: 10.1016/j.neuroimage.2010.10.061. [DOI] [PubMed] [Google Scholar]
- Jenett A, Schindelin JE, Heisenberg M. The Virtual Insect Brain protocol: creating and comparing standardized neuroanatomy. BMC Bioinformatics. 2006;7:544. doi: 10.1186/1471-2105-7-544. [DOI] [PMC free article] [PubMed] [Google Scholar]
- Kaas JH, Nelson RJ, Sur M, Dykes RW, Merzenich MM. The somatotopic organization of the ventroposterior thalamus of the squirrel monkey, Saimiri sciureus. J Comp Neurol. 1984;226(1):111–140. doi: 10.1002/cne.902260109. [DOI] [PubMed] [Google Scholar]
- Kaas JH, Stepniewska I, Gharbawie O. Cortical networks subserving upper limb movements in primates. Eur J Phys Rehabil Med. 2012;48(2):299–306. [PMC free article] [PubMed] [Google Scholar]
- Knosche TR, Anwander A, Liptrot M, Dyrby TB. Validation of tractography: Comparison with manganese tracing. Hum Brain Mapp. 2015;36(10):4116–4134. doi: 10.1002/hbm.22902. [DOI] [PMC free article] [PubMed] [Google Scholar]
- Kovacevic N, Henderson JT, Chan E, Lifshitz N, Bishop J, Evans AC, et al. A three-dimensional MRI atlas of the mouse brain with estimates of the average and variability. Cereb Cortex. 2005;15(5):639–645. doi: 10.1093/cercor/bhh165. [DOI] [PubMed] [Google Scholar]
- Leergaard TB, White NS, de Crespigny A, Bolstad I, D’Arceuil H, Bjaalie JG, et al. Quantitative Histological Validation of Diffusion MRI Fiber Orientation Distributions in the Rat Brain. PLoS One. 2010;5(1):e8595. doi: 10.1371/journal.pone.0008595. [DOI] [PMC free article] [PubMed] [Google Scholar]
- MacLean JAGPD. A Stereotaxic Atlas of the Squirrel Monkey’s Brain (Saimiri sciureus) U.S. Department of Health, Education, and Welfare; 1962. [Google Scholar]
- Mazziotta JC, Toga AW, Evans A, Fox P, Lancaster J. A probabilistic atlas of the human brain: theory and rationale for its development. The International Consortium for Brain Mapping (ICBM) Neuroimage. 1995;2(2):89–101. doi: 10.1006/nimg.1995.1012. [DOI] [PubMed] [Google Scholar]
- McNab JA, Jbabdi S, Deoni SC, Douaud G, Behrens TE, Miller KL. High resolution diffusion-weighted imaging in fixed human brain using diffusion-weighted steady state free precession. [In Vitro Research Support, Non-U.S. Gov’t] Neuroimage. 2009;46(3):775–785. doi: 10.1016/j.neuroimage.2009.01.008. [DOI] [PubMed] [Google Scholar]
- Mori S, Oishi K, Jiang H, Jiang L, Li X, Akhter K, et al. Stereotaxic white matter atlas based on diffusion tensor imaging in an ICBM template. Neuroimage. 2008;40(2):570–582. doi: 10.1016/j.neuroimage.2007.12.035. [DOI] [PMC free article] [PubMed] [Google Scholar]
- Newman JD, Kenkel WM, Aronoff EC, Bock NA, Zametkin MR, Silva AC. A combined histological and MRI brain atlas of the common marmoset monkey, Callithrix jacchus. Brain Res Rev. 2009;62(1):1–18. doi: 10.1016/j.brainresrev.2009.09.001. [DOI] [PMC free article] [PubMed] [Google Scholar]
- Nudo RJ, Sutherland DP, Masterton RB. Variation and evolution of mammalian corticospinal somata with special reference to primates. The Journal of Comparative Neurology. 1995;358(2):181–205. doi: 10.1002/cne.903580203. [DOI] [PubMed] [Google Scholar]
- Paxinos G, Franklin KBJ. The mouse brain in stereotaxic coordinates. Amsterdam; Boston: Elsevier Academic Press; 2004. Compact 2nd ed. [Google Scholar]
- Paxinos G, Watson C. Paxino’s and Watson’s The rat brain in stereotaxic coordinates. Seventh. Amsterdam; Boston: Elsevier/AP, Academic Press is an imprint of Elsevier; 2014. [Google Scholar]
- Rohlfing T, Kroenke CD, Sullivan EV, Dubach MF, Bowden DM, Grant KA, et al. The INIA19 Template and NeuroMaps Atlas for Primate Brain Image Parcellation and Spatial Normalization. Front Neuroinform. 2012;6:27. doi: 10.3389/fninf.2012.00027. [DOI] [PMC free article] [PubMed] [Google Scholar]
- Rohlfing T, Zahr NM, Sullivan EV, Pfefferbaum A. The SRI24 Multi-Channel Brain Atlas: Construction and Applications. Proc SPIE Int Soc Opt Eng. 2008;6914:691409. doi: 10.1117/12.770441. [DOI] [PMC free article] [PubMed] [Google Scholar]
- Schilling K, Gao Y, Stepniewska I, Choe AS, Landman BA, Anderson AW. Reproducibility and variation of diffusion measures in the squirrel monkey brain, in vivo and ex vivo. Magn Reson Imaging. 2017;35:29–38. doi: 10.1016/j.mri.2016.08.015. [DOI] [PMC free article] [PubMed] [Google Scholar]
- Schilling K, Janve V, Gao Y, Stepniewska I, Landman BA, Anderson AW. Comparison of 3D orientation distribution functions measured with confocal microscopy and diffusion MRI. Neuroimage. 2016;129:185–197. doi: 10.1016/j.neuroimage.2016.01.022. [DOI] [PMC free article] [PubMed] [Google Scholar]
- Schmahmann JD, Pandya D. Fiber pathways of the brain. OUP; USA: 2009. [Google Scholar]
- Schwarz AJ, Danckaert A, Reese T, Gozzi A, Paxinos G, Watson C, et al. A stereotaxic MRI template set for the rat brain with tissue class distribution maps and co-registered anatomical atlas: application to pharmacological MRI. Neuroimage. 2006;32(2):538–550. doi: 10.1016/j.neuroimage.2006.04.214. [DOI] [PubMed] [Google Scholar]
- Shepherd TM, Thelwall PE, Stanisz GJ, Blackband SJ. Aldehyde fixative solutions alter the water relaxation and diffusion properties of nervous tissue. [Research Support, N.I.H., Extramural] Magn Reson Med. 2009;62(1):26–34. doi: 10.1002/mrm.21977. [DOI] [PMC free article] [PubMed] [Google Scholar]
- Shi Z, Rogers BP, Chen LM, Morgan VL, Mishra A, Wilkes DM, et al. Realistic models of apparent dynamic changes in resting-state connectivity in somatosensory cortex. Hum Brain Mapp. 2016;37(11):3897–3910. doi: 10.1002/hbm.23284. [DOI] [PMC free article] [PubMed] [Google Scholar]
- Sled JG, Zijdenbos AP, Evans AC. A nonparametric method for automatic correction of intensity nonuniformity in MRI data. IEEE Trans Med Imaging. 1998;17(1):87–97. doi: 10.1109/42.668698. [DOI] [PubMed] [Google Scholar]
- Smith SM. Fast robust automated brain extraction. Hum Brain Mapp. 2002;17(3):143–155. doi: 10.1002/hbm.10062. [DOI] [PMC free article] [PubMed] [Google Scholar]
- Smith SM, Johansen-Berg H, Jenkinson M, Rueckert D, Nichols TE, Miller KL, et al. Acquisition and voxelwise analysis of multi-subject diffusion data with tract-based spatial statistics. Nat Protoc. 2007;2(3):499–503. doi: 10.1038/nprot.2007.45. [DOI] [PubMed] [Google Scholar]
- Stepniewska I, Gharbawie OA, Burish MJ, Kaas JH. Effects of muscimol inactivations of functional domains in motor, premotor, and posterior parietal cortex on complex movements evoked by electrical stimulation. J Neurophysiol. 2014;111(5):1100–1119. doi: 10.1152/jn.00491.2013. [DOI] [PMC free article] [PubMed] [Google Scholar]
- Sun P, Parvathaneni P, Schilling KG, Gao Y, Janve V, Anderson A, et al. Integrating histology and MRI in the first digital brain of common squirrel monkey, Saimiri sciureus. Proc SPIE Int Soc Opt Eng. 2015;9417 doi: 10.1117/12.2081443. [DOI] [PMC free article] [PubMed] [Google Scholar]
- Talairach J. Atlas d’anatomie stéréotaxique du télencéphale, études anatomo-radiologiques. Paris: Masson et Cie; 1967. [Google Scholar]
- Talairach J, Tournoux P. Co-planar stereotaxic atlas of the human brain : 3-dimensional proportional system : an approach to cerebral imaging. Stuttgart; New York: Georg Thieme; 1988. [Google Scholar]
- Tiede U, Bomans M, Hohne KH, Pommert A, Riemer M, Schiemann T, et al. A computerized three-dimensional atlas of the human skull and brain. AJNR Am J Neuroradiol. 1993;14(3):551–559. doi: 10.1007/978-1-4899-1701-0_9. discussion 560–551. [DOI] [PMC free article] [PubMed] [Google Scholar]
- Toga AW. Brain warping. San Diego: Academic Press; 1999. [Google Scholar]
- Wang Z, Chen LM, Negyessy L, Friedman RM, Mishra A, Gore JC, et al. The relationship of anatomical and functional connectivity to resting-state connectivity in primate somatosensory cortex. Neuron. 2013;78(6):1116–1126. doi: 10.1016/j.neuron.2013.04.023. [DOI] [PMC free article] [PubMed] [Google Scholar]
- Wehrl HF, Bezrukov I, Wiehr S, Lehnhoff M, Fuchs K, Mannheim JG, et al. Assessment of murine brain tissue shrinkage caused by different histological fixatives using magnetic resonance and computed tomography imaging. Histol Histopathol. 2015;30(5):601–613. doi: 10.14670/HH-30.601. [DOI] [PubMed] [Google Scholar]
- Wilson GH, 3rd, Yang PF, Gore JC, Chen LM. Correlated inter-regional variations in low frequency local field potentials and resting state BOLD signals within S1 cortex of monkeys. Hum Brain Mapp. 2016;37(8):2755–2766. doi: 10.1002/hbm.23207. [DOI] [PMC free article] [PubMed] [Google Scholar]
- Wisner K, Odintsov B, Brozoski D, Brozoski TJ. Ratat1: A Digital Rat Brain Stereotaxic Atlas Derived from High-Resolution MRI Images Scanned in Three Dimensions. Front Syst Neurosci. 2016;10:64. doi: 10.3389/fnsys.2016.00064. [DOI] [PMC free article] [PubMed] [Google Scholar]
- Woods RP, Fears SC, Jorgensen MJ, Fairbanks LA, Toga AW, Freimer NB. A web-based brain atlas of the vervet monkey, Chlorocebus aethiops. Neuroimage. 2011;54(3):1872–1880. doi: 10.1016/j.neuroimage.2010.09.070. [DOI] [PMC free article] [PubMed] [Google Scholar]
- Yeh FC, Verstynen TD, Wang Y, Fernandez-Miranda JC, Tseng WY. Deterministic diffusion fiber tracking improved by quantitative anisotropy. PLoS One. 2013;8(11):e80713. doi: 10.1371/journal.pone.0080713. [DOI] [PMC free article] [PubMed] [Google Scholar]