
Figure 5.
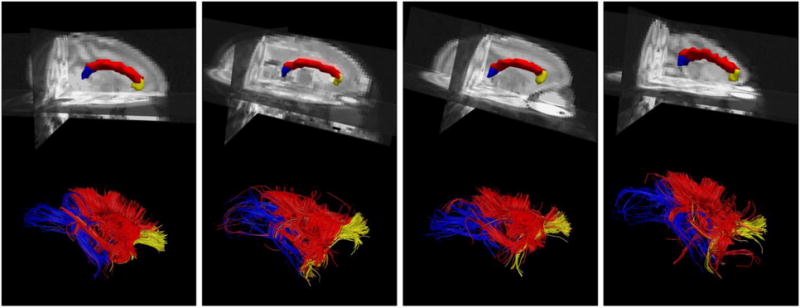
Example of label propagation for defining seed regions for fiber tracking. Parcellation results for the genu of the corpus callosum (yellow), body of the corpus callosum (red), and splenium of the corpus callosum (blue) are shown in four monkeys (top). 3D rendering of fiber tracts in each subject’s diffusion space, colored according to corpus callosum parcellation (bottom). Fiber tracking was performed with Diffusion Toolkit using the diffusion tensor model and default tracking parameters, and results were visualized using TrackVis.