

Abstract
The mechanistic target of rapamycin complex 1 (mTORC1) is a master regulator of protein synthesis and potential target for modifying cellular metabolism in various conditions, including cancer and aging. mTORC1 activity is tightly regulated by the availability of extracellular amino acids, and previous studies have revealed that amino acids in the extracellular fluid are transported to the lysosomal lumen. There, amino acids induce recruitment of cytoplasmic mTORC1 to the lysosome by the Rag GTPases, followed by mTORC1 activation by the small GTPase Ras homolog enriched in brain (Rheb). However, how the extracellular amino acids reach the lysosomal lumen and activate mTORC1 remains unclear. Here, we show that amino acid uptake by dynamin-dependent endocytosis plays a critical role in mTORC1 activation. We found that mTORC1 is inactivated when endocytosis is inhibited by overexpression of a dominant-negative form of dynamin 2 or by pharmacological inhibition of dynamin or clathrin. Consistently, the recruitment of mTORC1 to the lysosome was suppressed by the dynamin inhibition. The activity and lysosomal recruitment of mTORC1 were rescued by increasing intracellular amino acids via cycloheximide exposure or by Rag overexpression, indicating that amino acid deprivation is the main cause of mTORC1 inactivation via the dynamin inhibition. We further show that endocytosis inhibition does not induce autophagy even though mTORC1 inactivation is known to strongly induce autophagy. These findings open new perspectives for the use of endocytosis inhibitors as potential agents that can effectively inhibit nutrient utilization and shut down the upstream signals that activate mTORC1.
Keywords: amino acid, autophagy, dynamin, endocytosis, mammalian target of rapamycin (mTOR), mTORC1, mechanistic target of rapamycin (mTOR)
Introduction
Animals store energy when abundant nutrients are available in the bloodstream. Inversely, when nutrients are limited, catabolic breakdown of stored materials is triggered to provide energy and building blocks that support survival in the starved condition (1). The regulation of nutrient storage and consumption is governed by a kinase called mechanistic target of rapamycin (mTOR),3 which is evolutionally conserved from yeast to human. The activity of mTOR is regulated by nutrients, growth factors, and cellular stresses. Activated mTOR strongly induces a net anabolic effect by up-regulating anabolic pathways and down-regulating the catabolic autophagy pathway at the same time (1).
The mTOR protein is a catalytic subunit and forms two distinct complexes, mTOR complex 1 and 2 (mTORC1 and mTORC2, respectively), based on differences in its subunit composition. The mTORC1 complex has been shown to play an important role in protein synthesis. The substrates of mTORC1 include S6 kinase 1 (S6K1) and eIF4E-binding protein 1 (4E-BP1), both of which enhance mRNA translation when phosphorylated by mTORC1 (2). In addition to promoting protein synthesis, mTORC1 suppresses autophagy likely through the phosphorylation of Atg13 and ULK1 (3). Because a net increase in protein mass, which is accomplished by mTORC1, primes cells for growth and proliferation, it is speculated that unregulated activation of mTORC1 is associated with cancer proliferation. This speculation is supported by the fact that loss-of-function mutations of negative regulators of mTORC1, such as TSC1-TSC2, PTEN, and LKB1, are frequently found in cancers (2). Moreover, previous studies have also shown that life longevity can be increased by suppressing mTORC1 via moderate starvation and dietary restriction (4). Therefore, suppression of mTORC1 activity may be a reasonable approach against cancer and aging.
In previous studies, extracellular amino acids have been identified as a strong stimulator of mTORC1 activation (5, 6), but the mechanism of how extracellular amino acids induces mTORC1 remained unknown. However, recent studies have revealed that amino acids inside the lysosome are the key to mTORC1 activation, and the vacuolar-type H+-ATPase (V-ATPase) and the amino acid transporter SLC38A9 in the lysosomal membrane have been identified to be sensors for intra-lysosomal amino acids (7, 28). When these sensors detect amino acids, they activate the Rag GTPases through the guanine-nucleotide exchange factor activity of Ragulator, which is a protein complex that tethers the Rag GTPases to the lysosomal membrane (8, 9). When activated, the Rag GTPases bind to the mTORC1-specific subunit Raptor, recruiting mTORC1 from the cytoplasm to the lysosomal membrane (10). In addition, a mechanism of mTORC1 recruitment that is V-ATPase-dependent but Rag-independent has been reported. In this case, ADP-ribosylation factor 1 (Arf1) plays a role in mTORC1 activation (11). The recruitment of mTORC1 to the lysosome allows for its activation by Rheb, which is specifically localized on endomembranes, including the lysosomal membrane. Although the activity of Rheb is enhanced by growth factors through pathways that involve PI3K, mTORC2, Akt, and TSC1–2 (2), amino acids are prerequisites for mTORC1 activation (6). Consistent with the importance of lysosomes for mTORC1 activation, the disturbance of intracellular membrane traffic by overexpressing Rab mutants abrogates amino acid-induced mTORC1 activation (12–14).
Strikingly, cell-free experiments with isolated lysosomes and the purified mTORC1-specific subunit Raptor have shown that amino acid-induced Raptor recruitment can occur on isolated lysosomes, suggesting that all the necessary components, including the amino acid sensors and scaffold proteins, exist in the lysosome (7). Moreover, membrane-permeable alcohol-ester amino acids are more potent to induce the recruitment of Raptor in this cell-free system. In contrast, artificial depletion of amino acids from the lysosomal lumen resulted in the abrogation of Raptor recruitment (7), suggesting that the amino acids are sensed on the luminal side of the lysosome.
The existence of the amino acid sensors within the lysosomal lumen raises the fundamental question of how extracellular amino acids are transported into the lysosomal lumen. Because the permeability of amino acids through the lipid bilayers is very low (15), mechanisms must exist for the cell to effectively transport extracellular amino acids into the lysosomal lumen. Recent studies have suggested that macropinocytosis is required for mTORC1 activation (16, 17). Macropinocytosis is a specific form of endocytosis that is induced by growth factors or oncogenic mutations (18). When macropinocytosis is induced, membrane ruffling and subsequent membrane closure result in the incorporation of a relatively large amount of extracellular fluid. It has been shown that growth factor-induced macropinocytosis is required for the induction of mTORC1 activation 5–15 min after stimulating serum-starved cells with growth factors (17). On the other hand, another group has shown that, in the absence of essential amino acids, cells harboring the K-Ras G12D mutation required macropinocytosis of extracellular proteins for the maintenance of mTORC1 activity (16). In their study, however, they show that macropinocytosis is not required for mTORC1 activation if extracellular amino acids are present, which suggests the existence of a macropinocytosis-independent mechanism for amino acid uptake.
One possible mechanism involves amino acid transporters (19). For example, mTORC1 is regulated by cellular uptake of glutamine by the glutamine transporter SLC1A5 and by the subsequent exchange of intracellular glutamine with extracellular essential amino acids by the bidirectional transporter SLC7A5/SLC3A2 (20). However, more general forms of endocytosis, such as clathrin- and caveolae-mediated endocytosis, may play a role in the effective transport of amino acids from the extracellular space to the lysosome. In contrast to macropinocytosis, which utilizes membrane ruffling, these forms of endocytosis utilize invagination on the plasma membrane and the subsequent formation of endocytic vesicles. Both clathrin- and caveolae-mediated endocytosis are dependent on dynamin, a GTPase that helps pinch off the endocytic vesicles (21).
In this study, we examined the significance of dynamin-dependent endocytosis for mTORC1 activity in the presence of extracellular amino acids, and found that dynamin-dependent endocytosis of amino acids is required for the induction and maintenance of mTORC1 activity. Importantly, inhibition of endocytosis suppresses two compensatory reactions normally induced by mTORC1 inactivation: enhanced nutrient generation by endocytosis and by autophagy, thereby providing a more thorough method for the cell to inhibit nutrient utilization. Thus, inhibition of endocytosis-mediated nutrient uptake may be a reasonable approach to mTORC1- and nutrient-dependent conditions such as cancer and aging.
Results
Endocytosis inhibition results in mTORC1 inactivation
Recent studies have revealed that mTORC1 is activated when amino acids in the lysosomal lumen are sensed by the V-ATPase (7) and by SLC38A9 (28). We suspected that, in the presence of extracellular amino acids, dynamin-dependent endocytosis of amino acids may be critical for the maintenance of mTORC1 activity. To test this, we examined the effect of overexpressing a dominant-negative form of dynamin 2 (dynamin 2 K44A). Although dynamin 2 exhibits ubiquitous expression, dynamin 1 is specific to neurons and dynamin 3 is predominantly expressed in the testis, lung, and neurons (21). We overexpressed dynamin 2 K44A in 293T cells, a cell line that has been widely used and well-characterized in studies of amino acid-dependent mTORC1 activation (7–10). As shown in Fig. 1A, the overexpression of dynamin 2 K44A effectively reduced mTORC1 activity as assessed by the decreased phosphorylation of S6K at Thr389, suggesting that dynamin-dependent processes are required for mTORC1 activation. In contrast, no apparent changes were observed in the phosphorylation of Akt at Thr308 and Ser473, both of which would enhance Akt activity (Fig. 1A) (22), indicating that the decreased mTORC1 activity by dynamin inhibition was not likely the result of the decreased activity of the upstream kinase Akt. We also confirmed that expression levels of mTORC1 subunits mTOR and Raptor were not affected by dynamin inhibition (supplemental Fig. S1). This suggests that the decreased mTORC1 activity was not caused by the change in protein levels of these mTORC1 subunits.
Figure 1.

Endocytosis inhibition results in mTORC1 inactivation. A, 293T cells were transfected with pcDNA3.1 vector (mock) or pcDNA3.1/dynamin 2 K44A. Cells were harvested at 24 h after transfection. B, quantification of the immunoblot data in A. Each bar indicates mean ± S.D. of three independent experiments. *, p < 0.05. C, 293T cells were treated with 0.1% DMSO (vehicle), 80 μm Dynasore, or 30 μm PitStop 2 for the indicated time.
After confirming the effect of the dynamin 2 K44A overexpression, we next tested the pharmacological inhibition of dynamin by Dynasore (23). As shown in Fig. 1C, we observed rapid inactivation of mTORC1 shortly after the addition of Dynasore. The mTORC1-suppressing effect was obvious as early as 15 min after the addition of Dynasore. Similarly, the clathrin inhibitor PitStop 2 (24) resulted in the inhibition of mTORC1 activity, showing that two different inhibitors of endocytosis can lead to mTORC1 inactivation. Suppression of endocytosis by Dynasore and PitStop 2 was confirmed by microscopic observations of DQTM BSA, a protease substrate that becomes fluorescent when endocytosed and subsequently hydrolyzed in the lysosome (supplemental Fig. S2). Therefore, the pharmacological inhibition of dynamin-dependent endocytosis results in rapid and sustained inactivation of mTORC1 activity.
Endocytosis inhibitors and amino acid deprivation lead to inactivation of mTORC1 but not mTORC2
In contrast to endocytosis inhibitors that specifically inactivate mTORC1, the dual mTOR inhibitor Torin 1, which inhibits mTORC1 and mTORC2 (25), induces dephosphorylation of Akt and S6K (Fig. 2). On the other hand, amino acid deprivation resulted in mTORC1 inactivation but did not affect the phosphorylation of Akt. Both of these observations were similar to what was observed when endocytosis was inhibited (Fig. 2). This suggests the possibility that mTORC1 inactivation by endocytosis inhibition may be the result of decreased cellular uptake of extracellular amino acids.
Figure 2.
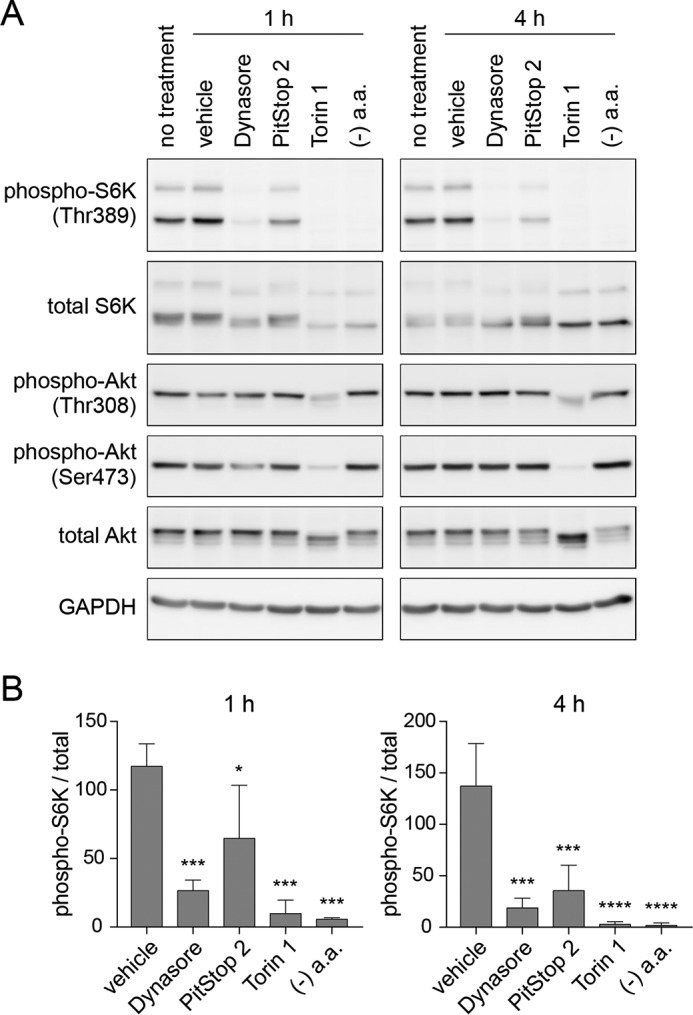
Endocytosis inhibitors and amino acid deprivation lead to inactivation of mTORC1 but not mTORC2. A, 293T cells were treated for 1 or 4 h with 0.1% DMSO, 80 μm Dynasore, 30 μm PitStop 2, or 250 nm Torin 1 in RPMI1640 medium containing 10% Nu-Serum, or with amino acid- and serum-free RPMI1640 medium. B, quantification of immunoblot data in A. Each bar indicates mean ± S.D. of three independent experiments. *, p < 0.05; ***, p < 0.001; ****, p < 0.0001 compared with the vehicle treatment group.
Endocytosis inhibitors prevent activation and lysosomal localization of mTORC1 induced by amino acid stimulation
Previous studies have shown that mTORC1 inactivated by amino acid deprivation is rapidly reactivated by amino acid stimulation (6, 10). Consistent with these studies, mTORC1 was inactivated by incubating the cells in amino acid-free medium containing dialyzed serum for 50 min, and reactivation of mTORC1 was observed at 10 or 40 min after the reintroduction of amino acids (Fig. 3, A and B); however, reactivation of mTORC1 was effectively suppressed by Dynasore and PitStop 2 (Fig. 3, A and B).
Figure 3.

Amino acid-induced activation and lysosomal localization of mTORC1 is prevented by endocytosis inhibition. A, 293T cells were starved for amino acids in amino acid-free RPMI1640 medium containing 10% dialyzed Nu-Serum in combination with 0.1% DMSO or 80 μm Dynasore. After 50 min starvation, cells were stimulated for 40 min with amino acids by adding 1/50 volume of ×50 amino acid solution containing l-glutamine. B, quantification of immunoblot data in A. Mean values of two independent experiments are shown. C, 293T cells were treated as in A and subjected to immunofluorescence with anti-mTOR and anti-Lamp1 antibodies. Scale bar = 10 μm. D, quantification of cells that exhibit lysosomal localization of mTOR by analysis of image data in C. Each bar indicates mean ± S.D. of three independent experiments. ***, p < 0.001. E, quantification of fluorescence intensity of mTOR on lysosomes by analysis of image data in C. Each bar indicates mean ± S.D. of three independent experiments. ****, p < 0.0001.
It has been shown that amino acid deprivation from the medium causes detachment of mTORC1 from the lysosome (7, 10). If the endocytosis of extracellular amino acids is required for mTORC1 activation, dynamin inhibition should result in the detachment of mTORC1 from the lysosome as observed in amino acid-deprived cells. To test this, we performed immunofluorescence for mTOR and the lysosomal marker Lamp1 and quantified the fluorescence images by two different methods (counting cells that exhibit mTOR-Lamp1 colocalization and quantifying fluorescence intensity of mTOR in Lamp1-positive areas) (Fig. 3, C–E). As previously reported (10), we confirmed that amino acid deprivation for 50 min caused diffusive mTOR localization throughout the cytoplasm in 293T cells, and the subsequent reintroduction of amino acids for 40 min rescues the accumulation of mTOR on the lysosome (Fig. 3, C–E). This amino acid-dependent relocalization of mTOR was effectively prevented by Dynasore (Fig. 3, C–E). Taken together, these data suggest that endocytosis inhibition prevents the amino acid-dependent recruitment of mTORC1 to the lysosome and subsequent mTORC1 activation, likely by inhibiting amino acid endocytosis.
Lysosomal localization and activation of mTORC1 are prevented by endocytosis inhibition and rescued by cycloheximide (CHX)
Similarly to amino acid deprivation, treatment of cells with Dynasore for 1 h resulted in the detachment of mTOR from the lysosome even in the presence of extracellular amino acids (Fig. 4, A–C). Moreover, this detachment of mTOR from the lysosome by Dynasore was reversed by the simultaneous addition of CHX, which inhibits protein synthesis and elevates intracellular amino acid levels (7) (Fig. 4, A–C). Consistently, Western blot analysis of phospho-S6K showed that CHX reversed the inactivation of mTORC1 by Dynasore (Fig. 4, D and E). These results suggest that the mTORC1 inactivation caused by endocytosis inhibition is mediated by a failure to uptake extracellular amino acids.
Figure 4.

Lysosomal localization and activation of mTORC1 are prevented by endocytosis inhibition and rescued by CHX. A, 293T cells were treated for 1 h with 0.2% DMSO, 80 μm Dynasore, or 80 μm Dynasore and 10 μg/ml of CHX, fixed, and stained with anti-mTOR and anti-Lamp1 antibodies. The results shown are representative of three independent experiments. Scale bar = 10 μm. B, quantification of cells that exhibit lysosomal localization of mTOR by analysis of image data in A. Each bar indicates mean ± S.D. of three independent experiments. **, p < 0.01. C, quantification of fluorescence intensity of mTOR on lysosomes by analysis of image data in A. Each bar indicates mean ± S.D. of three independent experiments. *, p < 0.05; **, p < 0.01. D, 293T cells were treated for 1 or 4 h with 0.2% DMSO, 10 μg/ml of CHX, 80 μm Dynasore, or 80 μm Dynasore and 10 μg/ml of CHX. E, quantification of immunoblot data in D. Each bar indicates mean ± S.D. of four independent experiments. *, p < 0.05; **, p < 0.01 compared with the vehicle treatment group.
mTORC1 inactivation by endocytosis inhibition is rescued by overexpression of Rag GTPases and Rheb
As described above, activation of mTORC1 by amino acids is regulated by the Rag GTPases and Rheb. The Rag GTPases are localized on the lysosome and activated in the presence of amino acids. Upon activation, the Rag GTPases bind to mTORC1 and recruits it to the lysosome, where mTORC1 is activated by Rheb. Therefore, if endocytosis inhibition causes mTORC1 inactivation via these amino acid-dependent processes, overexpression of Rheb or constitutively active Rag should rescue the decreased activity of mTORC1 in endocytosis-inhibited cells. To test this, we simultaneously overexpressed the constitutively active forms of RagB and RagC (RagBGTP and RagCGDP) or singly overexpressed Rheb. Overexpression of these proteins is known to bypass the requirement of amino acids for mTORC1 activation (7, 10). As shown in Fig. 5, mock transfection did not rescue the decreased mTORC1 activity caused by Dynasore. In contrast, both RagBGTP/RagCGDP and Rheb partly rescued the decreased mTORC1 activity. Although this tendency for rescue was consistently observed in all three experiments, the rescue was only partial, especially for RagBGTP/RagCGDP overexpression. This may be because the transfection efficiency and expression levels were not sufficiently high (Fig. 5A). Indeed, transfection efficiency was estimated to be around 37% for RagBGTP/RagCGDP and 44% for Rheb, when analyzed by flow cytometry (supplemental Fig. S3), causing an underestimation of the effect of the Rag/Rheb overexpression. Nevertheless, when transfected cells were individually observed by fluorescence microscopy, RagBGTP/RagCGDP rescued the decreased lysosomal localization of mTOR caused by Dynasore in most of the transfected cells (Fig. 5, C and D), suggesting that lysosomal recruitment of mTORC1 can be bypassed by constitutively active Rag.
Figure 5.

Decreased mTORC1 activity in endocytosis-inhibited cells is rescued by overexpression of Rheb and constitutively active Rag. A, 293T cells were transfected with pRK5/HA-GST (mock); pRK5/HA-GST-RagB(99L) and pRK5/HA-GST(75L) (RagBGTP/RagCGDP); or pRK5/HA-GST-Rheb1 (Rheb). At 24 h post-transfection, cells were treated for 4 h with 0.1% DMSO (vehicle) or 80 μm Dynasore. B, quantification of immunoblot data in A. Each bar indicates mean ± S.D. of three independent experiments. **, p < 0.01. C, 293T cells were transfected as in A and subjected to immunofluorescence with anti-mTOR and anti-HA antibodies. Arrows indicate colocalization of mTOR and RagB/C. Scale bar = 10 μm. D, quantification of cells that exhibit punctate mTOR localization by analysis of image data in C. Only transfected (HA-positive) cells were examined. Each bar indicates mean ± S.D. of three independent experiments. ****, p < 0.0001.
Endocytosis inhibition leads to decreased autophagic activity even with mTORC1 inactivation
We next tested if mTORC1 inactivation by Dynasore induces autophagy, an intracellular degradation system. Autophagy is suppressed by mTORC1, and therefore autophagic activity is maintained at a low level in the presence of amino acids and growth factors. Inversely, pharmacological inhibition of mTORC1 and amino acid deprivation are known to strongly induce autophagy (3). Therefore, it is possible that inhibition of endocytosis induces autophagy as a consequence of mTORC1 inactivation. To assess autophagic activity in endocytosis-inhibited cells, Western blot analysis of LC3 with the lysosomal inhibitor bafilomycin A1 (Baf A1) was performed (Fig. 6). We found that LC3-II turnover (calculated as the difference in LC3-II amount when the cells were treated with and without Baf A1 as described under “Experimental procedures”), which reflects autophagic activity, markedly decreased in Dynasore- and PitStop 2-treated cells under both the resting and autophagy-inducing conditions (Torin 1 and amino acid starvation) (Fig. 6). Consistent with this, microscopic observation revealed that Dynasore and PitStop 2 suppressed the formation of dot-like structures of LC3 (isolation membranes and autophagosomes) and WIPI2 (autophagosome formation sites and isolation membranes) (3). These results indicate that autophagy was suppressed by the endocytosis inhibitors. Although this result seems inconsistent with the model that mTORC1 inactivation leads to the induction of autophagy, it is still consistent with previous studies that suggest endocytic membranes contribute to the progression of autophagy (26, 27).
Figure 6.
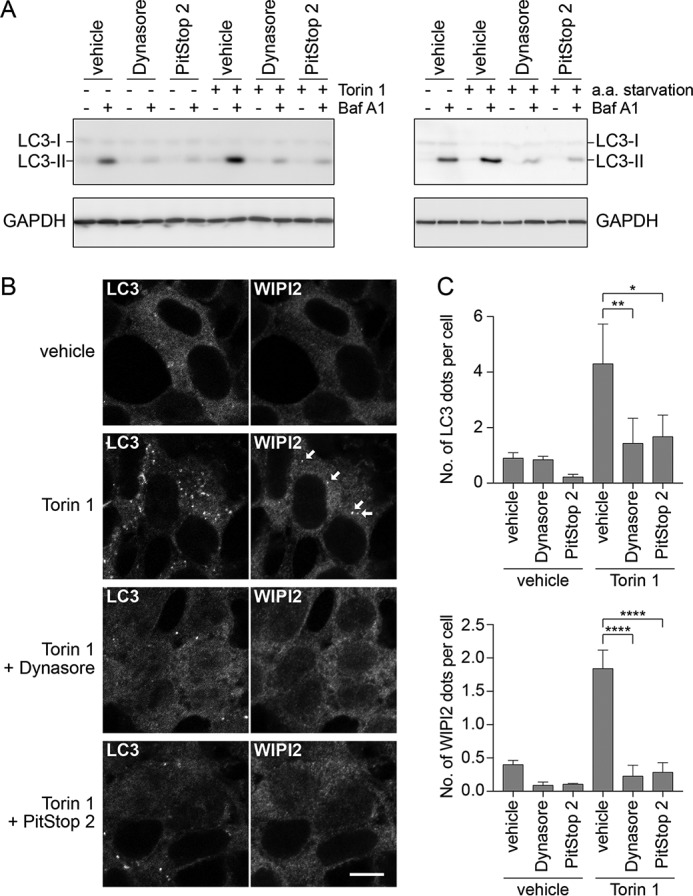
Endocytosis inhibition leads to decreased autophagic activity even with mTORC1 inactivation. A, left: 293T cells were treated for 4 h with DMSO, 80 μm Dynasore, 30 μm PitStop 2, 250 nm Torin 1, and 100 nm bafilomycin A1 singly or in combination. All combinations contained 0.175% DMSO as solvent. Right: DMSO, 80 μm Dynasore, 30 μm PitStop 2, and 100 nm bafilomycin A1 were added singly or in combination to RPMI1640 medium containing 10% Nu-Serum or to amino acid-free RPMI1640 medium containing 10% dialyzed Nu-Serum, and 293T cells were treated with the indicated medium for 4 h. All combinations contained 0.15% DMSO as solvent. B, 293T cells were treated as in A and subjected to immunofluorescence with anti-LC3 and anti-WIPI2 antibodies. Arrows indicate WIPI2 dots. Scale bar = 10 μm. C, quantification of immunofluorescence data in B. Each bar indicates mean ± S.D. of three independent experiments. *, p < 0.05; **, p < 0.01; ****, p < 0.0001.
Discussion
In this study, we found that dynamin-dependent endocytosis is required for mTORC1 activation after it is recruited to the lysosome. It is likely that, in a steady-state condition with extracellular amino acids, dynamin-dependent endocytosis maintains mTORC1 activity by constitutively transporting extracellular amino acids to the lysosomal lumen. This model is supported by multiple experiments that include overexpression of a dominant-negative form of dynamin and the treatment with two different endocytosis inhibitors (Dynasore and PitStop 2). Endocytosis inhibition also prevented mTORC1 reactivation induced by amino acid stimulation, suggesting that endocytosis is required for a quick response to sudden increases in extracellular amino acids (Fig. 3).
Because the inhibitory effect of Dynasore was cancelled by CHX, which increases cytoplasmic levels of amino acids, the depletion of intracellular amino acids appears to be the main mechanism of Dynasore-induced mTORC1 inactivation (Fig. 4). Moreover, the overexpression of Rheb or constitutively active Rag rescued the decreased activity of mTORC1 observed in Dynasore-treated cells (Fig. 5, A and B). In addition, constitutively active Rag rescued the decreased lysosomal localization of mTORC1 in Dynasore-treated cells (Fig. 5, C and D). These findings suggest that Dynasore prevented amino acid-dependent recruitment of mTORC1 to the lysosome by Rag and subsequent activation of mTORC1 by Rheb.
Our findings presented here are consistent with a previous study by Palm et al. (16), which suggested that in the presence of extracellular amino acids, macropinocytosis inhibition does not lead to mTORC1 inactivation. Therefore, in the presence of extracellular amino acids, there should be a mechanism other than macropinocytosis that effectively transports amino acids to the lysosomal lumen. On the other hand, it has been shown that cellular uptake of amino acids can be mediated by the amino acid transporters on the plasma membrane (19). Amino acids that enter the cytoplasm through the transporters will readily activate cytoplasmic amino acid sensors (19) that include Leucyl-tRNA synthetase (29), Sestrin2 (30), and CASTOR (31). The existence of these cytoplasmic sensors may explain why endocytosis inhibition has a milder effect than amino acid starvation and the mTOR inhibitor Torin 1 (Fig. 2). Nevertheless, our findings suggest that, in addition to the activation of these cytoplasmic sensors, dynamin-dependent endocytosis may play a critical role in the induction and maintenance of mTORC1 activity by effectively transporting extracellular amino acids to the lysosomal lumen.
The data shown here suggests that endocytosis inhibition specifically inactivates mTORC1 and does not affect mTORC2 (Figs. 1 and 2), which is known to regulate multiple pathways that include Akt-mediated pathways (4). In addition, the endocytosis inhibitors used in this study differ from mTORC1 inhibitors (e.g. rapamycin) and amino acid starvation, both of which are known to induce autophagy as a result of mTORC1 inhibition (3). In contrast to these conditions, the endocytosis inhibitors did not induce autophagy (Fig. 6). At first glance, it seemed counterintuitive that endocytosis-inhibited cells exhibited decreased autophagic activity even though mTORC1 was inactivated. However, previous studies have shown that dynamin- and clathrin-dependent endocytosis contribute to autophagy progression (26, 27), which may explain the reduced autophagy observed in endocytosis-inhibited cells.
In general, autophagy induced by starvation act as a compensatory mechanism by transporting a portion of the cytoplasm to lysosomes (32). Cytoplasmic proteins are digested by lysosomal hydrolases, which release amino acids that reactivate mTORC1 and other nutrients to support cell survival. This compensatory autophagy was suppressed in endocytosis-inhibited cells (Fig. 6). Furthermore, it has been shown that mTORC1 inhibition leads to enhanced lysosomal activity (33), and pharmacological inhibition of mTORC1 induces accelerated digestion of endocytosed proteins, thus supporting enhanced cell proliferation in amino acid-deprived conditions (16). In contrast to mTORC1 inhibitors, endocytosis inhibition suppresses this compensatory amino acid generation via digestion of endocytosed proteins even though mTORC1 is inactivated (supplemental Fig. S2). Therefore, endocytosis inhibition will result in a more thorough and sustained starvation of amino acids and other nutrients because it suppresses the utilization of extracellular nutrients and autophagy-dependent nutrient generation.
Because the suppression of mTORC1 is proposed to be a potential therapeutic method for preventing cancer (4, 34), our findings suggest that inhibition of endocytosis may be a reasonable approach for the treatment of cancer. Cancer cells must achieve sufficient energy production and biosynthesis to support their uncontrolled proliferation state (35). Consistently, cancer cells exhibit increased uptake of amino acids and glucose from the extracellular space compared with normal cells (36–38). In addition to cancer, mTORC1 has also been linked to aging because inhibition of mTORC1 by rapamycin increases the life span in yeasts, worms, flies, and mice (39). Aging is delayed by dietary restriction in many animal species (40), and mTORC1 suppression appears to be a critical factor to explain that phenomenon (39). Moderate endocytosis inhibition may provide a method for nutrient restriction at the cellular level.
In summary, this study revealed the mechanism by which endocytosis inhibition leads to mTORC1 inhibition effectively and sustainably. Dynamin-dependent endocytosis is required for the induction and maintenance of mTORC1 activity through the constitutive transport of extracellular amino acids to the lysosomal lumen. Finally, this study highlights dynamin-dependent endocytosis as a novel target for cancer and aging.
Experimental procedures
Antibodies and reagents
The following antibodies and reagents were used in this study. Rabbit anti-phospho-Akt (Thr308) (number 13038), rabbit anti-phospho-Akt (Ser473) (number 4060), rabbit anti-phospho-p70 S6 kinase (Thr389) (number 9234), rabbit anti-Akt (number 4691), rabbit anti-Dynamin I/II (number 2342), rabbit anti-GAPDH (number 5174), rabbit anti-mTOR (number 2983), rabbit anti-p70 S6 kinase (number 2708), and rabbit anti-Raptor (number 2280) were from Cell Signaling Technology. Rabbit anti-LC3 (PM036) was from MBL. Mouse anti-WIPI2 was from Merck Millipore (clone 2A2). Mouse anti-HA tag was from Covance (clone 16B12). Mouse anti-Lamp1 (sc-20011) was from Santa Cruz Biotechnology. Goat anti-rabbit IgG (H+L)-HRP was from Jackson ImmunoResearch. Goat anti-rabbit IgG (H+L)-Alexa 488 and goat anti-mouse IgG (H+L)-Alexa 568 were from Thermo Fisher. Cellmatrix type I-C was from Nitta Gelatin. DMEM, RPMI1640, CHX, and l-glutamine solution were from Wako. Amino acid-free RPMI1640 was from United States Biological. Dynasore and PitStop 2 were from Abcam. Torin 1 was from Tocris Bioscience. Bafilomycin A1 was from Adipogen. Nu-Serum growth medium supplement, Lipofectamine 2000, and DQTM Red-BSA were from Thermo Fisher. Cell counting kit-8: rabbit from Dojindo. Protease inhibitor mixture cOmplete and ×50 amino acid solution for RPMI1640 were from Sigma.
Cells
HEK293T (293T) cells were obtained from RIKEN, and maintained with DMEM containing 10% fetal bovine serum (FBS) and 1× streptomycin/penicillin in a CO2 incubator containing 5% CO2.
Immunoblotting
The 293T cells were plated in 12-well plates coated with collagen (Cellmatrix type I-C) at a density of 2 × 10⁵ cells/well in RPMI1640 containing 10% Nu-Serum. Nu-Serum was used instead of FBS because Dynasore is inhibited by albumin (41). After incubation in a CO2 incubator for 18–21 h, cells were treated as indicated in the figure legends. After incubating for the indicated time length, cells were washed with phosphate-buffered saline (PBS), lysed with cold lysis buffer (20 mm Tris-HCl (pH 7.5), 150 mm NaCl, 1 mm EDTA, 1 mm EGTA, 2.5 mm pyrophosphate, 1 mm β-glycerophosphate, 1 mm orthovanadate, 1% Triton X-100, and a protease inhibitor mixture (cOmplete)), centrifuged at 14,000 rpm for 10 min at 4 °C, and then the supernatants were mixed with sample buffer and boiled for 5 min. Samples were subjected to SDS-PAGE with 10 or 15% acrylamide gels and transferred to PVDF membranes. Membranes were treated with blocking buffer (Tris-buffered saline containing 0.1% Tween 20 and 2% skim milk). Proteins of interest were detected with specific primary and secondary antibodies using EzWestLumi plus (Atto) as the substrate. Images were taken with LAS 3000 luminescent imager (Fujifilm) or LuminoGraph I (Atto). The protein bands were quantified by CSAnalyzer4 software (version 2.2.4, Atto).
Plasmid transfection
The 293T cells were plated in 12-well plates coated with collagen at a density of 1 × 10⁵ cells/well in RPMI1640 containing 10% Nu-Serum. After incubation in a CO2 incubator for 18–21 h, cells were transfected with 1 μg of pcDNA3.1/HA-dynamin 2 K44A (a gift from Sandra Schmid, Addgene plasmid number 34685), 1 μg of pcDNA3.1(−) (Thermo Fisher Scientific), 0.25 μg of pRK5/HA-GST-RagB(99L) (Addgene plasmid number 19303), 0.25 μg of pRK5/HA-GST-RagC(75L) (Addgene plasmid number 19303), 0.5 μg of pRK5/HA-GST-Rheb1 (Addgene plasmid number 19310) (the RagB, RagC, and Rheb1 plasmids are gifts from David Sabatini), or 0.5 μg of pRK5/HA-GST (a stop codon was inserted at the end of GST of pRK5/HA-GST-Rheb1). Plasmid transfection was performed with Lipofectamine 2000 following the manufacturer's protocol.
Immunostaining
The 293T cells were plated onto coverslips coated with collagen (Cellmatrix Type I-C) in 6-well plates at a density of 3 × 10⁵ cells/well or in 12-well plates at 1 × 10⁵ cells/well in RPMI1640 containing 10% Nu-Serum. After incubation for 18–21 h in a CO2 incubator, cells were treated as indicated in the figure legends. Cells were washed with PBS, and fixed with 4% paraformaldehyde in PBS for 20 min at room temperature. Cells were then permeabilized with 0.05% Triton X-100 in PBS (for mTOR/Lamp1 staining) or with 50 μg/ml of digitonin (for LC3/WIPI2 staining) for 5 min at room temperature, blocked with 0.2% gelatin in PBS for longer than 30 min at room temperature, and then subjected to immunostaining with specific primary and secondary antibodies. Coverslips were mounted with Prolong Gold with DAPI (Thermo Fisher), and images were taken with the LSM 710 confocal microscope equipped with an Alpha Plan-Apo ×100/1.46 NA objective lens (Zeiss).
Quantification of mTOR-Lamp1 colocalization
Images of mTOR/Lamp1/DAPI immunostaining were randomly taken by finding cells under a microscope by observing only DAPI. Total cells, and cells that exhibit colocalization of mTOR and Lamp1, were counted by an observer blinded to the experimental condition. In addition, the same images were analyzed with Fiji/ImageJ software to quantify fluorescence intensity of mTOR colocalized with the lysosomes as follows. First, binary mask images for the cytoplasm, lysosomes, and nuclei were created from the mTOR, Lamp1, and DAPI images. Next, using the mask images, the original mTOR image was separated into cytoplasmic and lysosomal areas (nuclear area was eliminated from both areas). After calculating the average density of mTOR in the cytoplasmic or lysosomal areas by dividing the total fluorescence intensity of mTOR by the total pixels in the area, the amount of mTOR on the lysosomes was calculated by subtracting the cytoplasmic background from lysosomal mTOR ([mTOR density in the lysosomes] − [mTOR density in the cytoplasm]). At least 30 cells were analyzed for each sample.
Quantification of cells with mTOR dots in RagBGTP/RagCGDP-transfected cells
Images of mTOR/HA/DAPI immunostaining were examined to count cells with punctate patterns of mTOR. Only transfected (HA-positive) cells were counted, and at least 150 cells were analyzed for each sample.
DQ BSA assay
The 293T cells were plated onto coverslips in 6-well plates as described above (under “Immunostaining”). At 18–20 h after plating, cells were pre-treated for 30 min with Dynasore, PitStop 2, CHX, Baf A1, or a combination of the drugs as indicated in the figure legends. After the pretreatment, 1/100 volume of the 1 mg/ml of DQ Red-BSA (final concentration = 10 μg/ml) solution was added. Plates were incubated in a CO2 incubator for 4 h, and then cells were fixed with 4% paraformaldehyde in PBS for 20 min at room temperature. Coverslips were mounted with Prolong Gold with DAPI (Thermo Fisher), and images were taken with LSM 710 confocal microscope (Zeiss).
LC3-II turnover assay
LC3 in the cytoplasm (LC3-I, higher molecular weight) becomes covalently attached to autophagosome membranes (LC3-II, lower molecular weight), and LC3 attached to the inner autophagosome membrane will be degraded in lysosomes. Therefore, the lysosomal turnover of LC3-II ([LC3-II amount with Baf A1] − [LC3-II amount without Baf A1]) indicates the amount of autophagic structures that have been transported to the lysosomes during the time window of the treatment and was used as a readout of autophagic activity (42).
Statistical analyses
Statistical significance was analyzed using GraphPad Prism 7 (GraphPad Software) to run unpaired t tests (Figs. 1 and 5D) and one-way analysis of variance followed by Dunnett's test (Fig. 2) or by Tukey's test (Figs. 3, 4, 5B, and 6).
Author contributions
S. S. designed and conducted the experiments and wrote the manuscript. H. O. designed and conducted the experiments. H. I. designed the experiments and provided technical assistance. All authors reviewed the results and approved the final version of the manuscript.
Supplementary Material
Acknowledgment
We thank members in the Laboratory of Veterinary Hygiene for helpful discussions.
This work was supported by Japan Society for the Promotion of Science KAKENHI Grant 15K18530 and Funds for the Development of Human Resources in Science and Technology under MEXT through the Home for Innovative Researchers and Academic Knowledge Users (HIRAKU) consortium. The authors declare that they have no conflicts of interest with the contents of this article.
This article contains supplemental Figs. S1–S3.
- mTOR
- mechanistic target of rapamycin
- S6K
- S6 kinase
- V-ATPase
- vacuolar-type H+-ATPase
- CHX
- cycloheximide
- Baf A1
- bafilomycin A1.
References
- 1. Efeyan A., Comb W. C., and Sabatini D. M. (2015) Nutrient-sensing mechanisms and pathways. Nature 517, 302–310 [DOI] [PMC free article] [PubMed] [Google Scholar]
- 2. Zoncu R., Efeyan A., and Sabatini D. M. (2011) mTOR: from growth signal integration to cancer, diabetes and ageing. Nat. Rev. Mol. Cell. Biol. 12, 21–35 [DOI] [PMC free article] [PubMed] [Google Scholar]
- 3. Mizushima N., Yoshimori T., and Ohsumi Y. (2011) The role of atg proteins in autophagosome formation. Annu. Rev. Cell Dev. Biol. 27, 107–132 [DOI] [PubMed] [Google Scholar]
- 4. Laplante M., and Sabatini D. M. (2012) mTOR signaling in growth control and disease. Cell 149, 274–293 [DOI] [PMC free article] [PubMed] [Google Scholar]
- 5. Blommaart E. F., Luiken J. J., Blommaart P. J., van Woerkom G. M., and Meijer A. J. (1995) Phosphorylation of ribosomal protein S6 is inhibitory for autophagy in isolated rat hepatocytes. J. Biol. Chem. 270, 2320–2326 [DOI] [PubMed] [Google Scholar]
- 6. Hara K., Yonezawa K., Weng Q. P., Kozlowski M. T., Belham C., and Avruch J. (1998) Amino acid sufficiency and mTOR regulate p70 S6 kinase and eIF-4E BP1 through a common effector mechanism. J. Biol. Chem. 273, 14484–14494 [DOI] [PubMed] [Google Scholar]
- 7. Zoncu R., Bar-Peled L., Efeyan A., Wang S., Sancak Y., and Sabatini D. M. (2011) mTORC1 senses lysosomal amino acids through an inside-out mechanism that requires the vacuolar H+-ATPase. Science 334, 678–683 [DOI] [PMC free article] [PubMed] [Google Scholar]
- 8. Sancak Y., Bar-Peled L., Zoncu R., Markhard A. L., Nada S., and Sabatini D. M. (2010) Ragulator-Rag complex targets mTORC1 to the lysosomal surface and is necessary for its activation by amino acids. Cell 141, 290–303 [DOI] [PMC free article] [PubMed] [Google Scholar]
- 9. Bar-Peled L., Schweitzer L. D., Zoncu R., and Sabatini D. M. (2012) Ragulator is a GEF for the Rag GTPases that signal amino acid levels to mTORC1. Cell 150, 1196–1208 [DOI] [PMC free article] [PubMed] [Google Scholar]
- 10. Sancak Y., Peterson T. R., Shaul Y. D., Lindquist R. A., Thoreen C. C., Bar-Peled L., and Sabatini D. M. (2008) The Rag GTPases bind Raptor and mediate amino acid signaling to mTORC1. Science 320, 1496–1501 [DOI] [PMC free article] [PubMed] [Google Scholar]
- 11. Jewell J. L., Kim Y. C., Russell R. C., Yu F.-X., Park H. W., Plouffe S. W., Tagliabracci V. S., and Guan K.-L. (2015) Metabolism: differential regulation of mTORC1 by leucine and glutamine. Science 347, 194–198 [DOI] [PMC free article] [PubMed] [Google Scholar]
- 12. Flinn R. J., Yan Y., Goswami S., Parker P. J., and Backer J. M. (2010) The late endosome is essential for mTORC1 signaling. Mol. Biol. Cell 21, 833–841 [DOI] [PMC free article] [PubMed] [Google Scholar]
- 13. Li L., Kim E., Yuan H., Inoki K., Goraksha-Hicks P., Schiesher R. L., Neufeld T. P., and Guan K.-L. (2010) Regulation of mTORC1 by the Rab and Arf GTPases. J. Biol. Chem. 285, 19705–19709 [DOI] [PMC free article] [PubMed] [Google Scholar]
- 14. Bridges D., Fisher K., Zolov S. N., Xiong T., Inoki K., Weisman L. S., and Saltiel A. R. (2012) Rab5 proteins regulate activation and localization of target of rapamycin complex 1. J. Biol. Chem. 287, 20913–20921 [DOI] [PMC free article] [PubMed] [Google Scholar]
- 15. Chakrabarti A. C. (1994) Permeability of membranes to amino acids and modified amino acids: mechanisms involved in translocation. Amino Acids 6, 213–229 [PubMed] [Google Scholar]
- 16. Palm W., Park Y., Wright K., Pavlova N. N., Tuveson D. A., and Thompson C. B. (2015) The utilization of extracellular proteins as nutrients is suppressed by mTORC1. Cell 162, 259–270 [DOI] [PMC free article] [PubMed] [Google Scholar]
- 17. Yoshida S., Pacitto R., Yao Y., Inoki K., and Swanson J. A. (2015) Growth factor signaling to mTORC1 by amino acid-laden macropinosomes. J. Cell Biol. 211, 159–172 [DOI] [PMC free article] [PubMed] [Google Scholar]
- 18. Swanson J. A., and Watts C. (1995) Macropinocytosis. Trends Cell Biol. 5, 424–428 [DOI] [PubMed] [Google Scholar]
- 19. Goberdhan D. C., Wilson C., and Harris A. L. (2016) Amino acid sensing by mTORC1: intracellular transporters mark the spot. Cell Metab. 23, 580–589 [DOI] [PMC free article] [PubMed] [Google Scholar]
- 20. Nicklin P., Bergman P., Zhang B., Triantafellow E., Wang H., Nyfeler B., Yang H., Hild M., Kung C., Wilson C., Myer V. E., MacKeigan J. P., Porter J. A., Wang Y. K., Cantley L. C., Finan P. M., and Murphy L. O. (2009) Bidirectional transport of amino acids regulates mTOR and autophagy. Cell 136, 521–534 [DOI] [PMC free article] [PubMed] [Google Scholar]
- 21. Ferguson S. M., and De Camilli P. (2012) Dynamin, a membrane-remodelling GTPase. Nat. Rev. Mol. Cell Biol. 13, 75–88 [DOI] [PMC free article] [PubMed] [Google Scholar]
- 22. Hemmings B. A., and Restuccia D. F. (2012) PI3K-PKB/Akt pathway. Cold Spring Harb. Perspect. Biol. 4, a011189. [DOI] [PMC free article] [PubMed] [Google Scholar]
- 23. Macia E., Ehrlich M., Massol R., Boucrot E., Brunner C., and Kirchhausen T. (2006) Dynasore, a cell-permeable inhibitor of dynamin. Dev. Cell 10, 839–850 [DOI] [PubMed] [Google Scholar]
- 24. von Kleist L., Stahlschmidt W., Bulut H., Gromova K., Puchkov D., Robertson M. J., MacGregor K. A., Tomilin N., Tomlin N., Pechstein A., Chau N., Chircop M., Sakoff J., von Kries J. P., Saenger W., et al. (2011) Role of the clathrin terminal domain in regulating coated pit dynamics revealed by small molecule inhibition. Cell 146, 471–484 [DOI] [PubMed] [Google Scholar]
- 25. Thoreen C. C., Kang S. A., Chang J. W., Liu Q., Zhang J., Gao Y., Reichling L. J., Sim T., Sabatini D. M., and Gray N. S. (2009) An ATP-competitive mammalian target of rapamycin inhibitor reveals rapamycin-resistant functions of mTORC1. J. Biol. Chem. 284, 8023–8032 [DOI] [PMC free article] [PubMed] [Google Scholar]
- 26. Ravikumar B., Moreau K., Jahreiss L., Puri C., and Rubinsztein D. C. (2010) Plasma membrane contributes to the formation of pre-autophagosomal structures. Nat. Cell. Biol. 12, 747–757 [DOI] [PMC free article] [PubMed] [Google Scholar]
- 27. Moreau K., Ravikumar B., Renna M., Puri C., and Rubinsztein D. C. (2011) Autophagosome precursor maturation requires homotypic fusion. Cell 146, 303–317 [DOI] [PMC free article] [PubMed] [Google Scholar]
- 28. Wang S., Tsun Z.-Y., Wolfson R. L., Shen K., Wyant G. A., Plovanich M. E., Yuan E. D., Jones T. D., Chantranupong L., Comb W., Wang T., Bar-Peled L., Zoncu R., Straub C., Kim C., Park J., Sabatini B. L., and Sabatini D. M. (2015) Metabolism. Lysosomal amino acid transporter SLC38A9 signals arginine sufficiency to mTORC1. Science 347, 188–194 [DOI] [PMC free article] [PubMed] [Google Scholar]
- 29. Han J. M., Jeong S. J., Park M. C., Kim G., Kwon N. H., Kim H. K., Ha S. H., Ryu S. H., and Kim S. (2012) Leucyl-tRNA synthetase is an intracellular leucine sensor for the mTORC1-signaling pathway. Cell 10.1016/j.cell.2012.02.044 [DOI] [PubMed] [Google Scholar]
- 30. Wolfson R. L., Chantranupong L., Saxton R. A., Shen K., Scaria S. M., Cantor J. R., and Sabatini D. M. (2015) Sestrin2 is a leucine sensor for the mTORC1 pathway. Science 10.1126/science.aab2674 [DOI] [PMC free article] [PubMed] [Google Scholar]
- 31. Chantranupong L., Scaria S. M., Saxton R. A., Gygi M. P., Shen K., Wyant G. A., Wang T., Harper J. W., Gygi S. P., and Sabatini D. M. (2016) The CASTOR proteins are arginine sensors for the mTORC1 pathway. Cell 10.1016/j.cell.2016.02.035 [DOI] [PMC free article] [PubMed] [Google Scholar]
- 32. Yu L., McPhee C. K., Zheng L., Mardones G. A., Rong Y., Peng J., Mi N., Zhao Y., Liu Z., Wan F., Hailey D. W., Oorschot V., Klumperman J., Baehrecke E. H., and Lenardo M. J. (2010) Termination of autophagy and reformation of lysosomes regulated by mTOR. Nature 465, 942–946 [DOI] [PMC free article] [PubMed] [Google Scholar]
- 33. Zhou J., Tan S.-H., Nicolas V., Bauvy C., Yang N.-D., Zhang J., Xue Y., Codogno P., and Shen H.-M. (2013) Activation of lysosomal function in the course of autophagy via mTORC1 suppression and autophagosome-lysosome fusion. Cell Res. 23, 508–523 [DOI] [PMC free article] [PubMed] [Google Scholar]
- 34. Lamming D. W. (2016) Inhibition of the mechanistic target of rapamycin (mTOR)-rapamycin and beyond. Cold Spring Harb. Perspect. Med. 10.1101/cshperspect.a025924 [DOI] [PMC free article] [PubMed] [Google Scholar]
- 35. DeBerardinis R. J., Lum J. J., Hatzivassiliou G., and Thompson C. B. (2008) The biology of cancer: metabolic reprogramming fuels cell growth and proliferation. Cell Metab. 7, 11–20 [DOI] [PubMed] [Google Scholar]
- 36. Dimitrakopoulou-Strauss A., and Strauss L. G. (2003) PET imaging of prostate cancer with 11C-acetate. J. Nucl. Med. 44, 556–558 [PubMed] [Google Scholar]
- 37. Groves A. M., Win T., Haim S. B., and Ell P. J. (2007) Non-[18F]FDG PET in clinical oncology. Lancet Oncol. 8, 822–830 [DOI] [PubMed] [Google Scholar]
- 38. Vander Heiden M. G. (2011) Targeting cancer metabolism: a therapeutic window opens. Nat. Rev. Drug Discov. 10, 671–684 [DOI] [PubMed] [Google Scholar]
- 39. Lamming D. W., Ye L., Sabatini D. M., and Baur J. A. (2013) Rapalogs and mTOR inhibitors as anti-aging therapeutics. J. Clin. Invest. 123, 980–989 [DOI] [PMC free article] [PubMed] [Google Scholar]
- 40. Fontana L., and Partridge L. (2015) Promoting health and longevity through diet: from model organisms to humans. Cell 161, 106–118 [DOI] [PMC free article] [PubMed] [Google Scholar]
- 41. Kirchhausen T., Macia E., and Pelish H. E. (2008) Use of Dynasore, the small molecule inhibitor of dynamin, in the regulation of endocytosis. Methods Enzymol. 438, 77–93 [DOI] [PMC free article] [PubMed] [Google Scholar]
- 42. Tanida I., Minematsu-Ikeguchi N., Ueno T., and Kominami E. (2005) Lysosomal turnover, but not a cellular level, of endogenous LC3 is a marker for autophagy. Autophagy 1, 84–91 [DOI] [PubMed] [Google Scholar]
Associated Data
This section collects any data citations, data availability statements, or supplementary materials included in this article.