Abstract
Single-subunit RNA polymerases (RNAPs) are present in phage T7 and in mitochondria of all eukaryotes. This RNAP class plays important roles in biotechnology and cellular energy production, but we know little about its fidelity and error rates. Herein, we report the error rates of three single-subunit RNAPs measured from the catalytic efficiencies of correct and all possible incorrect nucleotides. The average error rates of T7 RNAP (2 × 10⁻⁶), yeast mitochondrial Rpo41 (6 × 10⁻⁶), and human mitochondrial POLRMT (RNA polymerase mitochondrial) (2 × 10⁻⁵) indicate high accuracy/fidelity of RNA synthesis resembling those of replicative DNA polymerases. All three RNAPs exhibit a distinctly high propensity for GTP misincorporation opposite dT, predicting frequent A→G errors in RNA with rates of ∼10−4. The A→C, G→A, A→U, C→U, G→U, U→C, and U→G errors mostly due to pyrimidine–purine mismatches were relatively frequent (10−5–10−6), whereas C→G, U→A, G→C, and C→A errors from purine–purine and pyrimidine–pyrimidine mismatches were rare (10−7–10−10). POLRMT also shows a high C→A error rate on 8-oxo-dG templates (∼10−4). Strikingly, POLRMT shows a high mutagenic bypass rate, which is exacerbated by TEFM (transcription elongation factor mitochondrial). The lifetime of POLRMT on terminally mismatched elongation substrate is increased in the presence of TEFM, which allows POLRMT to efficiently bypass the error and continue with transcription. This investigation of nucleotide selectivity on normal and oxidatively damaged DNA by three single-subunit RNAPs provides the basic information to understand the error rates in mitochondria and, in the case of T7 RNAP, to assess the quality of in vitro transcribed RNAs.
Keywords: 8-oxoguanine (8-oxoG), mitochondrial DNA (mtDNA), RNA, RNA polymerase, transcription, fidelity
Introduction
Transcription errors are made frequently during the enzymatic synthesis of RNA by DNA-dependent RNA polymerases, and such errors can have serious consequences to the cell (1–3). For example, the intrinsic error rates of multisubunit RNAPs,2 such as Escherichia coli RNAP and nuclear Pol II, are high and estimated to be around 10−3–10−4 (4–6). Mutations in RNA can affect numerous post-transcriptional processes, including RNA processing and translation. Moreover, one mRNA molecule is translated multiple times; hence, aberrant RNAs can produce multiple copies of aberrant proteins. Mitochondria produce polycistronic RNAs that are extensively processed to generate tRNAs, rRNAs, and mRNAs, and transcription errors can alter these RNA-processing reactions to affect protein levels. Damaged DNA, including oxidized bases that are frequently found in the mitochondrial DNA, also affects transcription and error rates (7–10). Additionally, misincorporation can cause pausing or stalling of transcriptional complexes, which are major hurdles to active transcription and replication, resulting in genome instability (11, 12). Understanding the fidelity and mechanism of posterror processes of RNAPs is critically important.
Single-subunit RNAPs represent a distinct class of enzymes found in phage T7 and in the mitochondria of all eukaryotes. T7 RNAP is the simplest enzyme in this class that can processively transcribe the DNA without requiring any accessory factors (13–15). Mitochondrial RNAPs are related to T7 RNAP (16–18), but they depend on accessory factors for transcription initiation (19–24). For example, the human POLRMT requires TFAM and TFB2M (25, 26) for promoter opening, and the yeast Rpo41 requires Mtf1 (27, 28). T7 RNAP is widely used in in vitro transcription reactions for RNA synthesis, and mitochondrial RNAPs play a key role in cellular energy production. It is estimated that the mitochondrial transcripts comprise 10–30% of the total RNA in energy-demanding tissues, including heart, kidney, and brain (29). Consequently, errors in transcription can contribute to mitochondrial dysfunctions. Despite their importance, our understanding of the fidelity of RNA synthesis by T7 and mitochondrial RNAPs is largely incomplete.
Previous in vitro studies of transcription error measurements of T7 RNAP were carried out with promoter-initiated paused elongation complexes, which provided average error rates of 10−3–10−6 depending on the base misincorporated (30). Because of the many constraints in studying transcription elongation starting from the promoter sequence, we chose to use a promoter-free elongation substrate that allows one to bypass the nonprocessive stages of initiation and study the fidelity of RNA synthesis only in the elongation phase. Promoter-free elongation substrates with 9-bp RNA-DNA hybrid in a DNA bubble are excellent substrates of both single- and multisubunit RNAPs (18, 31, 32). Furthermore, promoter-free elongation substrates have been used to dissect the kinetic pathway of T7 RNAP and POLRMT during transcription elongation (33–35).
In this study, we have measured the transcriptional fidelity of the human mitochondrial POLRMT, yeast (Saccharomyces cerevisiae) mitochondrial Rpo41, and phage T7 RNAP by measuring the single-nucleotide incorporation rate constant (kpol), the nucleotide dissociation constant (nucleotide triphosphate (NTP) Kd), and the catalytic efficiency (kpol/Kd) of correct and all 12 incorrect nucleotides. The nucleotide selectivity defined as the kpol/Kd of incorrect nucleotide incorporation divided by the kpol/Kd of correct nucleotide incorporation estimates the transcription error rates. The error rates predict the types of expected base changes in the transcribed RNA, and their measurements provide basic information to compare the error rates of single-subunit RNAPs, multisubunit RNAPs, and replicative DNA polymerases. Additionally, a detailed study of POLRMT was carried out to investigate posterror processes, such as mutagenic bypass, translesion bypass on oxidatively damaged 8-oxo-dG template, and the propensity of POLRMT to form paused transcription complexes on oxidized and misincorporated templates.
Results
Equilibrium dissociation constant Kd and off-rate of POLRMT from the elongation substrate
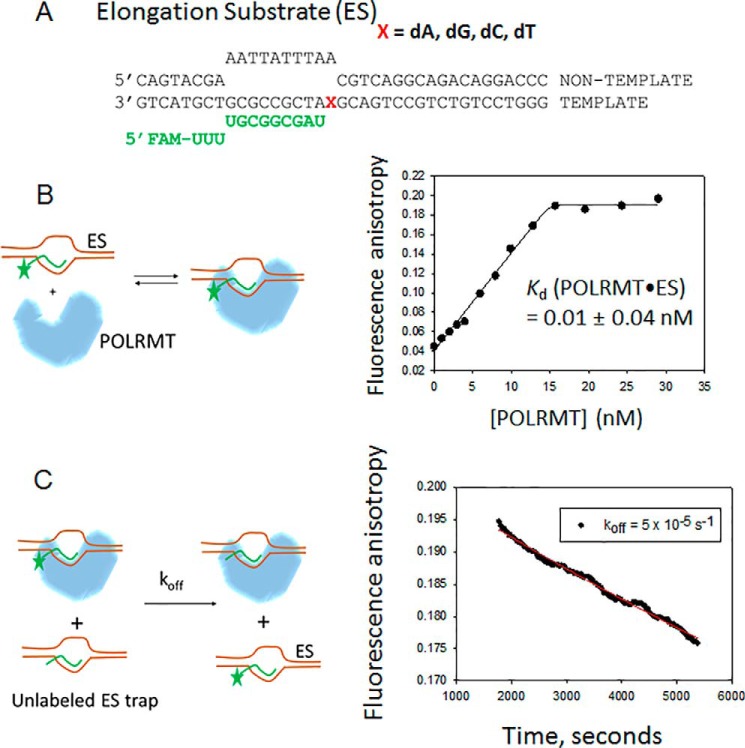
Elongation substrates were prepared by annealing a 12-mer RNA (5′-end fluorescein) to a complementary DNA template to generate 9-bp RNA-DNA hybrid and a 3-nucleotide overhang at the 5′-end of the RNA. This RNA-DNA hybrid was annealed to a partially complementary non-template DNA strand to make the elongation bubble substrate (ES) (Fig. 1A). Four such ES substrates were prepared with different +1 templating bases, X (dA, dG, dC, or dT), which enabled us to measure the rates of correct and incorrect nucleotide incorporations. The elongation substrates are abbreviated as dX-ES where +1 X represents the templating base. To measure the fidelity of transcription, we measured the incorporation rates of correct and incorrect nucleotides. It was important to use the same set of ES substrates to compare the fidelities of the three single-subunit RNAPs because the individual misincorporation efficiencies can depend on the local sequence around the templating base. Correct nucleotide addition kinetics of T7 RNAP have been studied previously (33, 34, 36); hence, the following sections focus on measuring the kinetics of correct nucleotide by the mitochondrial RNAPs, in particular the POLRMT.
Figure 1.
The Kd and koff of POLRMT complexed with the elongation substrate. A, the structure and sequence of the ES is shown. The RNA is shown in green. X represents the templating base, which is dA, dG, dC, or dT. FAM, 6-carboxyfluorescein. B, the left panel shows the experimental design that measures the equilibrium Kd of the POLRMT-ES complex. The fluorescein-labeled ES (10 nm) is titrated with increasing concentrations of POLRMT at 25 °C, and the increase in fluorescence anisotropy is measured at each concentration of added POLRMT. The resulting data in the right panel are fitted to the quadratic equation to obtain the Kd value shown. C, the left panel shows the experimental design that measured the off-rate (koff) of the fluorescein-labeled ES from the POLRMT. A complex of fluorescein-labeled ES (10 nm) and POLRMT (40 nm) is chased with unlabeled ES (400 nm), and the decrease in fluorescence anisotropy due to fluorescein-labeled ES dissociating from the POLRMT is measured as a function of time after addition of the chase. The kinetics in the right panel are fitted to a single exponential equation to obtain the off-rate (koff) of 5 ± 1.8 × 10⁻⁵ s−1. The experiments were carried out two times, and representative data are shown.
First, we measured the affinity of POLRMT for the ES using equilibrium DNA binding and kinetic off-rate experiments. To determine the equilibrium dissociation constant (Kd) of the ES-POLRMT complex, 10 nm fluorescein-labeled dT-ES was titrated with increasing concentrations of POLRMT (Fig. 1B). We observed stoichiometric binding of POLRMT to ES (Fig. 1B). The data were fit to the quadratic equation (37) to assess the 10 pm Kd of the ES-POLRMT complex. Because of the stoichiometric nature of the binding curve, this value is an upper limit of the true Kd value, and it indicates that POLRMT forms an extremely high-affinity complex with the elongation substrate.
To measure the off-rate of POLRMT from the elongation complex, a preformed fluorescent ES-POLRMT complex was chased with an excess of unlabeled ES. Dissociation of the fluorescent complex was measured through the time-dependent decrease in fluorescence anisotropy (Fig. 1C). Consistent with its high affinity, the ES-POLRMT complex dissociated with a slow rate constant of 5 × 10⁻⁵ s−1, which indicates a life-time (1/off-rate) of 5.5 h. This off-rate is about 30 times slower than the reported off-rate of POLRMT (35) from a study wherein an RNA-DNA hybrid substrate lacking the downstream and upstream duplex DNA regions was used. This indicates that the upstream and downstream duplex regions in the ES stabilize POLRMT binding.
Overall, our results show that POLRMT forms both a high-affinity and a long-lived complex on the promoter-free elongation substrate. Thus, ES is an excellent substrate to estimate the correct and incorrect nucleotide incorporation rates.
Single-turnover kinetics of correct nucleotide incorporation by POLRMT and Rpo41
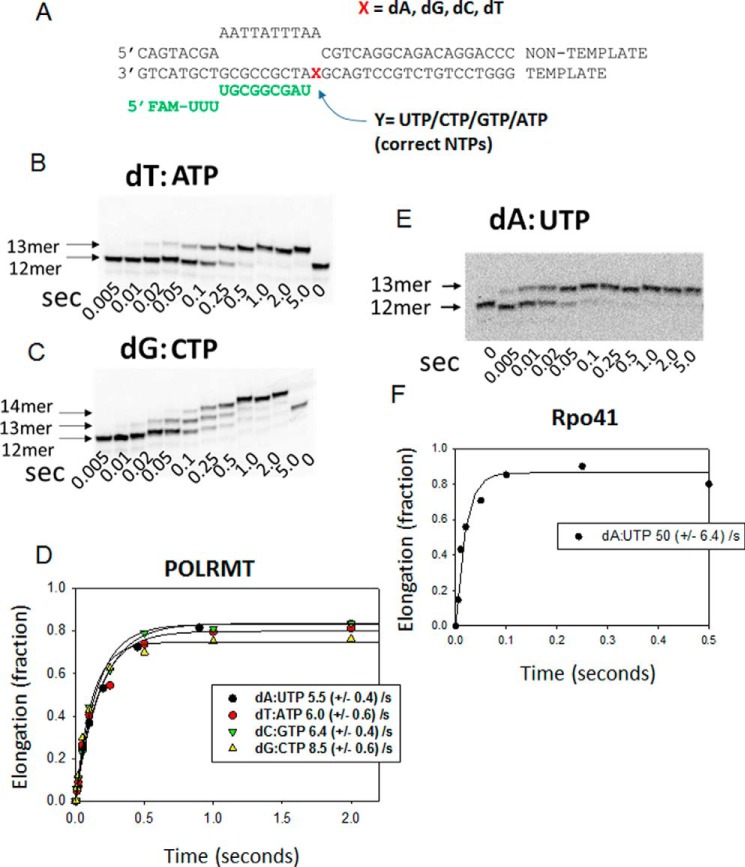
Correct nucleotide incorporation rates of POLRMT were measured under single-turnover kinetic conditions. A mixture of 400 nm POLRMT and 200 nm ES was incubated with a given concentration of the +1 NTP at 25 °C in a rapid quench-flow instrument. An excess of POLRMT ensured single-turnover kinetic conditions for elongation rate measurements. Briefly, the reactants were mixed and quenched within 5 ms to 5 s, and the RNAs were resolved on a 24% polyacrylamide/urea sequencing gel and quantified after image analysis. POLRMT elongates the 12-mer RNA of the dT-ES to 13-mer within milliseconds after ATP addition (Fig. 2, A and B). On the dG-ES, POLRMT adds two CTPs due to the presence of two consecutive +1 and +2 dG and elongates the 12-mer to 13-mer and then to 14-mer (Fig. 2C). The kinetics of 13-mer and 13 + 14-mer generation were fit to a single exponential equation to obtain the correct nucleotide incorporation rate constants (Fig. 2D). Similar experiments were carried out with the dA-ES and dC-ES substrates. The results show that POLRMT adds the correct nucleotide with rate constants between 5 and 8 s−1 at 50 μm NTP.
Figure 2.
Correct nucleotide incorporation kinetics of POLRMT on the elongation substrates. A, the ES with all possible templating bases is shown. FAM, 6-carboxyfluorescein. B, the gel image shows the time course of 12-mer RNA elongation to 13-mer in a POLRMT (400 nm) reaction of dT-ES (200 nm) with 50 μm ATP. The kinetics were measured in a rapid chemical quench-flow instrument at 25 °C, and reaction times ranged from 5 ms to 5 s. C, the gel image shows the kinetics of 12-mer elongation to 13-mer and 14-mer through consecutive addition of two CTPs to the dG-ES. D, the single-turnover kinetics of all single correct nucleotide addition by POLRMT fitted to a single exponential equation to obtain the indicated rate constants shown. The experiments were performed twice, and the errors represent the standard errors of fitting. The gel image in E shows the elongation of 12-mer to 13-mer by the yeast Rpo41 (400 nm) on the dA-ES (200 nm), and F shows the quantitation fit to a single exponential equation to obtain the indicated single-turnover rate of correct nucleotide addition by Rpo41. The experiments were performed once, and the errors represent the standard errors of fitting. A similar set of experiments was carried out with a Cy5 fluorophore-labeled ES with similar results.
Similar experiments show that Rpo41 adds the correct nucleotide with a rate constant of 50 s−1 (Fig. 2, E and F) at 50 μm NTP. This indicates that the yeast Rpo41 is 6–10 times faster than the human POLRMT.
To determine the NTP Kd and kpol, single-turnover kinetics of UTP addition across dA were measured at increasing UTP concentrations (1–250 μm) using the dA-ES (Fig. 3A). The time courses were fit to a single exponential equation, and the rate constants were plotted against [UTP] and fit to a hyperbola to obtain POLRMT kpol of 12 s−1 and UTP Kd of 60 μm (Fig. 3B). The catalytic efficiency (kpol/Kd) of correct nucleotide incorporation by POLRMT is ∼2 × 10⁵ m−1 s−1.
Figure 3.
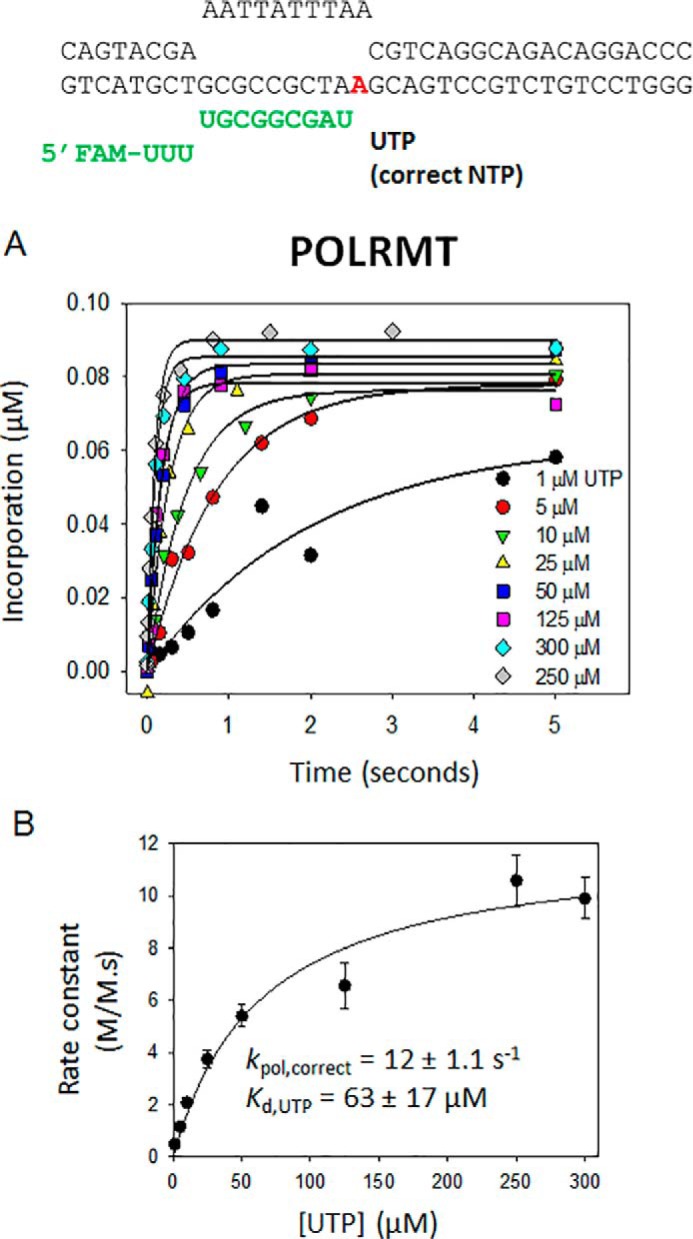
The kpol and Kd values of correct nucleotide incorporation by POLRMT. A, single-turnover kinetics of UTP incorporation into 100 nm dA-ES by 200 nm POLRMT. The single-turnover kinetics were measured at increasing concentrations of UTP at 25 °C in a rapid chemical quench-flow instrument, and the data were fit to a single exponential equation to obtain the rate constants. FAM, 6-carboxyfluorescein. B, the rate constants from A are plotted against [UTP], and the dependence was fit to a hyperbola to obtain the indicated kpol and Kd of correct UTP incorporation by POLRMT. The errors are standard errors of fitting. The experiment was carried out twice and representative data are shown. Error bars represent S.E.
Having measured the kpol and NTP Kd of POLRMT, we can now compare the elongation kinetics of POLRMT with that of T7 RNAP. The NTP Kd of POLRMT (60 μm) measured here resembles the reported NTP Kd of T7 RNAP (80 μm); hence the two RNAPs have similar binding affinities for the correct nucleotide. However, the kpol of T7 RNAP is 18 times faster than that of POLRMT (kpol of POLRMT is 12 s−1, and kpol of T7 RNAP is ∼220 s−1) (33, 34). We can also compare the elongation efficiency of POLRMT (2 × 10⁵ m−1 s−1), T7 RNAP (∼2 × 10⁶ m−1 s−1), and Rpo41 (1 × 10⁶ m−1 s−1). The kpol/Kd of Rpo41 was estimated from the correct nucleotide incorporation rate constant and NTP concentration from Fig. 2F (50 s−1/50 μm). This comparison shows that the elongation efficiency of T7 RNAP is 10 times higher and of Rpo41 is about 5 times higher than that of POLRMT.
Incorrect nucleotide incorporation by POLRMT
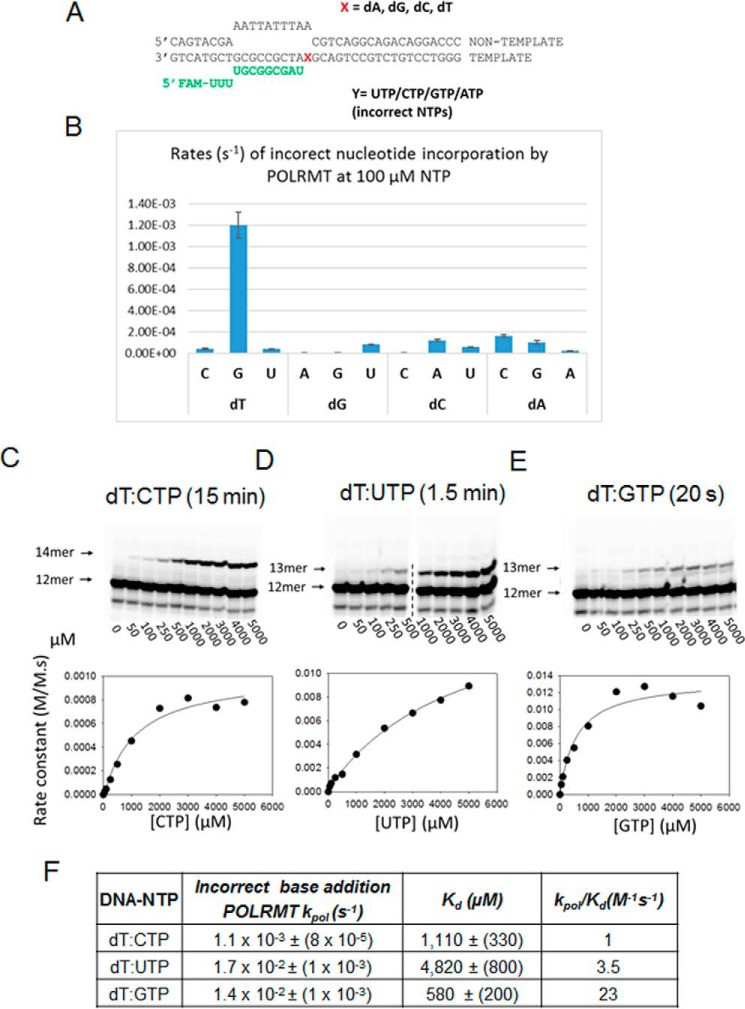
The error frequency is best estimated from the nucleotide selectivity, which is the ratio of the kpol/Kd of incorrect and correct nucleotides. As expected, each incorrect nucleotide is added by the POLRMT with a different rate (Fig. 4, A and B). Therefore, the misincorporation rates were used as a guide to identify a time of reaction to carry out the [NTP] dependence of the misincorporation reaction to obtain the kpol and Kd values. For example, because of the fast rates of GTP misincorporation across dT, this reaction was monitored for 20 s, whereas CTP addition across dT was slow and monitored for 15 min. In these measurements, we made sure that, under no conditions, more than 20–30% of the RNA was extended to products, assuring initial rate conditions. The misincorporation rates versus [NTP] plots were fit to a hyperbola (Equation 2) to obtain the misincorporation kpol and incorrect NTP Kd values. If the misincorporation rates did not become saturated at the highest [NTP] used, then the initial slope estimated the catalytic efficiency kpol/Kd of misincorporation.
Figure 4.
Incorrect nucleotide incorporation kinetics of POLRMT and the rates of misincorporations across the dT templating base. A, the elongation substrate is shown. FAM, 6-carboxyfluorescein. B, the rates of all possible incorrect nucleotide incorporation reactions were measured using 500 nm ES, 1 μm POLRMT, and 100 μm NTP. Error bars represent S.E. C, the gel image shows CTP misincorporation after 15-min reaction of POLRMT with various concentrations of CTP. The band below the 12-mer is shorter RNA that remained constant in all our reactions. Reactions contained 400 nm POLRMT, 1600 nm dT-ES, and the indicated concentrations of CTP. The dT:CTP misincorporation rate constants plotted against [CTP] were fit to a hyperbola to obtain the kpol and Kd kinetic parameters listed in F. D and E show misincorporation of UTP and GTP, respectively, across dT. F, the table lists the kpol, Kd and kpol/Kd values of all possible misincorporations across dT by the POLRMT.
The first templating nucleotide in the dT-ES is dT, and +2 is dG (Fig. 1A). In the presence of CTP alone, POLRMT misincorporates CTP across +1 dT and then adds another CTP across the +2 dG, elongating the 12-mer RNA to 14-mer (Fig. 4C). No intermediate 13-mer was observed, which indicates a fast mutagenic bypass rate (studied in more detail in later sections below). The hyperbolic fit of the misincorporation rates versus [CTP] provided a dT:CTP misincorporation kpol of 1.1 × 10⁻³ s−1 and CTP Kd of 1110 μm (Fig. 4F). This indicates that, relative to correct nucleotide, the incorrect CTP binds across dT with a ∼20-fold weaker affinity but incorporated at an ∼10,000 times slower rate. Thus, the nucleotide selectivity of POLRMT for CTP versus ATP across dT is 5 × 10⁻⁶, which means that this misincorporation will occur once in 2 × 10⁵ correct addition reactions. The dT:CTP misincorporation results in the A→C base change in the RNA; hence the A→C error rate is 5 × 10⁻⁶.
Similar experiments and analyses were carried out to assess the dT:UTP and dT:GTP misincorporation rates on the dT-ES. POLRMT misincorporates UTP across dT with a kpol of 1.7 × 10⁻² s−1 and UTP Kd of 4820 μm (Fig. 4, D and F). Misincorporation of GTP across dT was very efficient with a kpol of 1.4 × 10⁻² s−1 and GTP Kd of 580 μm (Fig. 4, E and F). These kinetic parameters indicate that the A→G error rate is 1 × 10⁻⁴ and the A→U error rate is 2 × 10⁻⁵ (Table 1).
Table 1.
Nucleotide selectivity of POLRMT
ND, not determined.
| DNA-NTP | POLRMT kpol | Kd | kpol/Kd | Transcription error rate (kpol/Kd)incorrect, NTP/(kpol/Kd)correct, NTP |
|---|---|---|---|---|
| s−1 | μm | m−1 s−1 | ||
| dA:UTP | 12 ± 1.1 | 63 ± 17 | 1.9 × 10⁵ ± 1.8 × 10⁴ | 1 |
| dA:ATP | ND | ND | 0.006 ± 0.001 | 3.2 × 10⁻⁸ |
| dA:CTP | ND | ND | 2.7 ± 0.06 | 1.4 × 10⁻⁵ |
| dA:GTP | 4.6 ± 0.4 × 10⁻³ | 1230 ± 350 | 3.7 ± 1 | 2.1 × 10⁻⁵ |
| dT:UTP | 1.7 ± 0.1 × 10⁻² | 4,820 ± 800 | 3.5 ± 0.6 | 1.8 × 10⁻⁵ |
| dT:GTP | 1.4 ± 0.1 × 10⁻² | 580 ± 200 | 24 ± 8 | 1.3 × 10⁻⁴ |
| dT:CTP | 1.1 ± 0.08 × 10⁻³ | 1110 ± 330 | 1 ± 0.3 | 5.2 × 10⁻⁶ |
| dC:CTP | ND | ND | 1 × 10⁻³ ± 1 × 10⁻⁴ | 5 × 10⁻⁹ |
| dC:ATP | 3 ± 0.3 × 10⁻³ | 600 ± 240 | 5 ± 2 | 2.6 × 10⁻⁵ |
| dC:UTP | 4 ± 0.2 × 10⁻⁴ | 630 ± 120 | 0.6 ± 0.1 | 3.2 × 10⁻⁶ |
| dG:UTP | 3 ± 0.4 × 10⁻⁴ | 560 ± 310 | 0.54 ± 0.3 | 2.8 × 10⁻⁶ |
| dG:ATP | ND | ND | 0.001 ± 1 × 10⁻⁴ | 5.2 × 10⁻⁹ |
| dG:GTP | 3.5 ± 0.4 × 10⁻⁵ | 1100 ± 500 | 0.03 ± 0.01 | 1.6 × 10⁻⁷ |
| 8-Oxo-dG:ATP | 1.5 ± 0.08 × 10⁻² | 180 ± 40 | 83 ± 19 | 4.3 × 10⁻⁴ |
| 8-Oxo-dG:CTP | 9 ± 0.3 × 10⁻⁴ | 692 ± 98 | 1.3 | 6.8 × 10⁻⁶ |
Next, we used the dA-ES to measure the dA:ATP, dA:GTP, and dA:CTP misincorporation rates. POLRMT misincorporated ATP across dA with a very slow rate, which did not become saturated even at 5 mm ATP (Fig. 5A). Thus, we could assess only the kpol/Kd of dA:A misincorporation as 0.006 m−1 s−1 (Fig. 5, A and E), indicating that the U→A error rate is very low (∼10−8) (Table 1). The dA-ES contains +1 dA, +2 dG, and +3 dC, and when GTP was added, the 12-mer was converted to 14-mer (Fig. 5B), which was unexpected. The only way to explain this result is template misalignment where +3 dC acts as a templating base for the second misincorporation event. Such template misalignment has been reported for T7 RNAP (38). The dA:GTP misincorporation occurred with a kpol/Kd of 2.7 m−1 s−1 (Fig. 5, B and E), providing the U→G error rate of 2 × 10⁻⁵.
Figure 5.
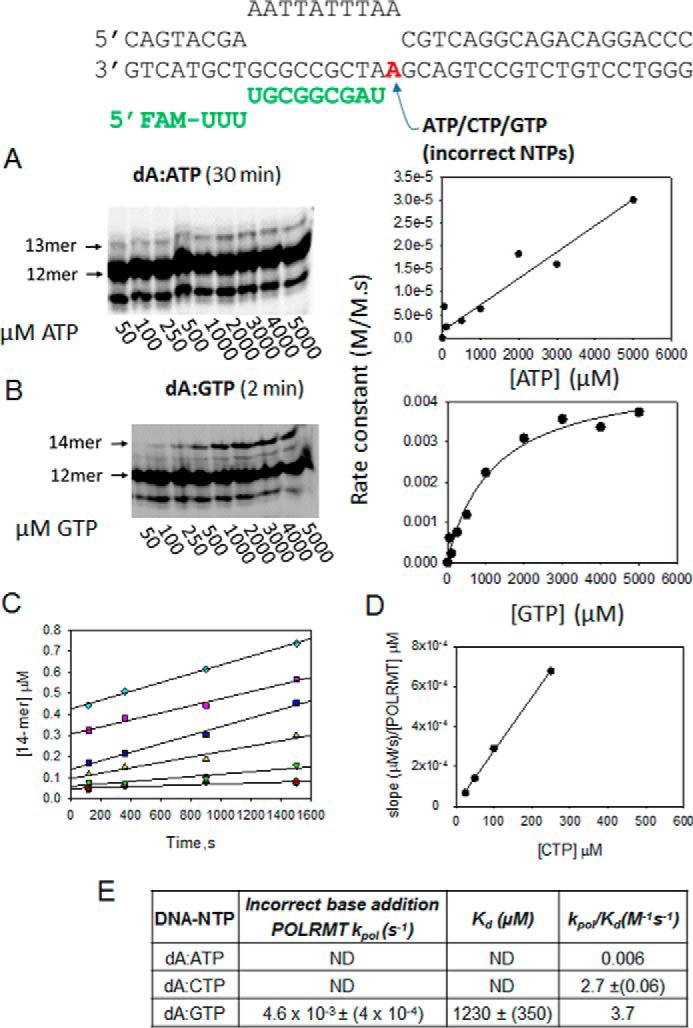
The POLRMT misincorporation rates across the dA templating base. A, the gel image shows the dA:ATP misincorporation with increasing [ATP]. The reaction conditions are the same as in Fig. 4C. The dA:ATP misincorporation rates plotted against [ATP] were fit to a line, and the slope provided the kpol/Kd listed in E. FAM, 6-carboxyfluorescein. B shows dA:G misincorporation by POLRMT at increasing [GTP]. The data were fit to a hyperbola to determine the kpol and Kd kinetic parameters. C, the time course of CTP incorporation on the dA-ES by POLRMT at various [CTP] (25, 50, 100, 250, 500, and 1000 μm). D, the slopes from C were plotted against [CTP] to obtain the kpol/Kd of dA:C misincorporation. E, the table lists the kpol, Kd, and kpol/Kd of all possible misincorporations across dA by POLRMT. ND, not determined.
Misincorporation of CTP across dA was initially assessed to be fast; however, we suspected UTP contamination in the CTP sample, which was confirmed by the biphasic time course of misincorporation (Fig. 5C). We purchased the highest quality CTP and used it fresh, but CTP is known to spontaneously deaminate into UTP. The correct UTP will be added across dA with a fast rate, and the incorrect CTP will be added with a slow rate. Such biphasic kinetics were indeed observed, and as expected the fast-phase amplitude increased linearly with increasing CTP concentration (Fig. 5D). From the amplitude, we could estimate that the CTP sample contained about 0.03% UTP, which although low is sufficient to result in a substantial amount of RNA extension especially at high CTP concentrations. The slow-phase rates provided a kpol/Kd of 3.9 m−1 s−1 for dA:CTP misincorporation (Fig. 5, D and E), predicting the U→C error rate of 1 × 10⁻⁵ (Table 1). Similar experiments and analyses were carried out with the dC-ES and dG-ES substrates to ultimately estimate all 12 misincorporation and error rates of the POLRMT (Figs. 6 and 7 and Table 1).
Figure 6.
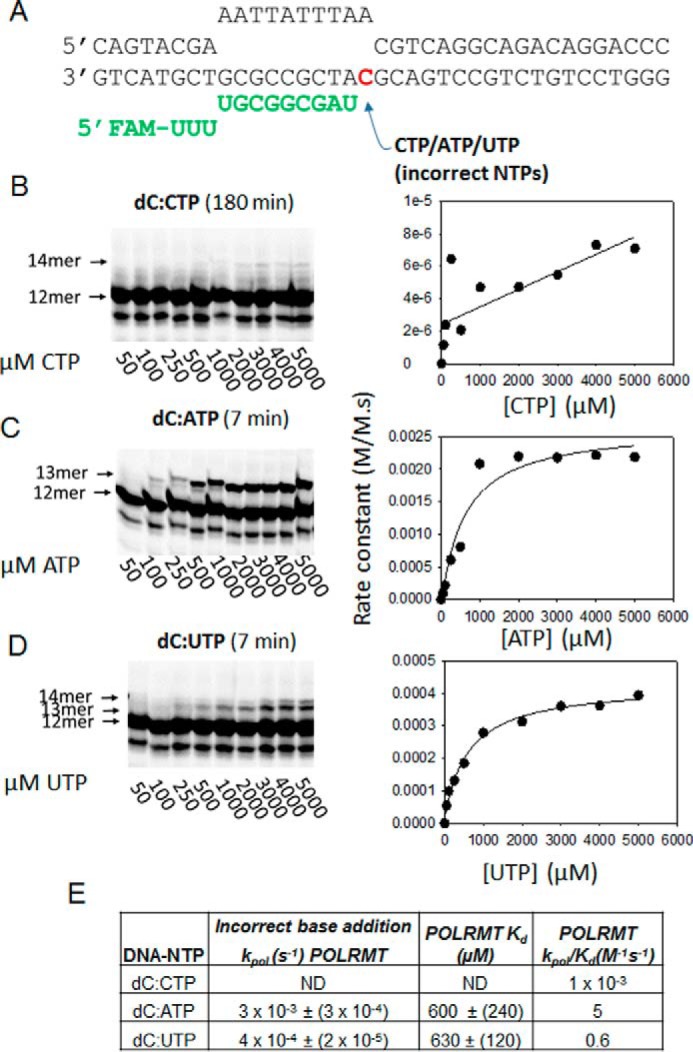
The POLRMT misincorporation rates across the dC templating base. A, the dC-ES is shown. FAM, 6-carboxyfluorescein. B, C, and D show the gel images of dC:C, dC:A, and dC:U misincorporations, respectively, across the dC templating base by POLRMT at increasing concentrations of the NTP. In B, very little product is observed. In D, formation of the 14-mer due to dG:U mismatch is observed at higher UTP concentrations. The data were fit to a line to obtain the kpol, Kd, and kpol/Kd parameters shown in E. ND, not determined.
Figure 7.
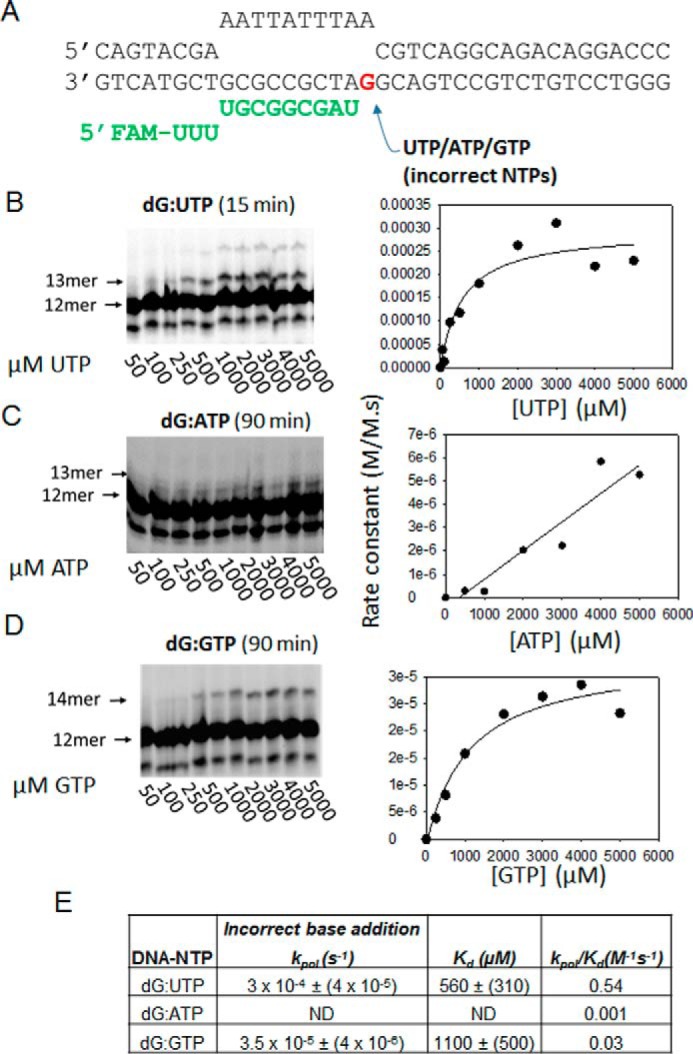
The POLRMT misincorporation rates across the dG templating base. A, the dG-ES is shown. FAM, 6-carboxyfluorescein. B, C, and D show the gel images of dG:U, dG:A, and dG:G misincorporations, respectively, across the dG templating base by POLRMT at increasing concentrations of the NTP. The data were fit to a line to obtain the kpol, Kd, and kpol/Kd parameters shown in E. ND, not determined.
Summary of the transcription errors of the human POLRMT
The complete data set of misincorporations indicates that POLRMT discriminates against the incorrect NTP both at the NTP binding and the chemical steps. On average, the incorrect NTPs bind with a ∼20-fold weaker affinity and are incorporated at ∼2000-fold slower rates relative to the correct NTPs (Table 1). We found that the efficiency of GTP addition across dT is uniquely high (Fig. 8), which predicts a high A→G error rate of 10−4. The error rates of other purine–pyrimidine mismatches (∼4 × 10⁻⁵) are about 7 times higher than the error rates of purine–purine and pyrimidine–pyrimidine mismatches (6 × 10⁻⁶). Specifically, the G→A, U→G, A→U, U→C, A→C, G→U, and C→U errors are more frequent(10−5–10−6), and C→G, U→A, C→A, and G→C errors are rare (10−7 and 10−9). In sum, the average transcription error rate of POLRMT is 2 × 10⁻⁵.
Figure 8.
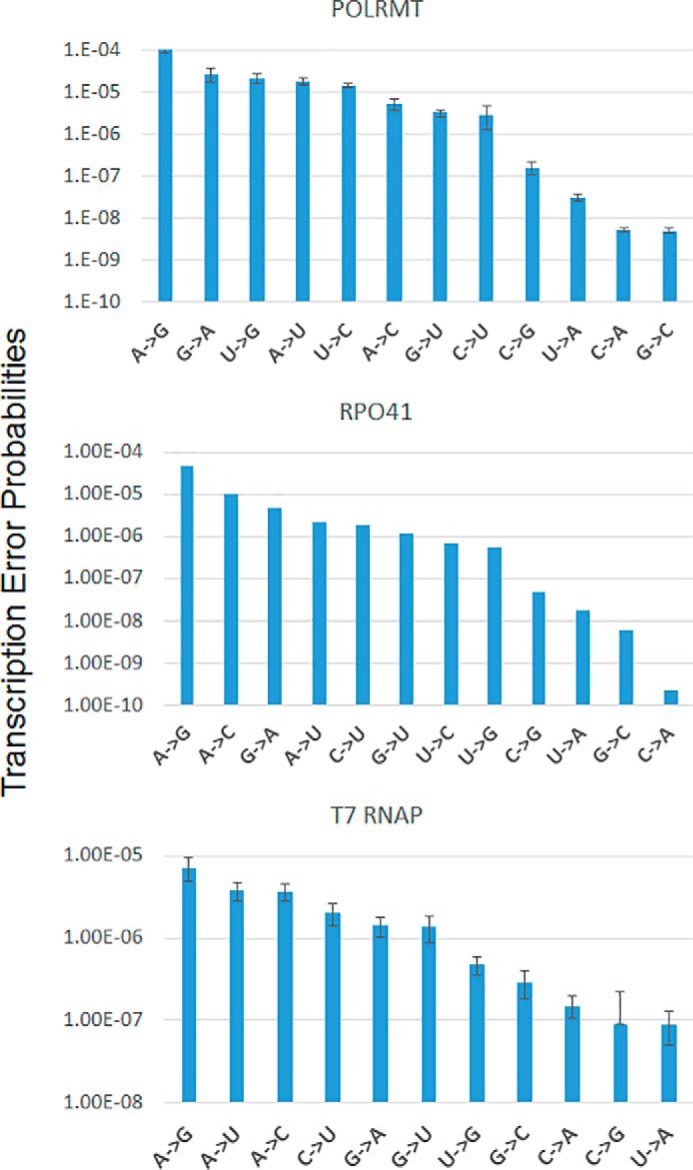
Summary of the transcription error rates of POLRMT, Rpo41, and T7 RNAP for all possible base pair combinations. The plots summarize the transcription errors rates (from Tables 1–3), organizing the rates from the highest to the lowest for the three RNAPs. The A→G base change occurs with the highest probability (∼10−4) in all three RNAPs. Similarly, the U→A, C→G, and C→A, and G→C base changes occur with the lowest probabilities (∼10−7–10−10) in all three RNAPs. The G→A, U→G, A→U, U→C, A→C, G→U, and C→U base changes occur with intermediate probabilities (∼10−5–10−6). The errors bars show the errors associated with kpol/Kd values of correct and misincorporations from Tables 1–3 calculated using the error propagation method. The error bars for Rpo41 are missing because the Kd values of correct nucleotide addition by Rpo41 was estimated and assumed to be the same as POLRMT.
Summary of the transcription errors of the yeast Rpo41
A complete misincorporation study was carried out with the yeast Rpo41 (supplemental Figs. S1–S4). Interestingly, the yeast Rpo41 shows a similar general trend of transcription errors as the POLRMT (Table 2 and Fig. 8). Rpo41 also shows a high propensity of GTP addition across dT with an A→G error rate of 10−4. Errors from purine–pyrimidine mismatches (1.4 × 10⁻⁵) are about 7 times more frequent than errors from purine–purine and pyrimidine–pyrimidine mismatches (1.8 × 10⁻⁶). A→C, G→A, A→U, C→U, G→U, U→C, and U→G are more frequent (10−5–10−6), and C→G, U→A, G→C, and C→A are rare (10−7–10−10). Rpo41 also discriminates against incorrect NTPs both at the binding and chemical steps. On average, the incorrect NTPs have ∼14-fold weaker affinity and ∼8000-fold slower rates relative to correct NTP. Thus, Rpo41 discriminates with a slightly higher efficiency at the chemical step than the POLRMT. The average transcription error rate of Rpo41 is 6 × 10⁻⁶, which is 3 times lower than that of POLRMT.
Table 2.
Nucleotide selectivity of Rpo41
ND, not determined.
| DNA-NTP | Rpo41 kpol | Kd | kpol/Kd | Transcription error rate (kpol/Kd)incorrect, NTP/(kpol/Kd)correct, NTP |
|---|---|---|---|---|
| s−1 | μm | m−1 s−1 | ||
| dA:UTP | 51 ± 6 | 60a | 8.5 × 10⁵ | 1 |
| dA:ATP | ND | ND | 0.015 ± 0.002 | 1.8 × 10⁻⁸ |
| dA:CTP | ND | ND | 0.6 ± 0.02 | 7 × 10⁻⁷ |
| dA:GTP | ND | ND | 0.46 ± 0.05 | 5.4 × 10⁻⁷ |
| dT:CTP | 3.5 ± 0.01 × 10⁻³ | 411 ± 76 | 9 ± 1.6 | 1.06 × 10⁻⁵ |
| dT:GTP | 0.03 ± 0.005 | 632 ± 260 | 44 ± 20 | 5 × 10⁻⁵ |
| dT:UTP | ND | ND | 1.9 ± 0.08 | 2.2 × 10⁻⁶ |
| dC:CTP | ND | ND | 5 × 10⁻³ ± 1 × 10⁻³ | 5.9 × 10⁻⁹ |
| dC:ATP | 2.6 ± 0.2 × 10⁻³ | 641 ± 253 | 4 ± 1.6 | 4.7 × 10⁻⁶ |
| dC:UTP | 8 ± 0.7 × 10⁻⁴ | 802 ± 308 | 1 ± 0.4 | 1.2 × 10⁻⁶ |
| dG:UTP | 1.1 ± 0.04 × 10⁻³ | 709 ± 115 | 1.6 ± 0.6 | 1.9 × 10⁻⁶ |
| dG:ATP | ND | ND | 2 × 10⁻⁴ ± 5 × 10⁻⁴ | 2.3 × 10⁻¹⁰ |
| dG:GTP | 7.5 ± 0.1 × 10⁻⁵ | 1959 ± 756 | 0.04 ± 0.015 | 4.7 × 10⁻⁸ |
a The Kd of the correct nucleotide is estimated.
Summary of the transcription errors of the T7 RNAP
A complete misincorporation study of the T7 RNAP was carried out with a slightly different construct of ES but with the same RNA-DNA hybrid sequence (supplemental Fig. S5). T7 RNAP also shows a similar trend of misincorporation as the mitochondrial RNAPs (Table 3 and Fig. 8). However, T7 RNAP shows a much higher discrimination at the chemical step relative to the mitochondrial RNAPs. On average, the binding affinity of incorrect NTPs is ∼30-fold weaker, and the incorporation rate is ∼15,000-fold slower than correct NTPs. Errors from purine–pyrimidine mismatches are about 3 times higher than the errors from purine–purine and pyrimidine–pyrimidine mismatches. T7 RNAP also shows a high rate of dT:GTP misincorporation, predicting a high A→G error rate of 10−5 followed by A→U, A→C, C→U, G→A, G→U, and U→G error rates of 10−6 and G→C, C→A, C→G, and U→A error rates of 10−7. The average transcription error rate of T7 RNAP is 2 × 10⁻⁶, which is 10-fold lower than that of POLRMT.
Table 3.
Nucleotide selectivity of T7 RNAP
ND, not determined.
| DNA-NTP | kpol | Kd | kpol/Kd | Transcription error rate (kpol/Kd)incorrect, NTP/(kpol/Kd)correct, NTP |
|---|---|---|---|---|
| s−1 | μm | m−1 s−1 | ||
| dA:UTP | 190 ± 20 | 98 ± 22 | 2 ± 0.5 × 10⁶ | 1 |
| dA:ATP | ND | ND | 0.18 ± 0.07 | 9 × 10⁻⁸ |
| dA:CTP | ND | ND | ND | ND |
| dA:GTP | ND | ND | 0.95 ± 0.03 | 4.75 × 10⁻⁷ |
| dT:CTP | ND | ND | 6.7 ± 0.28 | 3.35 × 10⁻⁶ |
| dT:GTP | 0.06 ± 0.007 | 4207 ± 718 | 14.3 ± 2.9 | 7.15 × 10⁻⁶ |
| dT:UTP | ND | ND | 7.6 ± 0.37 | 3.8 × 10⁻⁶ |
| dC:CTP | 1.0 ± 0.12 × 10⁻³ | 1725 ± 506 | 0.58 ± 0.18 | 2.9 × 10⁻⁷ |
| dC:ATP | ND | ND | 2.8 ± 0.38 | 1.4 × 10⁻⁶ |
| dC:UTP | 6 ± 0.6 × 10⁻³ | 2230 ± 503 | 2.7 ± 0.66 | 1.35 × 10⁻⁶ |
| dG:UTP | 6 ± 0.37 × 10⁻³ | 1552 ± 237 | 4 ± 0.63 | 2 × 10⁻⁶ |
| dG:ATP | 6 ± 0.58 × 10⁻⁴ | 2597 ± 768 | 0.23 ± 0.07 | 1.5 × 10⁻⁷ |
| dG:GTP | 8 ± 5 × 10⁻⁴ | 4365 ± 5366 | 0.18 ± 0.25 | 9 × 10⁻⁸ |
Pausing, bypass, and dissociation kinetics of POLRMT after the misincorporation event
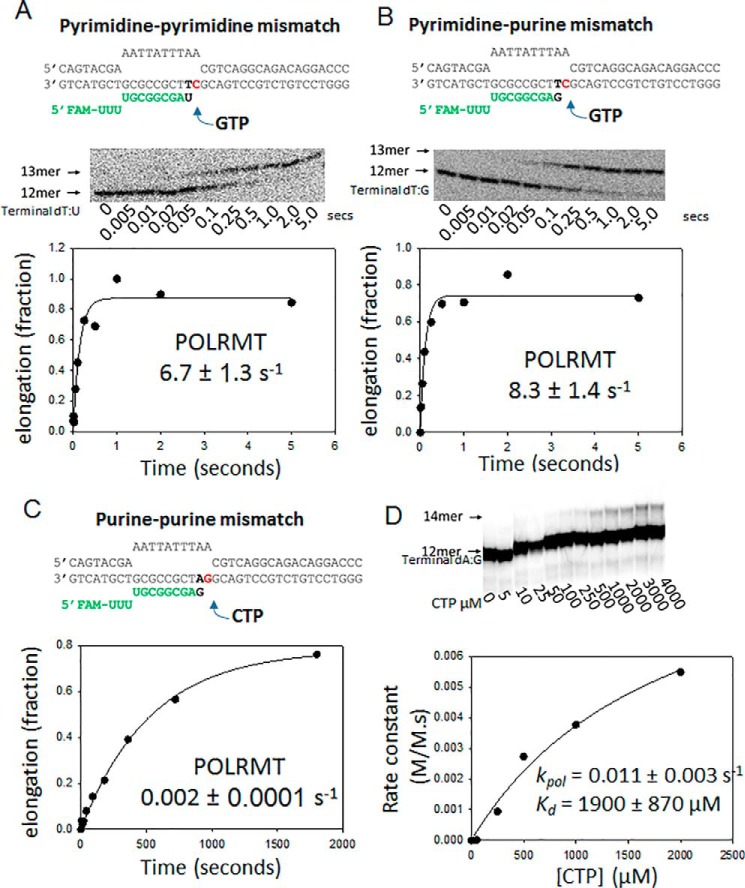
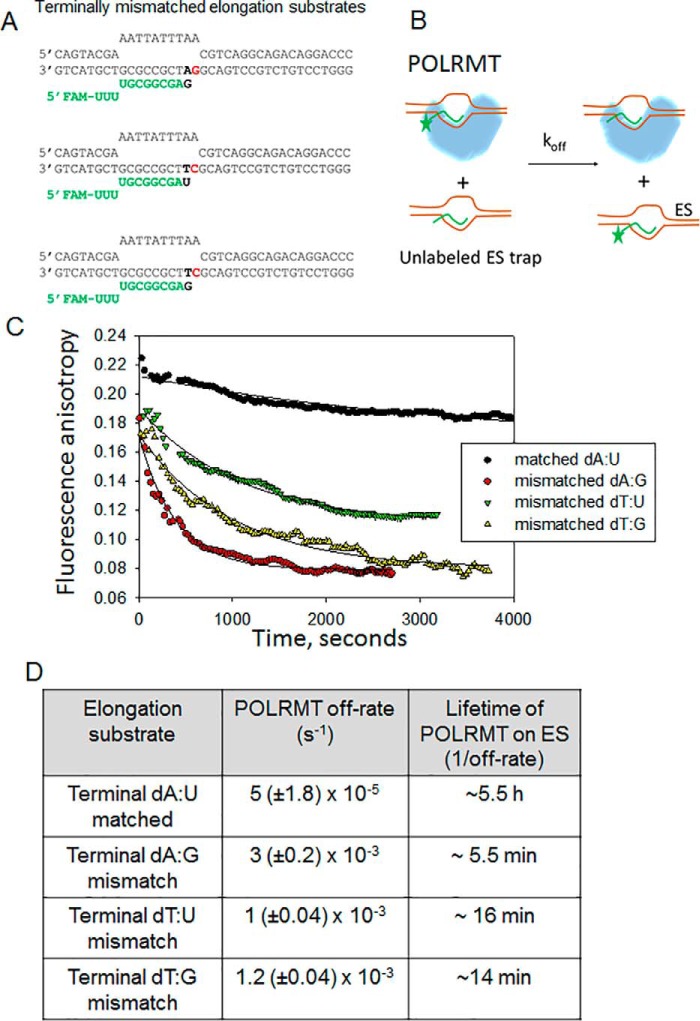
Unlike multisubunit RNAPs and replicative DNA polymerases, the single-subunit RNAPs do not have error proofreading activity. To investigate the fate of the elongation complex after misincorporation events, we investigated several of the posterror processes with the following questions. After misincorporating, does POLRMT bypass the error, stall after misincorporating to generate paused transcription complexes, or abort the RNA? To explore these possibilities, we prepared several terminally mismatched ES, such as dT:U, dT:G, and dA:G. We measured the mutagenic bypass rates of POLRMT. Surprisingly, POLRMT efficiently bypasses both dT:U and dT:G mismatches by adding the next correct NTP with rates almost similar to those for correct nucleotide (Fig. 9, A and B). We had to use rapid kinetic methods to measure the mutagenic bypass rates, which were 7–8 s−1 at 50 μm NTP. A similarly fast rate of correct nucleotide over incorrect base pair is noted above during measurements of CTP misincorporation on the dT-ES (Fig. 4C). The fast mutagenic bypass rates of POLRMT contrast with DNA polymerases that have very slow rates of correct addition over mismatches (39). Given that dT:G mismatch is most frequently introduced and dT:U is introduced with moderate efficiency, the fast mutagenic bypass rates would indicate that A→G and A→U errors once made will be sealed into the RNA. In contrast to the fast mutagenic bypass rates past dT:U and dT:G mismatches, the mutagenic bypass rate past the purine–purine dA:G mismatch was ∼1000 times slower (Fig. 9, C and D), which indicates that the mutagenic bypass rate of POLRMT is dependent on the type of mismatch.
Figure 9.
Mutagenic bypass rates of the POLRMT. A, the dT:U mismatched ES (200 nm) was incubated with GTP (50 μm) in the presence of POLRMT (400 nm), and the gel image shows the elongation of 12-mer to 13-mer. The kinetics of mutagenic bypass were measured in a rapid chemical quench-flow instrument and fit to a single exponential equation. FAM, 6-carboxyfluorescein. B, the same reaction as in A was carried out with the dT:G mismatched with ES. C, the same reaction as in A was carried out with the dA:G mismatched ES in the presence of 400 nm POLRMT and 1600 nm ES. D, the mutagenic bypass rates on the dA:G mismatched ES (1600 nm) by POLRMT (400 nm) were measured at increasing [CTP] to obtain the kpol and Kd values shown. The errors are standard errors of fitting.
To explore the possibility that POLRMT may abort after making an error, we measured the off-rates of POLRMT from matched and various mismatched terminated ESs (Fig. 10A). A preformed complex of POLRMT with fluorescein-labeled ES was chased with an excess of unlabeled ES (Fig. 10B). The time-dependent decrease in fluorescence provided the off-rates and lifetimes of POLRMT complexes. The lifetime of POLRMT on a matched primer-end ES is ∼5.5 h (Fig. 1C). In contrast, the lifetime of POLRMT on the dA:G mismatched ES is only ∼5.5 min (Fig. 10, C and D). This indicates that the terminal mismatch affects the stability of the elongation complex. The mutagenic bypass rate past dA:G (2 × 10⁻³ s−1) is comparable with the off-rate (3 × 10⁻³ s−1); hence there is a high probability that POLRMT will abort after the dA:GTP misincorporation event, decreasing the frequency of T→G errors in productive RNAs. In contrast, POLRMT will seal in the A→U and A→G mistakes in the RNA because the bypass rates of POLRMT past dT:U and dT:G mismatches are much faster (6–8 s−1) than the off-rates (1 × 10⁻³ s−1).
Figure 10.
Kinetic stability of the 3′-end mismatched elongation complexes of POLRMT. A, the 3′-end mismatched ES is shown. FAM, 6-carboxyfluorescein. B, the experimental design to measure the off-rate of ES from POLRMT. The reaction conditions are the same as in Fig. 1C. C, time courses of ES dissociation from POLRMT as monitored by the kinetics of fluorescence anisotropy decay. The experiments were repeated twice, and representative traces are shown. D, the kinetics in C were fit to a single exponential equation to obtain the off-rates and lifetimes of the POLRMT-ES complexes. The experiments were carried out at least twice. The errors are standard errors of the fit.
Effect of an oxidized 8-oxo-dG templating base on elongation by POLRMT
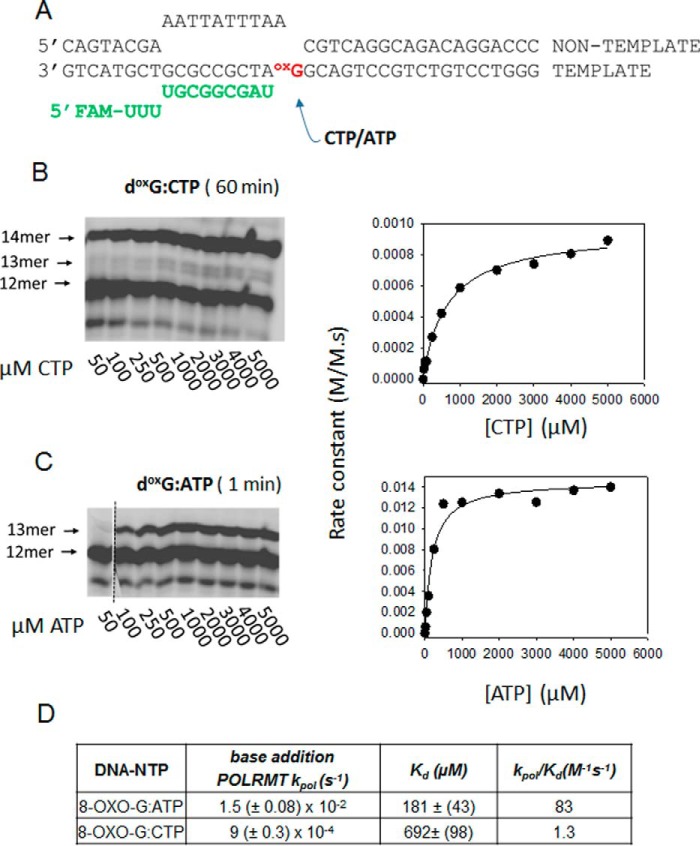
8-Oxo-dG is a common oxidative damage in the DNA. We created an ES with 8-oxo-dG as the +1 templating base (Fig. 11A) to measure the incorporation of correct CTP and incorrect ATP across 8-oxo-dG. Although elongation studies of POLRMT and T7 RNAP have been conducted with 8-oxo-dG (10, 40), the rates of pausing, mutagenic bypass, and error-free bypass have not been measured. We show that POLRMT adds the correct CTP across 8-oxo-dG with a kpol of 9 × 10⁻⁴ s−1 (Fig. 11, B and D), which is ∼13,000 times slower than the normal elongation rate. The Kd of CTP across 8-oxo-dG is 700 μm, which is 12 times weaker than normal base pairing. Thus, the catalytic efficiency kpol/Kd of CTP addition across 8-oxo-dG is 150,000 times lower than the efficiency of normal elongation. Once CTP is added across 8-oxo-dG, the next correct nucleotide is added at a fast rate (Fig. 11B).
Figure 11.
Translesion synthesis rates of POLRMT across the 8-oxo-dG lesion. A, elongation substrate with 8-oxo-dG lesion as the templating base. FAM, 6-carboxyfluorescein. B, the gel image shows the consecutive addition of two CTPs on the 8-oxo-dG-ES by POLRMT. The reaction conditions are the same as in Fig. 4. The rates of CTP addition across 8-oxo-dG are plotted against [CTP] and fit to a hyperbola to obtain the kpol and Kd. C, the gel image shows ATP addition across 8-oxo-dG as a function of [ATP]. The quantified data are fit to a hyperbola to obtain the Kd and kpol. D, the table lists the kinetic parameters of correct CTP and incorrect ATP addition across the 8-oxo-dG templating base by POLRMT.
In contrast to CTP, the catalytic efficiency of ATP addition across 8-oxo-dG is ∼75-fold higher due to the higher kpol and the lower ATP Kd (Fig. 11, C and D). The affinity of ATP across 8-oxo-dG is 4 times greater than CTP across 8-oxo-dG. This also indicates that the 8-oxo-dG templating base assumes a syn conformation to form a stable Hoogsteen base pair with the incoming ATP. If 8-oxo-dG assumed the anti conformation in the active site of POLRMT, it would bind preferably to CTP (41). In summary, our results indicate that POLRMT will undergo mutagenic translesion bypass at 8-oxo-dG, introducing C→A base changes with rates of 4 × 10⁻⁴. Note that the C→A error rates on a normal dG template are very low (5 × 10⁻⁹). Furthermore, we predict that POLRMT will generate paused transcription complexes on 8-oxo-dG oxidized templates. This is because the mutagenic and error-free translesion bypass rates, respectively, are ∼800–15,000 times slower than normal elongation rates.
Effect of TEFM on the transcriptional fidelity of POLRMT
The mitochondrial transcription elongation factor TEFM was recently identified as a transcription elongation factor (42). TEFM promotes POLRMT processivity and thus helps in the synthesis of longer transcripts. In addition, it prevents pausing of POLRMT at various sites on the DNA, thereby aiding in continuation of transcription (43, 44). However, the roles of TEFM in transcriptional fidelity of POLRMT are not known.
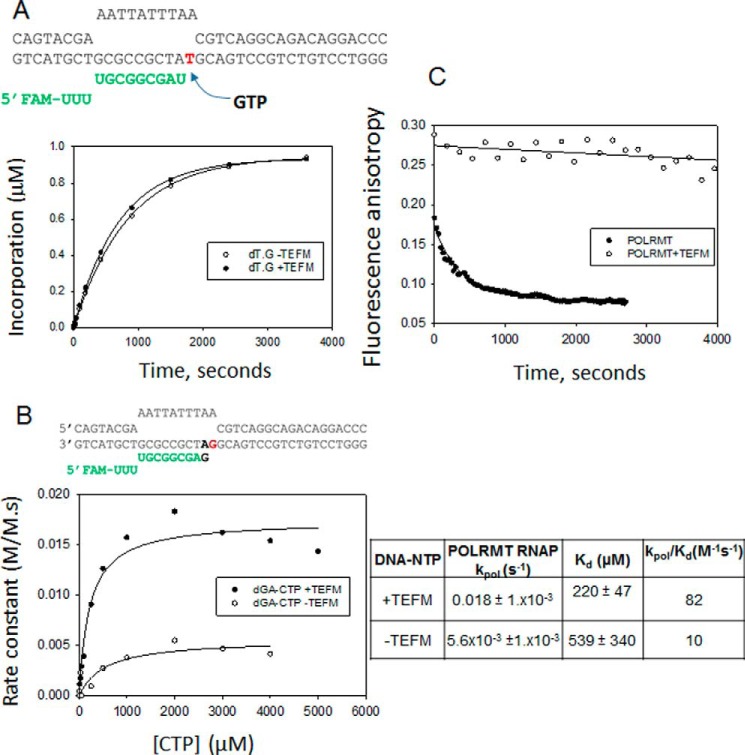
We tested the effect of TEFM on the misincorporation rate of GTP across dT as this is the most efficient mismatch. However, TEFM had no effect on the rate of dT:G mismatch formation (Fig. 12A). Interestingly, TEFM increased the efficiency of the mutagenic bypass over the dA:G mismatch by 8-fold (Fig. 12B). This suggests that TEFM allows POLRMT to continue with transcription after a misincorporation event. This possibly could be due to stabilization of POLRMT by TEFM on the dA:G template. Therefore, we measured the off-rate of POLRMT from a mismatched dA:G elongation complex in the presence and absence of TEFM and observed that TEFM substantially increases the stability of the mismatched elongation complex. The off-rate of POLRMT from the dA:G elongation complex in the presence of TEFM (2 × 10⁻⁵ s−1) is 60-fold slower than that in the absence of TEFM (Fig. 12C). In fact, the lifetime of the mismatched elongation complex with TEFM was similar to that of POLRMT on matched template. Thus, TEFM aids in the continuation of transcription by preventing the pausing of POLRMT at a mismatch site.
Figure 12.
Effect of TEFM on the misincorporation and mutagenic bypass rates of POLRMT. A, the dT elongation substrate is shown. FAM, 6-carboxyfluorescein. The kinetics of GTP misincorporation across dT are shown. The experiments were carried out using dT-ES (500 nm) and POLRMT (1000 nm) in the presence or absence of TEFM (2000 nm) at 100 μm NTP. The rate of GTP misincorporation by POLRMT was 1.4 × 10⁻³ ± 2.5 × 10⁻⁵ s−1 in the presence of TEFM and 1.2 × 10⁻³ ± 2.6 × 10⁻⁵ s−1 in the absence of TEFM. B, the dA:G terminally mismatched elongation substrate is shown. The rates of CTP incorporation on the dA:G mismatched ES (1600 nm) were measured in the presence of POLRMT (400 nm) with or without TEFM (800 nm) at increasing [CTP] to obtain the kpol and Kd values shown in the table. The errors are standard errors of fitting. C, the off-rates of POLRMT (40 nm) from 3′-end dA:G mismatched elongation substrate (10 nm) in the presence or absence of TEFM (120 nm). The kinetics were fit to a single exponential equation to estimate the off-rates and lifetimes of the POLRMT-ES complexes. The lifetime of POLRMT in the presence of TEFM on the dA:G mismatched substrate was similar to that on the matched substrate (Fig. 10).
Discussion
We have carried out a comprehensive nucleotide selectivity study of three single-subunit RNAPs, including the human mitochondrial POLRMT, yeast mitochondrial Rpo41, and phage T7 RNAP, by determining the catalytic efficiencies of correct and all 12 incorrect nucleotide incorporations on a promoter-free elongation substrate. From the nucleotide selectivity values, we can predict that the average transcription error rate of T7 RNAP is 2 × 10⁻⁶, that of yeast mitochondrial Rpo41 is 6 × 10⁻⁶, and that of human mitochondrial POLRMT is 2 × 10⁻⁵. Thus, T7 RNAP is about 10 times more accurate than POLRMT, and the yeast Rpo41 is about 3 times more accurate than POLRMT. The intrinsic error rates of single-subunit RNAPs are close to or lower than the error rates of replicative DNA polymerases (45, 46). The transcription error rate of POLRMT is close to the replication error rate of the proofreading-deficient human Polγ (2 × 10⁻⁵) (46), and the T7 RNAP error rate (∼2 × 10⁻⁶) is actually 10 times lower.
The intrinsic error rates of single-subunit RNAPs are also lower than the intrinsic error rates of multisubunit RNAPs. For example, the intrinsic error rates of E. coli RNAP and nuclear Pol II are estimated to be around 10−3–10−4 (4–6). However, multisubunit RNAPs either contain an intrinsic proofreading activity (47) or use accessory factors such as GreA/B and TFIIS to proofread errors, which increases their accuracy/fidelity of RNA synthesis (5, 48–51). Such proofreading activities are absent in single-subunit RNAPs, but the higher fidelity likely compensates for their lack of proofreading capabilities.
The most prominent misincorporation event that was observed in all three single-subunit RNAPs was GTP across dT, which introduces A→G errors in the RNA. Our studies predict that this error will occur with a rate of ∼10−4. The single-subunit RNAPs are structurally related to the Pol I family of DNA polymerases, including the Klenow fragment of E. coli Pol I and human Polγ. Interestingly, the Pol I family DNA polymerases also show a high rate of dT:G misincorporation (46, 52), indicating a structural basis for efficient misincorporation of GTP across dT. One reason is that the dT:G forms a wobble base pair, which is accommodated well within the active site of these polymerases (53). However, base-stacking interactions are also important because the corresponding dG:U misincorporation occurs with a 100-fold lower rate in all three RNAPs and Polγ (46). This indicates that, in addition to wobble base pairing, base-stacking interactions of the incoming purine GTP make a significant contribution to the high rate of dT:G misincorporation.
It is possible that the individual errors rates are influenced by the neighboring sequences, but in general misincorporations from purine–pyrimidine base pairs are more frequent in all three RNAPs. The nucleotide selectivity predicts that A→C, G→A, A→U, C→U, G→U, U→C, and U→G errors occur with rates of 10−5–10−6. Conversely, C→G, U→A, G→C, and C→A resulting from purine–purine and pyrimidine–pyrimidine mismatches are rare with rates of 10−7–10−10. In general, discrimination against the incorporation of incorrect NTPs is both due to a weak NTP binding (14–20-fold) and a slower chemical step (2000–15,000-fold) relative to correct NTP.
We wished to determine how the most prominent base changes in RNA predicted from in vitro measurements compare with those observed in vivo. The most prominent errors observed in in vivo E. coli RNAs are G→A, C→U, and C→A (6). The G→A base change is a highly probable error resulting from dC:A misincorporation, which is a wobble base pair that is most likely accommodated well in the active sites of polymerases. This mismatch is also frequently found in the mitochondrial DNA polymerase Polγ reactions (46). The C→U and C→A errors prominently found in vivo show low occurrences in our in vitro transcription reactions. A possible explanation is that the C→U base change observed prominently in vivo results from deamination of cytosines in single-stranded RNA (54). Similarly, the C→A base change most prominently found in the in vivo RNAs may arise from oxidized guanines in the template DNA. This is consistent with our observations that the C→A error rate is high and of the order of ∼10−4 on 8-oxo-dG template. Thus, in addition to misincorporation, damaged bases in the template DNA and deamination of cytosines are major sources of transcription errors in vivo. Mitochondrial DNA is prone to oxidative damage (55); thus we expect a high frequency of C→A base change in the mitochondrial RNAs.
We also measured the rates of correct nucleotide addition over mismatches to investigate posterror consequences. First, we saw no evidence for any proofreading activity of POLRMT. Second, we found that POLRMT efficiently extends the pyrimidine–pyrimidine and purine–pyrimidine mismatches, including dT:U and dT:G, with rates as fast as extending a matched primer end. This is surprising because DNA polymerases slow down considerably after all misincorporation events, which allows the proofreading activity to excise the mismatches (56). The rates of correct nucleotide addition over dT:U and dT:G mismatched primer ends are faster than the POLRMT off-rates, which indicates that POLRMT will not stall or abort after these misincorporation events, and A→U and A→G errors will be efficiently sealed into the transcribed RNA. Other mismatches, such as the dG:A, behaved differently. The correct nucleotide addition past the dA:G mismatched primer end was slower and comparable with the POLRMT off-rate, which indicates that POLRMT will frequently stall after making this mistake and abort the RNA. Thus, depending on the type of mismatch, POLRMT may pause, efficiently bypass, or abort the RNA.
It has been reported that paused transcription complexes pose a barrier to transcriptional and moving replisome, contributing to genome instability (11, 12). Our studies indicate that except for certain misincorporations, such as dT:U and dT:G, POLRMT is expected to form paused transcription complexes after misincorporation events and upon encountering oxidized bases, such as 8-oxo-dG, in the template. In multisubunit RNAPs, pausing is greatly reduced by proofreading factors such as GreA (49, 50). In human mitochondria, TEFM was shown to increase the bypass rate at 8-oxo-dG (44). Herein, we show that TEFM increases the mutagenic bypass rate of POLRMT by stabilizing the elongation complex. Thus, TEFM prevents stalling of POLRMT at mismatched sites.
In summary, we show that T7 RNAP is about 10 times more efficient at adding the correct nucleotide during transcription elongation than POLRMT, and Rpo41 is about 5 times more efficient than POLRMT. The misincorporation studies indicate that all three RNAPs are highly accurate with transcription error rates lower than those of multisubunit RNAPs and resembling those of replicative DNA polymerases. The average error rate of T7 RNAP is 10-fold lower than that of POLRMT, and that of Rpo41 is 3-fold lower. It is interesting that T7 RNAP, which does not require any transcription factors, has the highest fidelity and that POLRMT and Rpo41, which depend on transcription factors, have lower fidelities. Although POLRMT is efficient at catalyzing elongation on its own, TEFM is known to stimulate transcription elongation (43, 44). Although TEFM does not affect the misincorporation rate, it increases the mutagenic bypass rate, thereby allowing continuation of transcription. Like other Pol I family polymerases, we found that all three RNAPs misincorporate GTP across dT with a high rate, predicting frequent A→G errors in the transcribed RNAs. Frequent C→U errors are also predicted from deamination, and C→A errors are predicted in RNA from high efficiency of incorrect ATP addition across 8-oxo-dG in the template. Additionally, we show that misincorporation events and oxidized templates promote paused transcription complexes, which can be overcome by the presence of TEFM.
Experimental procedures
Nucleic acids, proteins, and other reagents
Oligodeoxynucleotides were custom-synthesized and HPLC-purified by Integrated DNA Technologies (Coralville, IA). DNA concentration was determined from its absorbance at 260 nm and the calculated molar extinction coefficients. RNAs were purchased PAGE-purified and 2′-deprotected/desalted from GE Dharmacon. RNAs were purchased with 5′-end fluorescein. High purity NTPs (100 mm solution) were purchased from Affymetrix Thermo Fisher Scientific.
The N-terminal His-tagged POLRMT, N-terminal His-tagged Rpo41, untagged TEFM, and untagged T7 RNAP were purified as described previously (25, 28, 36, 44, 57, 58). Enzyme concentration was calculated from its absorbance at 280 nm and the calculated molar extinction coefficient.
Assembly of the promoter-free elongation substrate
Template DNA, non-template DNA, and 5′-labeled RNA were mixed in a 1.25:1.5:1 ratio in the transcription buffer (50 mm Tris acetate, pH 7.5, 10 mm magnesium acetate, 100 mm sodium glutamate, 5 mm DTT, 0.025% Tween 20) at a final concentration of 20 μm, heated at 95 °C for 20 min, and then stepwise cooled from 75, 55, and 45 °C for 20 min each, 20 °C for another 25 min, and finally to 4 °C for an hour.
Fluorescence anisotropy studies to measure the equilibrium Kd and off-rates of POLRMT complexes
Fluorescence anisotropy measurements were carried out in a Fluoromax-4 (Horiba Jobin Yvon) at 25 °C. Fluorescein-labeled ES (10 nm) was titrated with increasing concentrations of POLRMT in the transcription buffer. Fluorescence anisotropy was recorded after excitation at 494 nm and emission at 516 nm and plotted against [POLRMT]. The data were fit to the quadratic equation to obtain the equilibrium dissociation constant (Kd) as described (37, 59).
The off-rates were determined by chasing a complex of fluorescein-labeled ES (10 nm) and POLRMT (40 nm) with unlabeled ES (400 nm) with or without TEFM (120 nm) and monitoring the decrease in fluorescence anisotropy due to the dissociation of fluorescein-labeled ES from the POLRMT. The kinetics were fit to a single exponential equation to obtain the off-rates.
Correct nucleotide incorporation by using rapid chemical quench-flow kinetics
Presteady-state kinetic experiments were conducted at 25 °C using a Model RQF-3 chemical quench-flow apparatus (KinTek Corp., Austin, TX). A mixture of RNAP and elongation substrate in the transcription buffer was loaded in one syringe of the quenched-flow instrument, and NTP was added from a second syringe of the instrument. The reactions were rapidly mixed and quenched with EDTA (0.2 m final concentration) after predefined time intervals.
Incorrect nucleotide incorporation
The kinetics of incorrect nucleotide misincorporation were measured using 1600 nm elongation substrate and 400 nm RNAP at 25 °C. The reactions were quenched with 0.2 m EDTA at various times ranging from 5 s to 60 min depending on the initially established reaction conditions. The misincorporation experiments were carried out multiple times (initially with Cy5- and then with fluorescein-labeled ES), and representative gels and figures are shown.
The EDTA-quenched correct and incorrect nucleotide reaction mixtures were loaded on a 24% acrylamide/bis (19:1), 4 m urea sequencing gel. The fluorescein-labeled RNAs were directly detected by scanning the gel on a Typhoon 9410 or Typhoon FLA 7000 instrument (GE Healthcare) and quantified using ImageQuant software.
The correct nucleotide incorporation kinetics were fit to Equation 1 (single exponential equation) using SigmaPlot software (Jandel Scientific),
| (1) |
where Y is the fraction or molar amount of elongated primer products, y0 is the y-intercept or background, A is the amplitude or the total amount of products at the completion of the reaction, and kobs is the observed rate constant of product formation to completion.
The observed rate, kobs, of correct and incorrect nucleotide incorporation was plotted as a function of [NTP] and fit to Equation 2,
| (2) |
where Kd is the equilibrium dissociation constant of the NTP from the polymerase complex and kpol is the maximum rate constant of NMP incorporation into the RNA primer.
Author contributions
S. S. P. and S. S. designed the study. S. S. and M. S. generated and analyzed the data. S. S. P. wrote the manuscript. A. R. provided assistance in the T7 and TEFM study and in the critical review of the manuscript. All authors approved the final version of the manuscript
Supplementary Material
Acknowledgments
We thank members of the Patel laboratory for valuable advice and critical insights throughout this study.
This work was supported by NIGMS, National Institutes of Health Grant R35118086. The authors declare that they have no conflicts of interest with the contents of this article. The content is solely the responsibility of the authors and does not necessarily represent the official views of the National Institutes of Health.
This article contains supplemental Figs. S1–S5.
- RNAP
- RNA polymerase
- 8-oxo-dG
- 8-oxodeoxyguanine
- Pol
- RNA polymerase
- TF
- transcription factor
- ES
- elongation bubble substrate
- POLRMT
- RNA polymerase mitochondrial
- TEFM
- transcription elongation factor mitochondrial.
References
- 1. Carey L. B. (2015) RNA polymerase errors cause splicing defects and can be regulated by differential expression of RNA polymerase subunits. Elife 4, e09945. [DOI] [PMC free article] [PubMed] [Google Scholar]
- 2. Morreall J. F., Petrova L., and Doetsch P. W. (2013) Transcriptional mutagenesis and its potential roles in the etiology of cancer and bacterial antibiotic resistance. J. Cell. Physiol. 228, 2257–2261 [DOI] [PMC free article] [PubMed] [Google Scholar]
- 3. Vermulst M., Denney A. S., Lang M. J., Hung C. W., Moore S., Moseley M. A., Thompson J. W., Madden V., Gauer J., Wolfe K. J., Summers D. W., Schleit J., Sutphin G. L., Haroon S., Holczbauer A., et al. (2015) Transcription errors induce proteotoxic stress and shorten cellular lifespan. Nat. Commun. 6, 8065. [DOI] [PMC free article] [PubMed] [Google Scholar]
- 4. Gout J. F., Thomas W. K., Smith Z., Okamoto K., and Lynch M. (2013) Large-scale detection of in vivo transcription errors. Proc. Natl. Acad. Sci. U.S.A. 110, 18584–18589 [DOI] [PMC free article] [PubMed] [Google Scholar]
- 5. Imashimizu M., Oshima T., Lubkowska L., and Kashlev M. (2013) Direct assessment of transcription fidelity by high-resolution RNA sequencing. Nucleic Acids Res. 41, 9090–9104 [DOI] [PMC free article] [PubMed] [Google Scholar]
- 6. Traverse C. C., and Ochman H. (2016) Conserved rates and patterns of transcription errors across bacterial growth states and lifestyles. Proc. Natl. Acad. Sci. U.S.A. 113, 3311–3316 [DOI] [PMC free article] [PubMed] [Google Scholar]
- 7. Ames B. N., Shigenaga M. K., and Hagen T. M. (1995) Mitochondrial decay in aging. Biochim. Biophys. Acta 1271, 165–170 [DOI] [PubMed] [Google Scholar]
- 8. Doetsch P. W. (2002) Translesion synthesis by RNA polymerases: occurrence and biological implications for transcriptional mutagenesis. Mutat. Res. 510, 131–140 [DOI] [PubMed] [Google Scholar]
- 9. Remington K. M., Bennett S. E., Harris C. M., Harris T. M., and Bebenek K. (1998) Highly mutagenic bypass synthesis by T7 RNA polymerase of site-specific benzo[a]pyrene diol epoxide-adducted template DNA. J. Biol. Chem. 273, 13170–13176 [DOI] [PubMed] [Google Scholar]
- 10. Tornaletti S., Maeda L. S., Kolodner R. D., and Hanawalt P. C. (2004) Effect of 8-oxoguanine on transcription elongation by T7 RNA polymerase and mammalian RNA polymerase II. DNA Repair 3, 483–494 [DOI] [PubMed] [Google Scholar]
- 11. Gaillard H., and Aguilera A. (2016) Transcription as a threat to genome integrity. Annu. Rev. Biochem. 85, 291–317 [DOI] [PubMed] [Google Scholar]
- 12. James K., Gamba P., Cockell S. J., and Zenkin N. (2017) Misincorporation by RNA polymerase is a major source of transcription pausing in vivo. Nucleic Acids Res. 45, 1105–1113 [DOI] [PMC free article] [PubMed] [Google Scholar]
- 13. Sousa R., and Mukherjee S. (2003) T7 RNA polymerase. Prog. Nucleic Acid Res. Mol. Biol. 73, 1–41 [DOI] [PubMed] [Google Scholar]
- 14. Steitz T. A. (2009) The structural changes of T7 RNA polymerase from transcription initiation to elongation. Curr. Opin. Struct. Biol. 19, 683–690 [DOI] [PMC free article] [PubMed] [Google Scholar]
- 15. McAllister W. T., and Raskin C. A. (1993) The phage RNA polymerases are related to DNA polymerases and reverse transcriptases. Mol. Microbiol. 10, 1–6 [DOI] [PubMed] [Google Scholar]
- 16. Cermakian N., Ikeda T. M., Miramontes P., Lang B. F., Gray M. W., and Cedergren R. (1997) On the evolution of the single-subunit RNA polymerases. J. Mol. Evol. 45, 671–681 [DOI] [PubMed] [Google Scholar]
- 17. Ringel R., Sologub M., Morozov Y. I., Litonin D., Cramer P., and Temiakov D. (2011) Structure of human mitochondrial RNA polymerase. Nature 478, 269–273 [DOI] [PubMed] [Google Scholar]
- 18. Schwinghammer K., Cheung A. C., Morozov Y. I., Agaronyan K., Temiakov D., and Cramer P. (2013) Structure of human mitochondrial RNA polymerase elongation complex. Nat. Struct. Mol. Biol. 20, 1298–1303 [DOI] [PMC free article] [PubMed] [Google Scholar]
- 19. Arnold J. J., Smidansky E. D., Moustafa I. M., and Cameron C. E. (2012) Human mitochondrial RNA polymerase: structure-function, mechanism and inhibition. Biochim. Biophys. Acta 1819, 948–960 [DOI] [PubMed] [Google Scholar]
- 20. Bestwick M. L., and Shadel G. S. (2013) Accessorizing the human mitochondrial transcription machinery. Trends Biochem. Sci. 38, 283–291 [DOI] [PMC free article] [PubMed] [Google Scholar]
- 21. Clayton D. A. (2000) Transcription and replication of mitochondrial DNA. Hum. Reprod. 15, Suppl. 2, 11–17 [DOI] [PubMed] [Google Scholar]
- 22. Deshpande A. P., and Patel S. S. (2012) Mechanism of transcription initiation by the yeast mitochondrial RNA polymerase. Biochim. Biophys. Acta 1819, 930–938 [DOI] [PMC free article] [PubMed] [Google Scholar]
- 23. Gaspari M., Larsson N. G., and Gustafsson C. M. (2004) The transcription machinery in mammalian mitochondria. Biochim. Biophys. Acta 1659, 148–152 [DOI] [PubMed] [Google Scholar]
- 24. Morozov Y. I., Parshin A. V., Agaronyan K., Cheung A. C., Anikin M., Cramer P., and Temiakov D. (2015) A model for transcription initiation in human mitochondria. Nucleic Acids Res. 43, 3726–3735 [DOI] [PMC free article] [PubMed] [Google Scholar]
- 25. Ramachandran A., Basu U., Sultana S., Nandakumar D., and Patel S. S. (2017) Human mitochondrial transcription factors TFAM and TFB2M work synergistically in promoter melting during transcription initiation. Nucleic Acids Res. 45, 861–874 [DOI] [PMC free article] [PubMed] [Google Scholar]
- 26. Posse V., and Gustafsson C. M. (2017) Human mitochondrial transcription factor B2 is required for promoter melting during initiation of transcription. J. Biol. Chem. 292, 2637–2645 [DOI] [PMC free article] [PubMed] [Google Scholar]
- 27. Matsunaga M., and Jaehning J. A. (2004) Intrinsic promoter recognition by a “core” RNA polymerase. J. Biol. Chem. 279, 44239–44242 [DOI] [PubMed] [Google Scholar]
- 28. Tang G. Q., Paratkar S., and Patel S. S. (2009) Fluorescence mapping of the open complex of yeast mitochondrial RNA polymerase. J. Biol. Chem. 284, 5514–5522 [DOI] [PMC free article] [PubMed] [Google Scholar]
- 29. Mercer T. R., Neph S., Dinger M. E., Crawford J., Smith M. A., Shearwood A. M., Haugen E., Bracken C. P., Rackham O., Stamatoyannopoulos J. A., Filipovska A., and Mattick J. S. (2011) The human mitochondrial transcriptome. Cell 146, 645–658 [DOI] [PMC free article] [PubMed] [Google Scholar]
- 30. Huang J., Brieba L. G., and Sousa R. (2000) Misincorporation by wild-type and mutant T7 RNA polymerases: identification of interactions that reduce misincorporation rates by stabilizing the catalytically incompetent open conformation. Biochemistry 39, 11571–11580 [DOI] [PubMed] [Google Scholar]
- 31. Tahirov T. H., Temiakov D., Anikin M., Patlan V., McAllister W. T., Vassylyev D. G., and Yokoyama S. (2002) Structure of a T7 RNA polymerase elongation complex at 2.9 Å resolution. Nature 420, 43–50 [DOI] [PubMed] [Google Scholar]
- 32. Yin Y. W., and Steitz T. A. (2002) Structural basis for the transition from initiation to elongation transcription in T7 RNA polymerase. Science 298, 1387–1395 [DOI] [PubMed] [Google Scholar]
- 33. Anand V. S., and Patel S. S. (2006) Transient state kinetics of transcription elongation by T7 RNA polymerase. J. Biol. Chem. 281, 35677–35685 [DOI] [PubMed] [Google Scholar]
- 34. Tang G. Q., Anand V. S., and Patel S. S. (2011) Fluorescence-based assay to measure the real-time kinetics of nucleotide incorporation during transcription elongation. J. Mol. Biol. 405, 666–678 [DOI] [PMC free article] [PubMed] [Google Scholar]
- 35. Smidansky E. D., Arnold J. J., Reynolds S. L., and Cameron C. E. (2011) Human mitochondrial RNA polymerase: evaluation of the single-nucleotide-addition cycle on synthetic RNA/DNA scaffolds. Biochemistry 50, 5016–5032 [DOI] [PMC free article] [PubMed] [Google Scholar]
- 36. Jia Y., Kumar A., and Patel S. S. (1996) Equilibrium and stopped-flow kinetic studies of interaction between T7 RNA polymerase and its promoters measured by protein and 2-aminopurine fluorescence changes. J. Biol. Chem. 271, 30451–30458 [DOI] [PubMed] [Google Scholar]
- 37. Tang G. Q., Deshpande A. P., and Patel S. S. (2011) Transcription factor-dependent DNA bending governs promoter recognition by the mitochondrial RNA polymerase. J. Biol. Chem. 286, 38805–38813 [DOI] [PMC free article] [PubMed] [Google Scholar]
- 38. Pomerantz R. T., Temiakov D., Anikin M., Vassylyev D. G., and McAllister W. T. (2006) A mechanism of nucleotide misincorporation during transcription due to template-strand misalignment. Mol. Cell 24, 245–255 [DOI] [PMC free article] [PubMed] [Google Scholar]
- 39. Wong I., Patel S. S., and Johnson K. A. (1991) An induced-fit kinetic mechanism for DNA replication fidelity: direct measurement by single-turnover kinetics. Biochemistry 30, 526–537 [DOI] [PubMed] [Google Scholar]
- 40. Nakanishi N., Fukuoh A., Kang D., Iwai S., and Kuraoka I. (2013) Effects of DNA lesions on the transcription reaction of mitochondrial RNA polymerase: implications for bypass RNA synthesis on oxidative DNA lesions. Mutagenesis 28, 117–123 [DOI] [PubMed] [Google Scholar]
- 41. Beard W. A., Batra V. K., and Wilson S. H. (2010) DNA polymerase structure-based insight on the mutagenic properties of 8-oxoguanine. Mutat. Res. 703, 18–23 [DOI] [PMC free article] [PubMed] [Google Scholar]
- 42. Minczuk M., He J., Duch A. M., Ettema T. J., Chlebowski A., Dzionek K., Nijtmans L. G., Huynen M. A., and Holt I. J. (2011) TEFM (c17orf42) is necessary for transcription of human mtDNA. Nucleic Acids Res. 39, 4284–4299 [DOI] [PMC free article] [PubMed] [Google Scholar]
- 43. Agaronyan K., Morozov Y. I., Anikin M., and Temiakov D. (2015) Mitochondrial biology. Replication-transcription switch in human mitochondria. Science 347, 548–551 [DOI] [PMC free article] [PubMed] [Google Scholar]
- 44. Posse V., Shahzad S., Falkenberg M., Hällberg B. M., and Gustafsson C. M. (2015) TEFM is a potent stimulator of mitochondrial transcription elongation in vitro. Nucleic Acids Res. 43, 2615–2624 [DOI] [PMC free article] [PubMed] [Google Scholar]
- 45. McCulloch S. D., and Kunkel T. A. (2008) The fidelity of DNA synthesis by eukaryotic replicative and translesion synthesis polymerases. Cell Res. 18, 148–161 [DOI] [PMC free article] [PubMed] [Google Scholar]
- 46. Lee H. R., and Johnson K. A. (2006) Fidelity of the human mitochondrial DNA polymerase. J. Biol. Chem. 281, 36236–36240 [DOI] [PubMed] [Google Scholar]
- 47. Ruan W., Lehmann E., Thomm M., Kostrewa D., and Cramer P. (2011) Evolution of two modes of intrinsic RNA polymerase transcript cleavage. J. Biol. Chem. 286, 18701–18707 [DOI] [PMC free article] [PubMed] [Google Scholar]
- 48. Wang D., and Hawley D. K. (1993) Identification of a 3′→5′ exonuclease activity associated with human RNA polymerase II. Proc. Natl. Acad. Sci. U.S.A. 90, 843–847 [DOI] [PMC free article] [PubMed] [Google Scholar]
- 49. Borukhov S., Sagitov V., and Goldfarb A. (1993) Transcript cleavage factors from E. coli. Cell 72, 459–466 [DOI] [PubMed] [Google Scholar]
- 50. Erie D. A., Hajiseyedjavadi O., Young M. C., and von Hippel P. H. (1993) Multiple RNA polymerase conformations and GreA: control of the fidelity of transcription. Science 262, 867–873 [DOI] [PubMed] [Google Scholar]
- 51. Orlova M., Newlands J., Das A., Goldfarb A., and Borukhov S. (1995) Intrinsic transcript cleavage activity of RNA polymerase. Proc. Natl. Acad. Sci. U.S.A. 92, 4596–4600 [DOI] [PMC free article] [PubMed] [Google Scholar]
- 52. Carroll S. S., Cowart M., and Benkovic S. J. (1991) A mutant of DNA polymerase I (Klenow fragment) with reduced fidelity. Biochemistry 30, 804–813 [DOI] [PubMed] [Google Scholar]
- 53. Strazewski P. (1988) Mispair formation in DNA can involve rare tautomeric forms in the template. Nucleic Acids Res. 16, 9377–9398 [DOI] [PMC free article] [PubMed] [Google Scholar]
- 54. Lindahl T., and Nyberg B. (1974) Heat-induced deamination of cytosine residues in deoxyribonucleic acid. Biochemistry 13, 3405–3410 [DOI] [PubMed] [Google Scholar]
- 55. Hamilton M. L., Van Remmen H., Drake J. A., Yang H., Guo Z. M., Kewitt K., Walter C. A., and Richardson A. (2001) Does oxidative damage to DNA increase with age? Proc. Natl. Acad. Sci. U.S.A. 98, 10469–10474 [DOI] [PMC free article] [PubMed] [Google Scholar]
- 56. Johnson K. A. (1993) Conformational coupling in DNA polymerase fidelity. Annu. Rev. Biochem. 62, 685–713 [DOI] [PubMed] [Google Scholar]
- 57. Davanloo P., Rosenberg A. H., Dunn J. J., and Studier F. W. (1984) Cloning and expression of the gene for bacteriophage T7 RNA polymerase. Proc. Natl. Acad. Sci. U.S.A. 81, 2035–2039 [DOI] [PMC free article] [PubMed] [Google Scholar]
- 58. Jia Y., and Patel S. S. (1997) Kinetic mechanism of transcription initiation by bacteriophage T7 RNA polymerase. Biochemistry 36, 4223–4232 [DOI] [PubMed] [Google Scholar]
- 59. Ramanathan A., Devarkar S. C., Jiang F., Miller M. T., Khan A. G., Marcotrigiano J., and Patel S. S. (2016) The autoinhibitory CARD2-Hel2i interface of RIG-I governs RNA selection. Nucleic Acids Res. 44, 896–909 [DOI] [PMC free article] [PubMed] [Google Scholar]
Associated Data
This section collects any data citations, data availability statements, or supplementary materials included in this article.


