

Abstract
Many cancer treatments, such as those for managing recalcitrant tumors like pancreatic ductal adenocarcinoma, cause off-target toxicities in normal, healthy tissue, highlighting the need for more tumor-selective chemotherapies. β-Lapachone is bioactivated by NAD(P)H:quinone oxidoreductase 1 (NQO1). This enzyme exhibits elevated expression in most solid cancers and therefore is a potential cancer-specific target. β-Lapachone's therapeutic efficacy partially stems from the drug's induction of a futile NQO1-mediated redox cycle that causes high levels of superoxide and then peroxide formation, which damages DNA and causes hyperactivation of poly(ADP-ribose) polymerase, resulting in extensive NAD+/ATP depletion. However, the effects of this drug on energy metabolism due to NAD+ depletion were never described. The futile redox cycle rapidly consumes O2, rendering standard assays of Krebs cycle turnover unusable. In this study, a multimodal analysis, including metabolic imaging using hyperpolarized pyruvate, points to reduced oxidative flux due to NAD+ depletion after β-lapachone treatment of NQO1+ human pancreatic cancer cells. NAD+-sensitive pathways, such as glycolysis, flux through lactate dehydrogenase, and the citric acid cycle (as inferred by flux through pyruvate dehydrogenase), were down-regulated by β-lapachone treatment. Changes in flux through these pathways should generate biomarkers useful for in vivo dose responses of β-lapachone treatment in humans, avoiding toxic side effects. Targeting the enzymes in these pathways for therapeutic treatment may have the potential to synergize with β-lapachone treatment, creating unique NQO1-selective combinatorial therapies for specific cancers. These findings warrant future studies of intermediary metabolism in patients treated with β-lapachone.
Keywords: anaerobic glycolysis, drug metabolism, energy metabolism, isotopic tracer, nicotinamide adenine dinucleotide (NAD), nuclear magnetic resonance (NMR), oxidation-reduction (redox), oxidative stress, pyruvate, pyruvate dehydrogenase complex (PDC)
Introduction
Pancreatic ductal adenocarcinoma (PDA)7 is a recalcitrant cancer and has shown the least improvement in overall survival over the last 3 decades, increasing from only 2 to 6% (1). PDA is currently the fourth leading cause of cancer-related deaths and is expected to be the second leading cancer by 2030. Therefore, there is a desperate need to explore and develop novel therapeutic avenues for treating PDA (1, 2). Current treatment regimens lack tumor specificity, leading to off-target toxicity of vital organs (3). NAD(P)H:quinone oxidoreductase 1 (NQO1, EC 1.6.99.2) is a two-electron oxidoreductase involved in phase II detoxifying reactions. Increased NQO1 expression is observed in pancreatic intraepithelial neoplasia (4, 5), precursor lesions of pancreatic cancer. NQO1 is even further up-regulated in primary and malignant cancer cells, reaching a 12-fold increase in gene expression in pancreatic cancer tissue compared with normal pancreas (6–9). Catalase is an enzyme that protects the cell from oxidative damage and is found to be highly expressed in normal compared with tumor tissues (5). The ratio of NQO1/catalase expression in tumor versus normal tissue provides a unique therapeutic window for NQO1 bioactivatable drugs, not just in pancreatic cancers but also in other solid cancers, including non-small cell lung cancer and breast cancer (4, 5). Therefore, elevated expression of NQO1 not only acts as a potential diagnostic biomarker for disease progression (10, 11) but also provides an exploitable, tumor-specific target for PDA therapy (9, 12). β-Lapachone (β-lap, ARQ761 in clinical form) is an NQO1 bioactivatable drug that selectively kills NQO1+ PDA cells (13). β-Lap undergoes a futile NQO1-mediated redox cycle, where the drug forms an unstable hydroquinone that spontaneously regenerates to the parent compound in a two-step oxygenation process (Fig. 1a) (14, 15). This futile recycling produces elevated superoxide levels and eventually massive hydrogen peroxide (H2O2) concentrations that lead to substantial DNA damage and endoplasmic reticulum Ca2+ release. Eventually, the DNA repair enzyme, poly(ADP-ribose) polymerase 1 (PARP1), is overwhelmed with the extreme levels of DNA damage and, in the presence of nuclear Ca2+ levels, becomes “hyperactivated.” PARP1 hyperactivation results in dramatic losses of NAD+ pool into branched poly(ADP-ribose) polymers (16), causing a dramatic reduction of ATP availability, energy loss, and subsequent cell death (16–18). β-Lap has been tested for toxicity against over 300 NQO1+ non-small cell lung, pancreatic, breast, prostate, and head and neck cancer cell lines, showing the same 30–60-min minimum time of exposure for NQO1-dependent and NAD+/ATP-mediated programmed necrosis (4, 5, 16–25). NQO1+ cancer cells exposed to β-lap uniformly die in an NQO1-dependent manner (requiring ∼100 units) and in an oncogene driver- or passenger-independent manner, dying independently of p53, BAX, BCL2, or other tumor suppressor losses. Cell death is mediated by atypical proteolytic cleavage of p53 and PARP1 in a μ-calpain–dependent manner during programmed necrosis (14, 15, 26–29). The only known downstream effects on metabolism as a result of β-lap treatment involve GAPDH inhibition and an overall prolonged suppression of glycolysis, as noted by decreased glucose utilization and lactate production (4, 30).
Figure 1.

β-Lapachone mechanism of action. a, futile cycle of β-lap showing NQO1-mediated redox cycling and H2O2 PARP1 hyperactivation. Hyperactivation leads to dramatic NAD+ and subsequent ATP loss, which has severe downstream effects on metabolism in the cell. In normal cells, high levels of catalase neutralize the ROS produced. b, survival curve of MiaPaCa2 cells that were treated for 2 h with various doses of β-lap (μm) with or without the NQO1 inhibitor, DIC (50 μm) (n = 6). c, survival curve of MiaPaCa2 cells that were treated for 15 min with various doses of H2O2 (μm) (n = 6). d, total NAD+ and NADH levels at 30 min post-treatment of MiaPaCa2 cells treated for 2 h with various doses of β-lap (μm) with or without the NQO1 inhibitor, DIC (50 μm) (n = 6). e, total NAD+ and NADH levels at 30 min post-treatment of MiaPaCa2 cells treated for 15 min with various doses of H2O2 (μm) (n = 6). Data plotted in b–e are T/C ± S.E. (error bars). ***, p < 0.001; ****, p < 0.0001.
Some cancer cells consume glucose at a much higher rate compared with normal cells, but rather than converting all of it to CO2 through oxidative metabolism, a substantial fraction of carbon is converted to lactate and secreted (the Warburg effect) (31–33). The high rate of glycolytic flux in cancer cells results in the rapid conversion of pyruvate into lactate through lactate dehydrogenase (LDH), a reaction that helps regenerate NAD+ in the cell (32, 34, 35). Alteration or inhibition of LDH can result in disequilibrium in the redox state of the cell (36). LDH is up-regulated in several cancer cell types (37), and its high expression correlates with poor prognosis in cancer patients (34, 38).
Due to the depletion of NAD+ and ATP levels after exposure to β-lap, we hypothesize that treatment should result in a severe perturbation of energy metabolism in NQO1+ cancer cells. The resulting energy depletion indicative of β-lap action should be presaged by the breakdown of central carbon metabolism, seen specifically in reactions directly involved in glycolysis and the tricarboxylic acid (TCA) cycle. Isotopic labeling in these metabolites can be monitored via GC-MS and NMR spectroscopy. In addition, real-time metabolic turnover can be detected using hyperpolarized (HP) 13C-labeled substrates (39–43). Hyperpolarization of 13C-enriched metabolites using dynamic nuclear polarization (DNP) can increase the NMR signal by 10,000-fold or more (44, 45). Hyperpolarized [1-13C]pyruvate is a widely used probe for metabolic imaging due to its long T1 relaxation time (∼30–40 s at 9.4 T) and due to pyruvate being a centrally positioned molecule of intermediary metabolism (43). Because cancer cells display the Warburg effect, lactate derived from HP-pyruvate can be tracked to monitor cancer aggression and response to treatments in patients (46, 47). HP carbon imaging is safe for use in humans (48, 49), with multiple clinical trials currently under way.
Here, we report on the metabolic profiles of MiaPaCa2 pancreatic cancer cells after lethal and non-lethal doses of the chemotherapeutic drug, β-lapachone. NQO1+ MiaPaCa2 cells present a prototypical PDA phenotype associated with β-lapachone sensitivity (5). Data revealed an effect on glycolytic flux as well as a severe delay in lactate secretion. These results were corroborated using hyperpolarized [1-13C]pyruvate in cells, where it was evident that LDH-mediated label exchange was suppressed by β-lapachone exposure. In addition, lower NAD+ levels correlated with a reduction in TCA cycle turnover. These data strongly suggest that β-lap's effectiveness is not only related to the down-regulation of glycolytic flux and hyperactivation of PARP1 (16, 30), but also due to an overall lowering of glucose oxidation in the TCA cycle. These results, in turn, reveal recovery pathways that could be targeted for improved efficacy of β-lap therapies of NQO1+ pancreatic cancers. The synthesis of these analytical methods allowed unique insights into the mechanism of β-lap action that are not readily achieved using standard methods or a single modality alone. Our data show how drug effectiveness can be monitored in real time in cancer cells, as β-lap-exposed NQO1+ cancer cells attempt to restore homeostasis over time. The HP 13C NMR results are robust and suggest that in vivo monitoring of β-lap efficacy in humans should be possible.
Results
MiaPaCa2 cells exhibit lethality and severe NAD+/NADH loss after β-lapachone treatment
The mechanism of β-lap-induced lethality in NQO1+ cancer cells involves rapid generation of superoxide (120 mol/mol of β-lap in 2 min) (25), which leads to ROS formation in the form of H2O2 (Fig. 1a). Subsequent large-scale DNA damage hyperactivates PARP1 and depletes NAD+ (together with NADH) in the cell (13). MiaPaCa2 pancreatic cancer cells were treated with various doses of β-lap for 2 h, and cells showed lethality at ≥4 μm (Fig. 1b). Cell death happens in an NQO1-dependent manner, as dicoumarol (DIC, an NQO1 inhibitor) treatment or genetic NQO1 removal spares cells from lethality (4, 14, 16, 22). For comparison, cells were treated with various doses of H2O2 (15 min), giving an LD50 of ∼40 μm (Fig. 1c) and indicating that treatment with a much lower dose of β-lap can induce the lethality of 4–5 times the LD50 dose for H2O2, which can be spared by catalase overexpression (25). Analysis of total NAD+ and NADH levels after a 2-h treatment showed a β-lap dose-dependent loss of NAD+ and NADH that mirrored the lethality curve of MiaPaCa2 cells (Fig. 1d). A similar, although relatively minor, dose-dependent NAD+ and NADH loss was seen with high-dose H2O2 treatment (Fig. 1e). We hypothesize that the overwhelming loss of reducing equivalents in the cells ultimately would cause a drop in the intracellular NAD+/NADH ratio, affecting TCA cycle turnover. Henceforth, experiments performed to determine the metabolic signature after a β-lap treatment were dosed with 4–6 μm β-lap, a dose that would eventually cause lethality but, within the time frame of the experiments, should cause enough metabolic dysfunction to delineate the immediate role of β-lap in the metabolic landscape.
β-Lapachone perturbs glycolytic flux
GAPDH is the first NAD+-dependent reaction in glycolysis, and prior studies have shown that β-lap induces a post-translational modification of GAPDH and its inhibition due to ROS stress (30). However, this previous study did not directly assess changes in glycolysis. Therefore, we sought to quantitatively determine changes in glycolytic flux using tracer methods. To determine the effect of β-lap on glycolysis, glucose consumption and lactate secretion rates were simultaneously measured extracellularly. MiaPaCa2 cells were pretreated with medium containing 6 μm β-lap for 2 h. Medium was then removed and replaced with Dulbecco's modified Eagle's medium (DMEM) containing 10 mm glucose and 4 mm glutamine, but no β-lap. Extracellular levels of glucose (Fig. 2a) and lactate (Fig. 2b) in the medium were measured at 3, 12, and 24 h post-treatment. Although no statistical difference was detected in the level of glucose until 12–24 h post-treatment, β-lap-treated MiaPaCa2 cells had markedly reduced lactate medium levels within 3 h post-treatment (Fig. 2, a and b). Flux analysis indicated that MiaPaCa2 cells treated with β-lap had reduced glucose uptake by ∼26% compared with control treated cells and reduced lactate secretion by 57% (Fig. 2c). These data were consistent with the extracellular acidification rate (ECAR) measured 2 h post-treatment with 4 μm β-lap. Basal ECAR levels were lower in β-lap–treated MiaPaCa2 cells, which also did not respond to oligomycin treatment by increasing ECAR as control cells did (Fig. 2d). Oligomycin is an ATP synthase inhibitor that stimulates glycolysis through decreasing the ATP/ADP ratio (50). An increase in ECAR after the addition of oligomycin corresponds to the glycolytic reserve capacity of control cells and the absence of this reserve in β-lap-treated cells.
Figure 2.

Glucose to lactate flux is perturbed by β-lapachone treatment. NOVA analysis of extracellular medium following a 2-h treatment of β-lap (6 μm) in MiaPaCa2 cells showing overall glucose consumption (a) and lactate secretion (b) over time (n = 3). c, calculated flux, which shows an overall change in the glycolytic flux of glucose into lactate in cells treated with or without β-lap (6 μm). d, ECAR after β-lap (4 μm) treatment (n = 4). In d, the asterisk denotes significant changes by t test, although the entire time course was also significantly different, as determined using analysis of variance. *, p < 0.05; **, p < 0.01; ***, p < 0.001; ****, p < 0.0001. Error bars, S.E.
β-Lapachone impedes metabolism of glucose-derived pyruvate into the TCA cycle
Utilization of uniformly labeled glucose ([U-13C]Glc) as a tracer in β-lap-treated MiaPaCa2 cells enables the observation of its conversion to many downstream metabolites (Fig. 3a). Initial analysis of the labeling patterns 2 h after a 4 μm β-lap treatment in MiaPaCa2 cells showed a decrease in the m+3 isotopomer of lactate (Fig. 3b), consistent with previously observed lower lactate secretion (Fig. 2, b–d). Furthermore, the m+2 (and higher) isotopomers of citrate were lower in β-lap-treated MiaPaCa2 cells (Fig. 3c), suggesting that altered glycolytic metabolism was accompanied by reduced glucose oxidation in the TCA cycle; the mass isotopomers of other TCA cycle metabolites confirmed this observation (Fig. 3d and supplemental Fig. S1).
Figure 3.

Labeling of TCA cycle intermediates. a, [U-13C]glucose pathway showing labeling patterns of downstream metabolites. b and c, labeling isotopomer patterns of lactate (b) and citrate (c) after 2 h of [U-13C]glucose. MiaPaCa2 cell plates were incubated with 10 mm [U-13C]glucose after a 2-h β-lap (4 μm) treatment, with or without dicoumarol (50 μm). d, heat map of average (n = 2) mass isotopomer distribution measured at 2 h after treatment. Data are expressed as z-score (row-standardized). *, p < 0.05. Error bars, S.D.
To evaluate whether β-lap–induced metabolic perturbations are not MiaPaCa2 cell–specific and are reproducible, we performed a separate series of [U-13C]Glc labeling experiments using a set of different cancer cell lines: A549 (lung carcinoma), HCT116 (colon carcinoma), and two variants of 231 (breast carcinoma) cells; NQO1-positive (231+) and NQO1-negative (231−). The presence of NQO1 protein was verified by Western blotting in all cell lines used except for the NQO1−cell line (231−) (Fig. 4a). Among other isotopomers, we monitored lactate m+3 and citrate m+2 that report perturbations in glycolysis and TCA cycle. All NQO1-positive cells showed a statistically significant reduction in the labeling of lactate m+3 (Fig. 4b) and citrate m+2 (Fig. 4c) upon β-lap treatment. This perturbation was NQO1-dependent, as 231 NQO1− cells were unaffected by the treatment. Finally, HCT116 cells that are characterized by low NQO1 expression relative to other tested cell lines showed only a mild response to β-lap. β-Lapachone metabolic effects were independent of the p53 status of treated cells (Fig. 4a).
Figure 4.

β-Lapachone exhibit conservative mechanism of action. a, Western blotting of NQO1 in different cell lines: A549 (lung carcinoma), MiaPaCa2 (pancreatic carcinoma), HCT116 (colon carcinoma), and two variants of 231 (breast carcinoma) cells; NQO1-positive (231 NQO1+) and NQO1-negative (231 NQO1−). b and c, labeling of lactate (b) and citrate (c) from [U-13C]Glc in different cells. *, p < 0.05. Error bars, S.D.
Of note, both a lethal dose of β-lap and high-dose H2O2 treatments cause PARP1 hyperactivation (16) and NAD+ losses (Fig. 1, d and e); however, a 600 μm H2O2 treatment did not alter the labeling of lactate over time when compared with control treated cells (Fig. 5a). Thus, although H2O2 treatment acts as a control for the oxidation of GAPDH, the effects on lactate production are observed only after a lethal dose of β-lap in NQO1+ cells.
Figure 5.
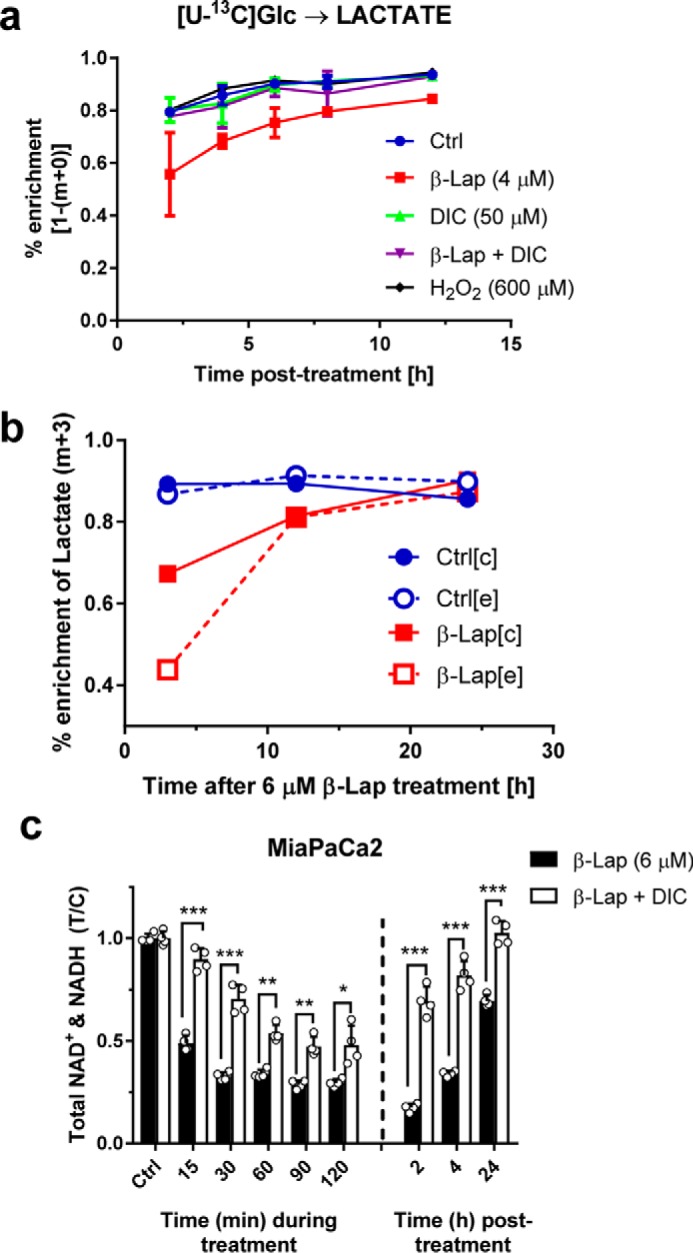
Recovery after β-lap treatment. a, time course of labeled lactate isotopomers over 12 h. b, time course showing intracellular (c) versus extracellular (e) labeling of lactate (m+3) from a [U-13C]glucose substrate. c, total NAD+ and NADH levels either during or after treatment of 6 μm β-lap with or without DIC (50 μm) in MiaPaCa2 cells. Error bars, S.D.
Cells restore metabolic homeostasis after β-lapachone treatment
To further investigate whether impaired glucose metabolism following β-lap treatment is a transient or permanent phenomenon, MiaPaCa2 cells were treated with or without β-lap (4 μm) and subsequently exposed to [U-13C]Glc. Labeling was tracked over a 12-h period and revealed that, whereas there is an initial delay of labeling of lactate in β-lap–treated cells, cells partially reverse this metabolic phenotype with time (Fig. 5a). The labeling of citrate m+2, which reports pyruvate dehydrogenase (PDH) flux, showed that β-lap-treated MiaPaCa2 cells decreased labeling initially but restored a labeling equilibrium by 4 h (supplemental Fig. S2a). Furthermore, similar to the labeling of lactate in Fig. 5a, an analogous labeling pattern is seen in β-lap-treated MiaPaCa2 cells with other metabolites (supplemental Fig. S2, b–d).
Subsequent experiments increased the β-lap dosage and recovery time simultaneously. [U-13C]Glc-labeled cellular and medium extracts were collected at 3, 12, and 24 h after a 2-h β-lap (6 μm) pretreatment (Fig. 5b). The isotopomers at 3 h post-treatment revealed that the lactate m+3 was decreased in β-lap–treated cells, which could be a result of differences in either LDH flux or intracellular lactate pool sizes. Surprisingly, unlike in control cells, β-lap treatment resulted in the substantial decrease of the extracellular labeling of lactate m+3 compared with intracellular percentage enrichment (Fig. 5b and supplemental Fig. S3a). These data suggest a delayed ability of β-lap–treated MiaPaCa2 cells to secrete lactate, independent from its intracellular pool size, indicating a possible perturbation in lactate transport. After 12–24 h, lactate m+3 isotopomers in both control and β-lap–treated cells were similarly labeled (Fig. 5b and supplemental Fig. S3 (b and c)). Despite severe metabolic changes induced by β-lap treatment, MiaPaCa2 cells can regain metabolic homeostasis after a period of time (Fig. 5 (a and b) and supplemental Figs. S2 and S3 (a–c)). Because the initial changes are postulated to be due to depleted NAD+ levels in the cells after treatment, the NAD+ and NADH levels were monitored during and after β-lap treatment. NAD+ levels were restored almost fully to their initial basal levels within 24 h (Fig. 5c). These results suggest that β-lap metabolic effects are transient, and the LDH activity can be used as a proxy for β-lap treatment efficacy. Overall, our results indicate that β-lap treatment impairs glucose utilization in MiaPaCa2 cells. The distinct effects on TCA cycle metabolism are harder to elucidate using glucose as a tracer because reduced citrate labeling could result from reduced conversion of glucose to pyruvate via glycolysis.
Metabolism of hyperpolarized [1-13C]pyruvate shows a decrease in overall flux of pyruvate to lactate despite increased intracellular lactate pool
To obtain a more complete readout of the metabolic consequences of β-lap treatment in NQO1+ PDA cells, we examined factors that contribute to altered pyruvate metabolism. We tested whether the decrease in lactate secretion was due to alterations in LDH protein levels by Western blot analysis but found that LDH protein steady-state levels were not affected by β-lap treatment in MiaPaCa2 cells (Fig. 6a). Decreased lactate secretion (Fig. 2c) may also be a direct result of an upstream blockade at the level of GAPDH and/or a lack of NAD+/NADH for the reaction catalyzed by LDH (4, 30). To test this, we utilized a pyruvate tracer that is a direct substrate of the LDH reaction, bypassing glycolysis. Labeled carbon from hyperpolarized [1-13C]pyruvate can be passed to new metabolites by either exchange or net flux (Fig. 6b) and can be detected by 13C NMR. MiaPaCa2 cells were treated with or without β-lap (6 μm) for 90 min and examined in situ by administration of hyperpolarized [1-13C]pyruvate (final concentration of 6 mm) and immediate 13C NMR data collection. Besides pyruvate and pyruvate hydrate resonances, lactate, alanine, and bicarbonate signals were detected in both treatment groups (Fig. 6c).
Figure 6.

β-Lapachone inhibits LDH and PDH reactions. a, Western blotting of LDH-A in MiaPaCa2 cells, with or without β-lap (2.5 or 6 μm) treatment, with or without DIC (50 μm) and H2O2 (300 μm). b, pathway showing labeling patterns of direct downstream metabolites from [1-13C]pyruvate: [1-13C]lactate generated through LDH, [1-13C]alanine generated through alanine transaminase (ALT), and [1-13C]bicarbonate generated through PDH. c, 13C summation spectra showing detection of the downstream metabolites after injection of hyperpolarized [1-13C]pyruvate in control (top) MiaPaCa2 cells and β-lap (6 μm)-treated (bottom) MiaPaCa2 cells after a 90-min treatment. d, summed signal area of lactate (left) and bicarbonate (right). e, lactate time courses for control and β-lap (6 μm)-treated cells. Data were simulated using a 2-pool kinetic model (dashed lines). f, LDH k1 (left) and flux (right) calculated based on the fitting of the real-time signal evolution from e between the control and β-lap treatment groups (n = 4). g, OCR measurement 2 h after β-lap (4 μm) exposure; differences at all time points are statistically significant. h, fractional enrichment and intracellular pools of lactate calculated using 1H NMR after hyperpolarized [1-13C]pyruvate experiments. *, p < 0.05; **, p < 0.01. Error bars, S.D.
As expected, lactate was the most abundant product of pyruvate metabolism in both the control and β-lap–treated MiaPaCa2 cells, although the total lactate signal was higher in control cells. Both lactate and bicarbonate signal areas showed a major decrease after β-lap treatment (Fig. 6d). 13C NMR time courses were fit to a kinetic model involving both the rate of polarization decay and metabolic reaction rates (Fig. 6e). The estimated k1 was significantly lower in β-lap-treated versus control cells (Fig. 6f). Models that describe pyruvate-lactate exchange are not necessary for correct quantification of k1 if the initial concentration of pyruvate is known (51). Therefore, decreased lactate production seen previously is not only due to decreased flux through glycolysis (supplemental Figs. 3b and 5a), but also to an inability of LDH to reduce pyruvate (Fig. 6, c–f). Flux through the PDH reaction (which also requires NAD+) could not be determined using a similar approach due to very low signal/noise ratio of the bicarbonate signal (at ∼160 ppm), which made it impossible to reliably quantify the time course of this metabolite. However, as shown in the case of lactate, summation of the DNP 13C NMR signal area of the product is proportional to the reaction rate in which it was generated (Fig. 6d) (52). Thus, lower summed bicarbonate signal suggests decreased PDH flux. Note that this assessment of PDH activity, in which the substrate is hyperpolarized [1-13C]pyruvate, is independent of β-lap's effects on glycolysis, as this pathway is effectively bypassed.
If oxidative flux is truly inhibited by β-lap treatment, a concomitant drop in O2 consumption rate (OCR) is expected. As detailed previously, β-lap treatment results in a dramatic burst of OCR associated with the NQO1 futile redox cycle, but this effect recedes ∼2 h after treatment. Indeed, 2 h after β-lap exposure, OCR is significantly down-regulated (Fig. 6g). Thus, GC-MS, hyperpolarized 13C NMR, and OCR measurements are in excellent conceptual agreement.
After the hyperpolarized [1-13C]pyruvate NMR experiments, cells were quenched and extracted for a proton NMR metabolomics analysis. Due to the incorporation of 13C atoms, the proton-carbon coupling can be observed in 1H NMR spectra, and therefore, percentage enrichment from the [1-13C]pyruvate bolus can be estimated (supplemental Fig. S4, a and b). Surprisingly, enrichment of lactate (Fig. 6h) and alanine (supplemental Fig. S4d) was unchanged using this short exposure time (∼5 min). An investigation of intracellular metabolite levels revealed a significant increase of the lactate concentration in β-lap–treated MiaPaCa2 compared with control cells, which was consistent for both labeled and unlabeled pools but was not seen for alanine (supplemental Fig. S4, c and d). These data show how overall LDH flux is decreased, most likely due to NAD+ depletion after β-lap treatment (Fig. 1d), despite an increased intracellular lactate pool. These results are probably related to delayed lactate secretion found previously (Fig. 2b and supplemental Fig. S3 (a–c)) and potentially to perturbations in lactate transport (Fig. 5b).
Metabolomics analysis shows global metabolite changes after β-lapachone treatment
The use of proton NMR-based metabolic profiling allows for the rapid identification of major metabolic changes in biological samples. Initially, an untargeted chemometric analysis (using complete 1H NMR profiles) was performed to test for outliers and evaluate levels of variance in the data set (supplemental Fig. S5, a–c). Discriminant analyses highlighted many resonances strongly contributing to separation between control and β-lap–treated cells (supplemental Fig. S5, d and e). Some of those signals were identified and subjected to the targeted analysis. A total of 31 signals corresponding to various metabolites were quantitatively analyzed by global spectral deconvolution procedures. A table of quantified variables normalized to protein content of cell extracts was then used for a principal component analysis (PCA). Subsequent data clustering provided good separation between groups, indicating the existence of major differences in the metabolic composition of β-lap–treated and control MiaPaCa2 cells (Fig. 7, a and b). As expected, a severe NAD+ decrease was observed in β-lap–treated cells (Fig. 7c). NAD+ clustered together with other adenine nucleotides, highlighting overall energy depletion upon treatment (Fig. 7b and supplemental Fig. S5e).
Figure 7.

Analysis of metabolites quantified using 1H NMR in cell extracts after hyperpolarization experiment. a, PCA score plot. b, heat map and cluster analysis. c, intracellular abundance of NAD+. d, intracellular Glu/Gln ratio. e, intracellular amino acids detected using NMR plotted as T/C ± S.D. (error bars). Blue, control; red, β-lap (n = 4). *, p < 0.05; **, p < 0.01.
Surprisingly, the concentrations of many amino acids were also significantly increased. The glutamate/glutamine ratio (Fig. 7d) may be altered due to NAD+ depletion, because the enzyme glutamate dehydrogenase is NAD+/NADH-dependent. Moreover, branched chain amino acids (isoleucine and valine) exhibited similar increases in β-lap–treated cells as aromatic amino acids (phenylalanine and tyrosine) and threonine and glutamine (Fig. 7e). This implies that β-lap is causing changes not only in glycolysis and TCA cycle metabolism, but also in overall amino acid metabolism.
Discussion
β-Lapachone is a promising drug for selective treatment of not only pancreatic cancers, but many other solid NQO1+ tumors due to the conservative mechanism of action of the drug (5). Previously, we showed that β-lap causes NQO1-dependent cell death and NAD+/NADH losses in MiaPaCa2 cells due to PARP1 hyperactivation responses, which subsequently causes alterations in metabolic homeostasis (5, 16). Other studies have demonstrated that NQO1 knock-out or dicoumarol–co-treated cells are resistant to β-lap (5), and stable NQO1 shRNA-knockdown cells are highly resistant. The same effect is seen in stable shNQO1 knockdown MiaPaCa2 cells, which are also spared from β-lap toxicity (17).
In this study, we investigated the effects of β-lap treatment on central carbon metabolism in MiaPaCa2 cells, which exhibit a prototypical phenotype of β-lap sensitivity to NQO1+ cancer cells. Changes in secreted lactate levels (Fig. 2, b and c) led to the investigation of the intracellular flow of glucose through glycolysis into the TCA cycle. The use of [U-13C]glucose and GC-MS isotopomer analysis produces a direct assay of glycolytic flux. This approach was especially advantageous at time scales when, due to the mechanism of action of β-lap, OCR cannot be used as an indicator of TCA cycle turnover. We have shown that the labeling of TCA cycle intermediates, especially citrate m+2 (i.e. PDH activity), was significantly perturbed in β-lap–treated cells, as well as the labeling of lactate. Similarly, decrease in labeling of lactate m+3 and citrate m+2 was true for other cancer cell lines expressing NQO1 but could not be detected in NQO1-negative 231 cells (Fig. 4). Observed perturbations in labeling of lactate and TCA cycle intermediates could be a result of either a blockade at the level of GAPDH (30) or the lack of the NAD+ cofactor for the LDH and PDH reactions.
Further analysis using hyperpolarized [1-13C]pyruvate revealed that the activity of LDH itself is affected by β-lap treatment. This suggests that the altered redox state of the cell and, subsequently, LDH activity is due to decreased levels of NADH (Fig. 1d) and is not a result of altered abundance of either LDH protein or intracellular lactate levels (Fig. 6, a and h). Therefore, the decrease in LDH flux is potentially not only due to GAPDH inhibition (reported by Moore et al. (30) and observed in Figs. 2 and 3) but also due to an inability to effectively metabolize pyruvate. Additionally, using the bicarbonate integral (Fig. 6d) together with the previously obtained labeling of citrate from [U-13C]glucose and OCR measurements conducted 2 h post-treatment, we concluded that PDH flux is indeed ablated as a result of treatment and behaves independently of β-lap's effect on upstream reactions of glycolysis. Although many cancers are highly glycolytic (including the MiaPaCa2 cell line), proper TCA cycle function remains critical for cells, if not for energy production then for maintaining anabolic intermediates of central carbon metabolism and a constant supply of the crucial lipogenic substrate, citrate. Our observations of decreased TCA cycle activity indicate that β-lap effects are not compartment-specific and affect both the cytosol and mitochondria and thereby cause an even more severe burden to the cellular metabolism than sole inhibition of glycolysis. Therefore, another component of the efficacy of β-lapachone is proven.
Our results highlight the benefit of using multiple tracers to read out metabolic activity and determine the metabolic phenotype of cancer cells exposed to β-lap. A similar phenomenon has been observed in isolated mouse hearts, where labeled glucose goes primarily to lactate, whereas hyperpolarized pyruvate enters the mitochondria to participate in TCA cycle metabolism (53). In this case, our hyperpolarization data corroborate the effects we see from [U-13C]glucose data (Fig. 3), but were able to provide a much more detailed perspective on the lactate kinetics occurring in these cells.
Finally, utilization of hyperpolarization NMR technology allowed us to detect, in a non-invasive manner, the metabolic response of β-lap–treated cells. This method, using [1-13C]pyruvate in particular, has been successfully applied for imaging of the metabolism in animals and only recently in human patients (54, 55). Therefore, our findings using hyperpolarized [1-13C]pyruvate in MiaPaCa2 cells can be translated into a clinical setting, where the measurement of hyperpolarized [1-13C]lactate can be used as a proxy for tumor aggressiveness, as well as a direct readout of drug efficacy in real-time in patients with tumors. This is especially important because our data indicate that β-lap–exposed NQO1+ cancer cells attempt to restore homeostasis (as shown by increasing NAD+/NADH levels as a function of time post-treatment), and monitoring of treatment efficiency may be required.
In summary, the multimodal metabolic analysis here provided evidence that β-lap treatment affects many processes, including glycolysis, lactate secretion, TCA cycle, and amino acid metabolism. Most likely, the nature of observed changes due to treatment is directly related to NAD+ depletion. Whereas this analysis does not by any means cover all metabolic perturbations, it provides crucial insight into the mechanism of β-lap action. The understanding of these affected pathways and how they contribute to recovery processes may be advantageous for upcoming combined therapies (56). In conclusion, these findings warrant future studies focused on intermediary metabolism of β-lap–treated patients.
Experimental procedures
All data and material are available upon request.
Cell culture
A549, HCT116, MDA-MB-231, and MiaPaCa2 cells were obtained from American Tissue Culture Collection (ATCC, Manasas, VA). 231NQO1+ and 231NQO1− stable cell lines were generated as described elsewhere (60). Cells were cultured under 5% CO2, 95% air atmosphere at 37 °C in DMEM (Life Technologies, Inc., Carlsbad, CA) containing 10% FBS (Hyclone, Thermo Scientific, Logan, UT). Cells were tested and were mycoplasma-free. For metabolism and NMR experiments, base DMEM (Sigma-Aldrich) was prepared from powder and supplemented with 10% dialyzed FBS, 4 mm glutamine, 42.5 mm sodium bicarbonate, 25 mm HEPES, 9 mm sodium hydroxide, 10 units/ml penicillin, and 10 μg/ml streptomycin, pH 7.4. Glucose or pyruvate was added as indicated for each experiment.
NQO1 enzyme activity assays
NQO1 enzyme activities for the cell lines were measured as dicoumarol-inhibited units (14, 17).
Chemicals and reagents
β-Lap was synthesized as described (14), and stock solutions were prepared at 50 mm in DMSO. Dicoumarol, Hoechst 33258, and hydrogen peroxide were purchased from Sigma-Aldrich.
DNA survival assays
Cells were seeded at 10,000 cells/well in a 48-well plate and allowed to attach overnight. Cells were then treated for 2 h with β-lap (0–10 μm), with or without dicoumarol (50 μm) in 6 replicates/dose. After 2 h, the drug was removed and replaced with 1 ml of 10% FBS DMEM. After ∼7 days (or until 90% confluence for the untreated control), the medium was removed, and cells were washed with 1× PBS. The PBS was discarded, and 250 μl of distilled H2O was added to each well. Cells were lysed by the freeze-thaw method and stained with 500 μl of Hoechst dye (from a stock of 50 μl of Hoechst 33258 (Sigma-Aldrich, 14530) in 50 ml of 1× TNE buffer), and cells were incubated in the dark for 2 h at room temperature. DNA content was quantified by fluorescence (460 nm) in a Victor X3 plate reader (PerkinElmer Life Sciences), and readings were plotted as treated/control (T/C) ± S.E.
NAD+/NADH quantification
NAD+/NADH (NAD/NADH Glo) were assayed at the indicated time points after treatments, as depicted using assay protocols developed previously (Promega, Madison, WI). All raw luminescent values for treatment conditions were normalized to signals from untreated cells (T/C). Standard curves were generated to ensure linearity as described by the manufacturer.
Western blot analysis
Cells were lysed in ice-cold radioimmune precipitation buffer with protease and phosphatase inhibitors (Santa Cruz Biotechnology, Inc., Dallas, TX). Whole-cell extracts were prepared by centrifugation (14,000 rpm, 15 min) to remove insoluble components. Protein concentrations were determined by using a BCA assay (Thermo Scientific, Waltham, MA), and loading volumes were normalized. Proteins were then separated by a 4–20% gradient SDS-polyacrylamide gel (Bio-Rad) and transferred to PVDF membranes. Primary antibodies for protein detection included NQO1 (monoclonal mouse, 3187S, Cell Signaling Technology), LDH-A (polyclonal rabbit, 2012S, CST), p53 (mouse monoclonal, sc-126, Santa Cruz Biotechnology), and α-tubulin (monoclonal mouse, DM1A, Sigma). Primary hybridizations were performed in Sigma 1× casein blocking buffer at 4 °C overnight. Secondary HRP-conjugated antibodies were incubated for 1 h at room temperature, followed by detection with SuperSignal West Pico (Thermo Scientific). Bands were quantified by mean intensity using ImageJ (National Institutes of Health) and normalized to tubulin.
Metabolite analysis
Cell culture medium samples were taken at 0, 3, 12, and 24 h after a 2-h β-lap (6 μm) treatment. To measure the rates of metabolite consumption/secretion in the medium, glucose, lactate, glutamine, and glutamate were measured using a BioProfile Basic 4 analyzer (NOVA Biomedical, Waltham, MA). Extracellular consumption and secretion fluxes were calculated using ETA (57).
OCR and ECAR estimations
Log-phase MiaPaCa2 cells were exposed to β-lapachone (4 μm) and monitored after 2-h exposures for OCR and ECAR rates using mitochondrial stress responses within seahorse assays, as reported previously (4, 24, 30).
GC-MS
Cells were seeded at 800,000 cells/plate in 10-cm dishes and allowed to attach and grow until 80–90% confluence. Cells were then treated with either DMSO (control) or β-lap (6 μm) for 2 h. The cells were washed with 1× PBS and then overlaid with 10 ml of base DMEM containing 10% dialyzed FBS, 4 mm glutamine, and 10 mm [U-13C]Glc (Cambridge Isotope Laboratories Inc., Tewksbury, MA).
For TMS derivatization, at the indicated time points, the medium was removed, and the cells were rinsed briefly in cold 1× PBS. One ml of cold methanol/water (1:1, v/v) solution was added to the cells, and the cells were lysed using repeated freeze-thaw cycles. After centrifugation to remove cell debris (14,000 rpm for 10 min), the supernatant was collected, 10 μl of 10 mm sodium oxybutarate (internal standard) was added to each sample, and samples were air-dried on a heat block at 42 °C. After evaporation, 125 μl of Tri-Sil HTP reagent (Thermo Scientific, Waltham, MA) was added to derivatize the samples and incubated for ∼1.5–2 h at 42 °C. For tert-butyldimethylsilyl derivatization, at the indicated time points, the medium was collected and frozen at −80 °C, and the cells were washed twice in cold 1× PBS. One ml of cold methanol (100%) and 10 μl of 2 mm norvaline internal standard were added to the cells. The cells were scraped off the dish and transferred into a vial containing 2 ml of cold water, 2 ml of cold CHCl3 (1:1, v/v), and cells were frozen at −80 °C. After thawing, each sample was vortexed ∼15–20 min while samples were kept on ice. Samples were centrifuged at 3000 rpm for 20 min at 0 °C to create aqueous (top) and organic (bottom) layers. The aqueous layers of all samples were collected and air-dried on a heat block at 42 °C. After evaporation, 50 μl of MOX reagent (Thermo Scientific, Waltham, MA) was added to derivatize the samples and incubated for ∼1 h at 42 °C, followed by the addition of 100 μl of N-tert-butyldimethylsilyl-N-methyltrifluoroacetamide (TBDMS) reagent (Thermo Scientific, Waltham, MA). Each sample was incubated for ∼1 h at 70 °C and then transferred into a GC-MS vial. An aliquot of each sample (1–3 μl) was injected onto an Agilent 6970 gas chromatograph networked to an Agilent 5973 mass-selective detector. Fragment ion m/z for selected metabolites (for both TMS and tert-butyldimethylsilyl derivatization) were determined as described (58). The measured distribution of mass isotopomers was corrected for the natural abundance of 13C as described (59).
Hyperpolarization NMR experiments
Cells were grown to ∼80–90% confluence in 150-mm dishes and then treated either with or without 6 μm β-lap for 90 min; cells were then trypsinized, washed, and resuspended in 800 μl of base DMEM containing 10% dialyzed FBS, 4 mm glutamine, 0 mm glucose (to prevent tracer dilution by glucose-derived pyruvate), and standard concentrations of other amino acids. Cell suspensions were transferred to a 10-ml syringe with a catheter attached, and the cells were kept at 37 °C while in the catheter using a circulating water bath. A solution of [1-13C]pyruvic acid (Cambridge Isotope Laboratories) containing OX063 trityl radical (15.25 mm) and Gd3+ (1 mm) was freshly prepared for hyperpolarization. An aliquot of 9.3 μl was placed in an Oxford HyperSense DNP system operating at 3.35 T. Polarization was carried out for ∼90 min at 1.05 K with a microwave irradiation frequency of 94.096 GHz at 100 milliwatts. The frozen sample was then dissolved in 4 ml of PBS (pH 7.4), 1 mm EDTA. A 200-μl aliquot of the hyperpolarized solution was transferred into a 5-mm NMR tube and immediately lowered into the NMR spectrometer. At time 0 of acquisition, 800 μl of cell suspension was added and mixed with the hyperpolarized solution in the NMR tube, resulting in a final concentration of 6 mm [1-13C]pyruvic acid in 1 ml (51).
The 13C spectra were acquired using a 14.1 T (150-MHz 13C frequency) Bruker spectrometer equipped with a 10-mm CryoProbe. Acquisition was carried out for 96 consecutive 1-pulse scans, using the following parameters: flip angle = 10.714º, acquisition time = 0.937 s, relaxation delay = 0.899 s. Spectra were referenced, phase- and baseline-corrected, and integrated using TopSpin version 3.1 software. The initial six scans were excluded from the analysis due to signal distortion arising from mixing of the cell suspension in NMR tube. The table of peaks were exported to the Matlab environment, where further calculations were performed. The peak table was normalized to total signal area.
1H NMR metabolomics experiments
After hyperpolarization, cells were immediately transferred from the NMR tube and quenched with ice-cold saline solution (0.9% NaCl), and the cell suspension was put on ice to halt further metabolism. Cells were then centrifuged, and supernatants were collected and frozen at −80 °C. The remaining cell pellet was washed with cold saline solution and spun down again, and the resulting pellet was frozen at −80 °C. For intracellular metabolite extractions, cell pellets (30–50 million cells) were suspended in ice-cold CHCl3/MeOH solution (2:1, v/v) and mixed vigorously. Samples were placed in an ultrasonic water bath for 5 min, and then 2-ml aliquots of ice-cold saline (0.9% NaCl) were added to each sample and mixed again. To separate the polar and lipid phases, solutions were centrifuged at 1000 × g for 3 min at 4 °C. The top phase containing polar metabolites was collected and evaporated at 30 °C under air. The dried extracts were stored at −20 °C. Before measurements, the extracts were reconstituted in 200 μl of 0.1 m phosphate buffer solution (99.9% D2O), pH 7.0, containing 0.54 mm trimethylsilyl propionate as an internal standard. The samples were vortexed and centrifuged at 14,500 rpm for 1 min, and the supernatant was transferred into 3-mm NMR tubes.
Metabolic profiling was performed using a METNOESY pulse sequence (supplemental Fig. S6). The parameters were as follows: 4 steady state scans, 0.01-s initial delay (d1), 0.99-s presaturation delay, 0.1-s mixing time, 4-s acquisition time. A 90° pulse was calibrated, taking into account all metabolite resonances. The spectra were acquired for 128 scans using the 14.1 T Bruker NMR spectrometer. 1D NMR spectra were zero-filled to 65,536 points, apodized using 0.3-Hz line broadening, manually baseline-corrected, and referenced to trimethylsilyl propionate signal at δ = 0 ppm. Metabolites were identified based on previously reported assignments, ChenomX metabolite library, and statistical total correlation spectroscopy analysis. Signals were quantified using the global spectral deconvolution algorithm (MestReNova software version 11.0). Summed multiples were adjusted for number of corresponding protons and normalized to protein content.
Chemometric analysis
For untargeted profiling, 1H NMR spectra were binned into 8411 variables (using a 0.001-ppm binning step), normalized to protein content, and Pareto-scaled. Multivariate data analysis was conducted in SIMCA P+ software using PCA, PLS-DA, and OPLS-DA models. For targeted analysis based on the table of quantified signals, Metaboanalyst version 3.0 was used. Heat maps were created in Matlab.
Statistical analysis
Unless otherwise noted, graphs were plotted as means, with bars denoting S.D. Curve fitting and calculation of LD50 values, analysis of variance, and two-tailed Student t tests for statistical significance were performed in GraphPad Prism version 6.0.
Author contributions
M. A. S., S. D., R. J. D., D. A. B., and M. E. M. designed the experiments. M. A. S., S. D., N. S., R. A. E., J. S., X. L., and M. E. M. performed experiments and analyzed data. M. A. S., S. D., and M. E. M wrote the paper. M. S. B., S. C. B., R. J. D., D. A. B., and M. E. M. advised and supervised all experiments. All authors analyzed the results and approved the final version of the manuscript.
Supplementary Material
R. J. D. is an advisor for Agios Pharmaceuticals. D. A. B. is an advisor for Systems Oncology. The content is solely the responsibility of the authors and does not necessarily represent the official views of the National Institutes of Health.
This article contains supplemental Figs. S1–S6.
- PDA
- pancreatic ductal adenocarcinoma
- NQO1
- NAD(P)H:quinone oxidoreductase 1
- β-lap
- β-lapachone
- LDH
- lactate dehydrogenase
- TCA
- tricarboxylic acid
- HP
- hyperpolarized
- DNP
- dynamic nuclear polarization
- T
- tesla(s)
- ROS
- reactive oxygen species
- DIC
- dicoumarol
- ECAR
- extracellular acidification rate
- PDH
- pyruvate dehydrogenase
- OCR
- O2 consumption rate
- PCA
- principal component analysis
- T/C
- treated/control.
References
- 1. Siegel R., Ma J., Zou Z., and Jemal A. (2014) Cancer statistics, 2014. CA Cancer J. Clin. 64, 9–29 [DOI] [PubMed] [Google Scholar]
- 2. Rahib L., Smith B. D., Aizenberg R., Rosenzweig A. B., Fleshman J. M., and Matrisian L. M. (2014) Projecting cancer incidence and deaths to 2030: the unexpected burden of thyroid, liver, and pancreas cancers in the United States. Cancer Res. 74, 2913–2921 [DOI] [PubMed] [Google Scholar]
- 3. Kern S. E., Shi C., and Hruban R. H. (2011) The complexity of pancreatic ductal cancers and multidimensional strategies for therapeutic targeting. J. Pathol. 223, 295–306 [DOI] [PMC free article] [PubMed] [Google Scholar]
- 4. Chakrabarti G., Silvers M. A., Ilcheva M., Liu Y., Moore Z. R., Luo X., Gao J., Anderson G., Liu L., Sarode V., Gerber D. E., Burma S., DeBerardinis R. J., Gerson S. L., and Boothman D. A. (2015) Tumor-selective use of DNA base excision repair inhibition in pancreatic cancer using the NQO1 bioactivatable drug, β-lapachone. Sci. Rep. 5, 17066. [DOI] [PMC free article] [PubMed] [Google Scholar]
- 5. Huang X., Motea E. A., Moore Z. R., Yao J., Dong Y., Chakrabarti G., Kilgore J. A., Silvers M. A., Patidar P. L., Cholka A., Fattah F., Cha Y., Anderson G. G., Kusko R., Peyton M., et al. (2016) Leveraging an NQO1 bioactivatable drug for tumor-selective use of poly(ADP-ribose) polymerase inhibitors. Cancer Cell 30, 940–952 [DOI] [PMC free article] [PubMed] [Google Scholar]
- 6. Belinsky M., and Jaiswal A. K. (1993) NAD(P)H:quinone oxidoreductase1 (DT-diaphorase) expression in normal and tumor tissues. Cancer Metastasis Rev. 12, 103–117 [DOI] [PubMed] [Google Scholar]
- 7. Cresteil T., and Jaiswal A. K. (1991) High levels of expression of the NAD(P)H:quinone oxidoreductase (NQO1) gene in tumor cells compared to normal cells of the same origin. Biochem. Pharmacol. 42, 1021–1027 [DOI] [PubMed] [Google Scholar]
- 8. Joseph P., Xie T., Xu Y., and Jaiswal A. K. (1994) NAD(P)H:quinone oxidoreductase1 (DT-diaphorase): expression, regulation, and role in cancer. Oncol. Res. 6, 525–532 [PubMed] [Google Scholar]
- 9. Logsdon C. D., Simeone D. M., Binkley C., Arumugam T., Greenson J. K., Giordano T. J., Misek D. E., Kuick R., and Hanash S. (2003) Molecular profiling of pancreatic adenocarcinoma and chronic pancreatitis identifies multiple genes differentially regulated in pancreatic cancer. Cancer Res. 63, 2649–2657 [PubMed] [Google Scholar]
- 10. Awadallah N. S., Dehn D., Shah R. J., Russell Nash S., Chen Y. K., Ross D., Bentz J. S., and Shroyer K. R. (2008) NQO1 expression in pancreatic cancer and its potential use as a biomarker. Appl. Immunohistochem. Mol. Morphol. 16, 24–31 [DOI] [PubMed] [Google Scholar]
- 11. DeNicola G. M., Karreth F. A., Humpton T. J., Gopinathan A., Wei C., Frese K., Mangal D., Yu K. H., Yeo C. J., Calhoun E. S., Scrimieri F., Winter J. M., Hruban R. H., Iacobuzio-Donahue C., Kern S. E., et al. (2011) Oncogene-induced Nrf2 transcription promotes ROS detoxification and tumorigenesis. Nature 475, 106–109 [DOI] [PMC free article] [PubMed] [Google Scholar]
- 12. Ross D., and Siegel D. (2004) NAD(P)H:quinone oxidoreductase 1 (NQO1, DT-diaphorase), functions and pharmacogenetics. Methods Enzymol. 382, 115–144 [DOI] [PubMed] [Google Scholar]
- 13. Ough M., Lewis A., Bey E. A., Gao J., Ritchie J. M., Bornmann W., Boothman D. A., Oberley L. W., and Cullen J. J. (2005) Efficacy of β-lapachone in pancreatic cancer treatment: exploiting the novel, therapeutic target NQO1. Cancer Biol. Ther. 4, 95–102 [DOI] [PubMed] [Google Scholar]
- 14. Pink J. J., Planchon S. M., Tagliarino C., Varnes M. E., Siegel D., and Boothman D. A. (2000) NAD(P)H:quinone oxidoreductase activity is the principal determinant of β-lapachone cytotoxicity. J. Biol. Chem. 275, 5416–5424 [DOI] [PubMed] [Google Scholar]
- 15. Reinicke K. E., Bey E. A., Bentle M. S., Pink J. J., Ingalls S. T., Hoppel C. L., Misico R. I., Arzac G. M., Burton G., Bornmann W. G., Sutton D., Gao J., and Boothman D. A. (2005) Development of β-lapachone prodrugs for therapy against human cancer cells with elevated NAD(P)H:quinone oxidoreductase 1 levels. Clin. Cancer Res. 11, 3055–3064 [DOI] [PubMed] [Google Scholar]
- 16. Bey E. A., Bentle M. S., Reinicke K. E., Dong Y., Yang C. R., Girard L., Minna J. D., Bornmann W. G., Gao J., and Boothman D. A. (2007) An NQO1- and PARP-1-mediated cell death pathway induced in non-small-cell lung cancer cells by β-lapachone. Proc. Natl. Acad. Sci. U.S.A. 104, 11832–11837 [DOI] [PMC free article] [PubMed] [Google Scholar]
- 17. Li L. S., Bey E. A., Dong Y., Meng J., Patra B., Yan J., Xie X. J., Brekken R. A., Barnett C. C., Bornmann W. G., Gao J., and Boothman D. A. (2011) Modulating endogenous NQO1 levels identifies key regulatory mechanisms of action of β-lapachone for pancreatic cancer therapy. Clin. Cancer Res. 17, 275–285 [DOI] [PMC free article] [PubMed] [Google Scholar]
- 18. Bentle M. S., Reinicke K. E., Bey E. A., Spitz D. R., and Boothman D. A. (2006) Calcium-dependent modulation of poly(ADP-ribose) polymerase-1 alters cellular metabolism and DNA repair. J. Biol. Chem. 281, 33684–33696 [DOI] [PubMed] [Google Scholar]
- 19. Ma X., Huang X., Moore Z., Huang G., Kilgore J. A., Wang Y., Hammer S., Williams N. S., Boothman D. A., and Gao J. (2015) Esterase-activatable β-lapachone prodrug micelles for NQO1-targeted lung cancer therapy. J. Control. Release 200, 201–211 [DOI] [PMC free article] [PubMed] [Google Scholar]
- 20. Ma X., Moore Z. R., Huang G., Huang X., Boothman D. A., and Gao J. (2015) Nanotechnology-enabled delivery of NQO1 bioactivatable drugs. J. Drug Target 23, 672–680 [DOI] [PubMed] [Google Scholar]
- 21. Madajewski B., Boatman M. A., Chakrabarti G., Boothman D. A., and Bey E. A. (2016) Depleting tumor-NQO1 potentiates anoikis and inhibits growth of NSCLC. Mol. Cancer Res. 14, 14–25 [DOI] [PMC free article] [PubMed] [Google Scholar]
- 22. Chakrabarti G., Moore Z. R., Luo X., Ilcheva M., Ali A., Padanad M., Zhou Y., Xie Y., Burma S., Scaglioni P. P., Cantley L. C., DeBerardinis R. J., Kimmelman A. C., Lyssiotis C. A., and Boothman D. A. (2015) Targeting glutamine metabolism sensitizes pancreatic cancer to PARP-driven metabolic catastrophe induced by β-lapachone. Cancer Metab. 3, 12. [DOI] [PMC free article] [PubMed] [Google Scholar]
- 23. Dong Y., Bey E. A., Li L. S., Kabbani W., Yan J., Xie X. J., Hsieh J. T., Gao J., and Boothman D. A. (2010) Prostate cancer radiosensitization through poly(ADP-Ribose) polymerase-1 hyperactivation. Cancer Res. 70, 8088–8096 [DOI] [PMC free article] [PubMed] [Google Scholar]
- 24. Huang X., Dong Y., Bey E. A., Kilgore J. A., Bair J. S., Li L. S., Patel M., Parkinson E. I., Wang Y., Williams N. S., Gao J., Hergenrother P. J., and Boothman D. A. (2012) An NQO1 substrate with potent antitumor activity that selectively kills by PARP1-induced programmed necrosis. Cancer Res. 72, 3038–3047 [DOI] [PMC free article] [PubMed] [Google Scholar]
- 25. Bey E. A., Reinicke K. E., Srougi M. C., Varnes M., Anderson V. E., Pink J. J., Li L. S., Patel M., Cao L., Moore Z., Rommel A., Boatman M., Lewis C., Euhus D. M., Bornmann W. G., et al. (2013) Catalase abrogates β-lapachone-induced PARP1 hyperactivation-directed programmed necrosis in NQO1-positive breast cancers. Mol. Cancer Ther. 12, 2110–2120 [DOI] [PMC free article] [PubMed] [Google Scholar]
- 26. Planchon S. M., Pink J. J., Tagliarino C., Bornmann W. G., Varnes M. E., and Boothman D. A. (2001) β-Lapachone-induced apoptosis in human prostate cancer cells: involvement of NQO1/xip3. Exp. Cell Res. 267, 95–106 [DOI] [PubMed] [Google Scholar]
- 27. Tagliarino C., Pink J. J., Dubyak G. R., Nieminen A. L., and Boothman D. A. (2001) Calcium is a key signaling molecule in β-lapachone-mediated cell death. J. Biol. Chem. 276, 19150–19159 [DOI] [PubMed] [Google Scholar]
- 28. Tagliarino C., Pink J. J., Reinicke K. E., Simmers S. M., Wuerzberger-Davis S. M., and Boothman D. A. (2003) μ-Calpain activation in β-lapachone-mediated apoptosis. Cancer Biol. Ther. 2, 141–152 [DOI] [PubMed] [Google Scholar]
- 29. Wuerzberger S. M., Pink J. J., Planchon S. M., Byers K. L., Bornmann W. G., and Boothman D. A. (1998) Induction of apoptosis in MCF-7:WS8 breast cancer cells by β-lapachone. Cancer Res. 58, 1876–1885 [PubMed] [Google Scholar]
- 30. Moore Z., Chakrabarti G., Luo X., Ali A., Hu Z., Fattah F. J., Vemireddy R., DeBerardinis R. J., Brekken R. A., and Boothman D. A. (2015) NAMPT inhibition sensitizes pancreatic adenocarcinoma cells to tumor-selective, PAR-independent metabolic catastrophe and cell death induced by β-lapachone. Cell Death Dis. 6, e1599. [DOI] [PMC free article] [PubMed] [Google Scholar]
- 31. Warburg O. (1956) On the origin of cancer cells. Science 123, 309–314 [DOI] [PubMed] [Google Scholar]
- 32. DeBerardinis R. J., Lum J. J., Hatzivassiliou G., and Thompson C. B. (2008) The biology of cancer: metabolic reprogramming fuels cell growth and proliferation. Cell Metab. 7, 11–20 [DOI] [PubMed] [Google Scholar]
- 33. Vander Heiden M. G., Cantley L. C., and Thompson C. B. (2009) Understanding the Warburg effect: the metabolic requirements of cell proliferation. Science 324, 1029–1033 [DOI] [PMC free article] [PubMed] [Google Scholar]
- 34. Doherty J. R., and Cleveland J. L. (2013) Targeting lactate metabolism for cancer therapeutics. J. Clin. Invest. 123, 3685–3692 [DOI] [PMC free article] [PubMed] [Google Scholar]
- 35. Dawson D. M., Goodfriend T. L., and Kaplan N. O. (1964) Lactic dehydrogenases: functions of the two types rates of synthesis of the two major forms can be correlated with metabolic differentiation. Science 143, 929–933 [DOI] [PubMed] [Google Scholar]
- 36. Allison S. J., Knight J. R., Granchi C., Rani R., Minutolo F., Milner J., and Phillips R. M. (2014) Identification of LDH-A as a therapeutic target for cancer cell killing via (i) p53/NAD(H)-dependent and (ii) p53-independent pathways. Oncogenesis 3, e102. [DOI] [PMC free article] [PubMed] [Google Scholar]
- 37. Cerami E., Gao J., Dogrusoz U., Gross B. E., Sumer S. O., Aksoy B. A., Jacobsen A., Byrne C. J., Heuer M. L., Larsson E., Antipin Y., Reva B., Goldberg A. P., Sander C., and Schultz N. (2012) The cBio cancer genomics portal: an open platform for exploring multidimensional cancer genomics data. Cancer Discov. 2, 401–404 [DOI] [PMC free article] [PubMed] [Google Scholar]
- 38. Koukourakis M. I., Giatromanolaki A., Sivridis E., Bougioukas G., Didilis V., Gatter K. C., Harris A. L., and Tumour Angiogenesis Research Group (2003) Lactate dehydrogenase-5 (LDH-5) overexpression in non-small-cell lung cancer tissues is linked to tumour hypoxia, angiogenic factor production and poor prognosis. Br. J. Cancer 89, 877–885 [DOI] [PMC free article] [PubMed] [Google Scholar]
- 39. Wilson D. M., Keshari K. R., Larson P. E., Chen A. P., Hu S., Van Criekinge M., Bok R., Nelson S. J., Macdonald J. M., Vigneron D. B., and Kurhanewicz J. (2010) Multi-compound polarization by DNP allows simultaneous assessment of multiple enzymatic activities in vivo. J. Magn. Reson. 205, 141–147 [DOI] [PMC free article] [PubMed] [Google Scholar]
- 40. Rodrigues T. B., Serrao E. M., Kennedy B. W., Hu D. E., Kettunen M. I., and Brindle K. M. (2014) Magnetic resonance imaging of tumor glycolysis using hyperpolarized 13C-labeled glucose. Nat. Med. 20, 93–97 [DOI] [PMC free article] [PubMed] [Google Scholar]
- 41. Yang C., Harrison C., Jin E. S., Chuang D. T., Sherry A. D., Malloy C. R., Merritt M. E., and DeBerardinis R. J. (2014) Simultaneous steady-state and dynamic 13C NMR can differentiate alternative routes of pyruvate metabolism in living cancer cells. J. Biol. Chem. 289, 6212–6224 [DOI] [PMC free article] [PubMed] [Google Scholar]
- 42. Serrao E. M., Kettunen M. I., Rodrigues T. B., Dzien P., Wright A. J., Gopinathan A., Gallagher F. A., Lewis D. Y., Frese K. K., Almeida J., Howat W. J., Tuveson D. A., and Brindle K. M. (2016) MRI with hyperpolarised [1-13C]pyruvate detects advanced pancreatic preneoplasia prior to invasive disease in a mouse model. Gut 65, 465–475 [DOI] [PMC free article] [PubMed] [Google Scholar]
- 43. Salamanca-Cardona L., and Keshari K. R. (2015) 13C-Labeled biochemical probes for the study of cancer metabolism with dynamic nuclear polarization-enhanced magnetic resonance imaging. Cancer Metab. 3, 9. [DOI] [PMC free article] [PubMed] [Google Scholar]
- 44. Lumata L., Yang C., Ragavan M., Carpenter N., DeBerardinis R. J., and Merritt M. E. (2015) Hyperpolarized 13C magnetic resonance and its use in metabolic assessment of cultured cells and perfused organs. Methods Enzymol. 561, 73–106 [DOI] [PMC free article] [PubMed] [Google Scholar]
- 45. Khemtong C., Carpenter N. R., Lumata L. L., Merritt M. E., Moreno K. X., Kovacs Z., Malloy C. R., and Sherry A. D. (2015) Hyperpolarized 13C NMR detects rapid drug-induced changes in cardiac metabolism. Magn. Reson. Med. 74, 312–319 [DOI] [PMC free article] [PubMed] [Google Scholar]
- 46. Kettunen M. I., Hu D. E., Witney T. H., McLaughlin R., Gallagher F. A., Bohndiek S. E., Day S. E., and Brindle K. M. (2010) Magnetization transfer measurements of exchange between hyperpolarized [1-13C]pyruvate and [1-13C]lactate in a murine lymphoma. Magn. Reson. Med. 63, 872–880 [DOI] [PubMed] [Google Scholar]
- 47. Keshari K. R., Sriram R., Koelsch B. L., Van Criekinge M., Wilson D. M., Kurhanewicz J., and Wang Z. J. (2013) Hyperpolarized 13C-pyruvate magnetic resonance reveals rapid lactate export in metastatic renal cell carcinomas. Cancer Res. 73, 529–538 [DOI] [PMC free article] [PubMed] [Google Scholar]
- 48. Nelson S. J., Kurhanewicz J., Vigneron D. B., Larson P. E., Harzstark A. L., Ferrone M., van Criekinge M., Chang J. W., Bok R., Park I., Reed G., Carvajal L., Small E. J., Munster P., Weinberg V. K., et al. (2013) Metabolic imaging of patients with prostate cancer using hyperpolarized [1–13C]pyruvate. Sci. Transl. Med. 5, 198ra108. [DOI] [PMC free article] [PubMed] [Google Scholar]
- 49. Cunningham C. H., Lau J. Y., Chen A. P., Geraghty B. J., Perks W. J., Roifman I., Wright G. A., and Connelly K. A. (2016) Hyperpolarized 13C metabolic MRI of the human heart: initial experience. Circ. Res. 119, 1177–1182 [DOI] [PMC free article] [PubMed] [Google Scholar]
- 50. TeSlaa T., and Teitell M. A. (2014) Techniques to monitor glycolysis. Methods Enzymol. 542, 91–114 [DOI] [PMC free article] [PubMed] [Google Scholar]
- 51. Harrison C., Yang C., Jindal A., DeBerardinis R. J., Hooshyar M. A., Merritt M., Dean Sherry A., and Malloy C. R. (2012) Comparison of kinetic models for analysis of pyruvate-to-lactate exchange by hyperpolarized 13C NMR. NMR Biomed. 25, 1286–1294 [DOI] [PMC free article] [PubMed] [Google Scholar]
- 52. Hill D. K., Orton M. R., Mariotti E., Boult J. K., Panek R., Jafar M., Parkes H. G., Jamin Y., Miniotis M. F., Al-Saffar N. M., Beloueche-Babari M., Robinson S. P., Leach M. O., Chung Y. L., and Eykyn T. R. (2013) Model free approach to kinetic analysis of real-time hyperpolarized 13C magnetic resonance spectroscopy data. PLoS One 8, e71996. [DOI] [PMC free article] [PubMed] [Google Scholar]
- 53. Purmal C., Kucejova B., Sherry A. D., Burgess S. C., Malloy C. R., and Merritt M. E. (2014) Propionate stimulates pyruvate oxidation in the presence of acetate. Am. J. Physiol. Heart Circ. Physiol. 307, H1134–H1141 [DOI] [PMC free article] [PubMed] [Google Scholar]
- 54. Sriram R., Van Criekinge M., Hansen A., Wang Z. J., Vigneron D. B., Wilson D. M., Keshari K. R., and Kurhanewicz J. (2015) Real-time measurement of hyperpolarized lactate production and efflux as a biomarker of tumor aggressiveness in an MR compatible 3D cell culture bioreactor. NMR Biomed. 28, 1141–1149 [DOI] [PMC free article] [PubMed] [Google Scholar]
- 55. Park J. M., Spielman D. M., Josan S., Jang T., Merchant M., Hurd R. E., Mayer D., and Recht L. D. (2016) Hyperpolarized 13C-lactate to 13C-bicarbonate ratio as a biomarker for monitoring the acute response of anti-vascular endothelial growth factor (anti-VEGF) treatment. NMR Biomed. 29, 650–659 [DOI] [PMC free article] [PubMed] [Google Scholar]
- 56. Bey E. A., Meade J. C., Silvers M. A., Motea E. A., Patidar P. L., Brekken R., Deja S., Merritt M. E., Kilgore J. A., Liu Y., Huang X., Li L., Yordy J., Williams N. S., Gao J., and Boothman D. A. (2016) NQO1 bioactivatable drugs modify radiation responses. in Strategies to Enhance the Therapeutic Ratio of Radiation as a Cancer Treatment (Anscher M. S., and Valerie K., eds) pp. 225–252, Springer International Publishing, Cham, Switzerland [Google Scholar]
- 57. Murphy T. A., and Young J. D. (2013) ETA: robust software for determination of cell specific rates from extracellular time courses. Biotechnol. Bioeng. 110, 1748–1758 [DOI] [PMC free article] [PubMed] [Google Scholar]
- 58. Wegner A., Weindl D., Jäger C., Sapcariu S. C., Dong X., Stephanopoulos G., and Hiller K. (2014) Fragment formula calculator (FFC): determination of chemical formulas for fragment ions in mass spectrometric data. Anal. Chem. 86, 2221–2228 [DOI] [PMC free article] [PubMed] [Google Scholar]
- 59. Fernandez C. A., Des Rosiers C., Previs S. F., David F., and Brunengraber H. (1996) Correction of 13C mass isotopomer distributions for natural stable isotope abundance. J. Mass Spectrom. 31, 255–262 [DOI] [PubMed] [Google Scholar]
- 60. Cao L., Li L. S., Spruell C., Xiao L., Chakrabarti G., Bey E. A., Reinicke K. E., Srougi M. C., Moore Z., Dong Y., Vo P., Kabbani W., Yang C. R., Wang X., Fattah F., et al. (2014) Tumor-selective, futile redox cycle-induced bystander effects elicited by NQO1 bioactivatable radiosensitizing drugs in triple-negative breast cancers. Antioxid. Redox Signal. 21, 237–250 [DOI] [PMC free article] [PubMed] [Google Scholar]
Associated Data
This section collects any data citations, data availability statements, or supplementary materials included in this article.