

Abstract
Systemic iron homeostasis is maintained by regulation of iron absorption in the duodenum, iron recycling from erythrocytes, and iron mobilization from the liver and is controlled by the hepatic hormone hepcidin. Hepcidin expression is induced via the bone morphogenetic protein (BMP) signaling pathway that preferentially uses two type I (ALK2 and ALK3) and two type II (ActRIIA and BMPR2) BMP receptors. Hemojuvelin (HJV), HFE, and transferrin receptor-2 (TfR2) facilitate this process presumably by forming a plasma membrane complex with BMP receptors. Matriptase-2 (MT2) is a protease and key suppressor of hepatic hepcidin expression and cleaves HJV. Previous studies have therefore suggested that MT2 exerts its inhibitory effect by inactivating HJV. Here, we report that MT2 suppresses hepcidin expression independently of HJV. In Hjv−/− mice, increased expression of exogenous MT2 in the liver significantly reduced hepcidin expression similarly as observed in wild-type mice. Exogenous MT2 could fully correct abnormally high hepcidin expression and iron deficiency in MT2−/− mice. In contrast to MT2, increased Hjv expression caused no significant changes in wild-type mice, suggesting that Hjv is not a limiting factor for hepcidin expression. Further studies revealed that MT2 cleaves ALK2, ALK3, ActRIIA, Bmpr2, Hfe, and, to a lesser extent, Hjv and Tfr2. MT2-mediated Tfr2 cleavage was also observed in HepG2 cells endogenously expressing MT2 and TfR2. Moreover, iron-loaded transferrin blocked MT2-mediated Tfr2 cleavage, providing further insights into the mechanism of Tfr2's regulation by transferrin. Together, these observations indicate that MT2 suppresses hepcidin expression by cleaving multiple components of the hepcidin induction pathway.
Keywords: bone morphogenetic protein (BMP), iron, liver, receptor, signaling, HFE, hemojuvelin, hepcidin, matriptase-2, transferrin receptor-2
Introduction
Systemic iron homeostasis is maintained by coordinately regulating the iron absorption in the duodenum, iron recycling from senescent erythrocytes, and iron mobilization from the liver storage (1). In this regulation, hepatic hormone hepcidin plays an essential role (2). Hepcidin inhibits iron efflux into the circulation by targeting the plasma membrane iron exporter, ferroportin, for degradation (3). Lack of hepcidin causes juvenile hemochromatosis, a severe form of iron overload disorder (4). In contrast, inappropriately high levels of hepcidin cause iron-deficiency anemia (5–7). Under physiological conditions, hepcidin expression is regulated positively by body iron content to maintain iron homeostasis.
Hepatic hepcidin expression is induced via the bone morphogenetic protein (BMP)2 signaling pathway (8–10). BMPs are cytokines that are a subset of the transforming growth factor-β (TGF-β) superfamily (11). BMP signaling is initiated upon the binding of BMP ligands to type I and type II BMP receptors on the cell surface. Upon BMP binding, the type II receptors phosphorylate the type I receptors, leading to the phosphorylation of SMAD1/5/8 in the cytoplasm. The phosphorylated SMADs form heteromeric complexes with the co-SMAD, SMAD4, and then translocate into the nucleus where they induce the transcription of target genes. The BMP ligands that are responsible for hepcidin induction in hepatocytes are derived from adjacent sinusoidal endothelial cells (12, 13). Depletion of Bmp6 or Bmp2 in the liver sinusoidal endothelial cells markedly reduces hepcidin expression and causes iron overload in mice to a similar extent as seen in the Bmp6 global knock-out mice (13–16). There are multiple type I BMP receptors (ALK1, ALK2, ALK3, and ALK6) and type II BMP receptors (BMPR2, ActR2a, and ActR2b). Type I BMP receptors exist as dimers, as do type II BMP receptors. Upon ligand binding, they form heterotetramers. Liver-specific deletion of ALK3, to a lesser extent ALK2, or both BMPR2 and ActRIIA ablates BMP signaling and hepcidin expression in mice (17, 18). Additionally, liver-specific depletion of Smad1/5 or Smad4 also reduces hepcidin expression and causes iron overload (10, 19). These observations indicate that hepatocytes utilize a selective set of BMP ligands, BMP receptors, and SMADs to induce hepcidin expression.
A normal range of hepcidin expression also requires the involvement of other plasma membrane proteins, including hemojuvelin (HJV), hemochromatosis protein (HFE), transferrin receptor-2 (TfR2), and neogenin (1). Mutations in the HJV gene in humans markedly reduce hepcidin expression in the liver and result in juvenile hemochromatosis (20). Mutations in the HFE and TfR2 genes also decrease hepcidin expression and cause type I hemochromatosis, the most common form of hereditary iron overload, and type III hemochromatosis, respectively (6). All these defects have been documented in animal models. Knock-out of these genes recapitulate the human mutation phenotypes, indicating that the mutations impart a lack of function. Additionally, neogenin deficiency in mice results in low hepcidin expression and severe iron overload that are indistinguishable from Hjv−/− mice (21).
The liver appears to be the major organ for the control of iron uptake and distribution in the body. In the liver, hepatocytes are the major cell type and contribute to over 80% of the liver mass. Plasma membrane proteins involved in regulating hepcidin expression are highly expressed in hepatocytes. HJV and TfR2 are exclusively expressed in hepatocytes, HFE is predominantly expressed in hepatocytes, and neogenin is also highly expressed in hepatocytes (22, 23). HJV is a glycosylphosphatidylinositol (GPI)-linked membrane protein (20, 22, 24) that acts as a BMP co-receptor to enhance BMP signaling resulting in an increase in hepcidin expression (9, 25). HFE and TfR2 are type I and type II transmembrane proteins, respectively. TfR2 can bind iron-saturated transferrin (holo-Tf) in the circulation and is proposed to sense body iron levels. HJV interacts with HFE and TfR2 (26). The precise mechanisms for hepcidin induction by HFE, TfR2, and neogenin are largely unknown. The current model predicts that all these proteins form a complex with BMP receptors in the plasma membrane to facilitate the BMP signaling and hepcidin expression (1, 27).
Hepatocytes possess an elegant but poorly understood machinery to sense iron status and adjust hepcidin expression to match the iron needs. Recent studies have implicated matriptase-2 (MT2) as a key player in this process. For the convenience of brevity, MT2 will be used for both gene and protein of human and mice throughout this paper. MT2 is a trypsin-like serine protease (28), and is a robust suppressor for hepcidin expression (1). This type II transmembrane protease is composed of a short cytoplasmic domain, a transmembrane domain, and a large extracellular domain, which contains a membrane-proximal stem region, a predicted cleavage activation site, and a C-terminal catalytic domain (Fig. 1A) (29). Mutations in MT2 result in increased hepcidin expression, which leads to iron-refractory iron-deficiency anemia (30). Similar phenotypes are also reported in mouse models either with MT2 knock-out or with a truncated MT2 that lacks the catalytic domain (mask mice) (31–33). Thus iron-refractory iron-deficiency anemia is caused by loss-of-function mutations in MT2. MT2 is expressed predominantly in the liver (12, 28, 34). To date HJV is the only reported substrate for MT2. In transfected cells, MT2 cleaves HJV at multiple arginine residues (35). Expression of MT2 decreases the accumulation of HJV on the cell surface (36). HJV can also be cleaved by the ubiquitously expressed proprotein convertase furin at the conserved RNRR motif (Fig. 5A) (37, 38). The furin-cleaved soluble HJV is detectable in conditioned medium of cells and in mouse serum (39), but the physiological significance of this cleavage is unknown. Animal studies demonstrate that mice deficient in both Hjv and MT2 exhibited the phenotypes of Hjv−/− mice, including a marked decrease in hepatic hepcidin expression and systemic iron overload (33, 40). By contrast, double mutant mice lacking functional Hfe or Tfr2 and MT2 exhibited a severe iron deficiency microcytic anemia phenotype mimicking the phenotype of single mutant mice lacking functional MT2 (41). These observations suggest that MT2 suppresses hepcidin expression likely by decreasing the levels of HJV.
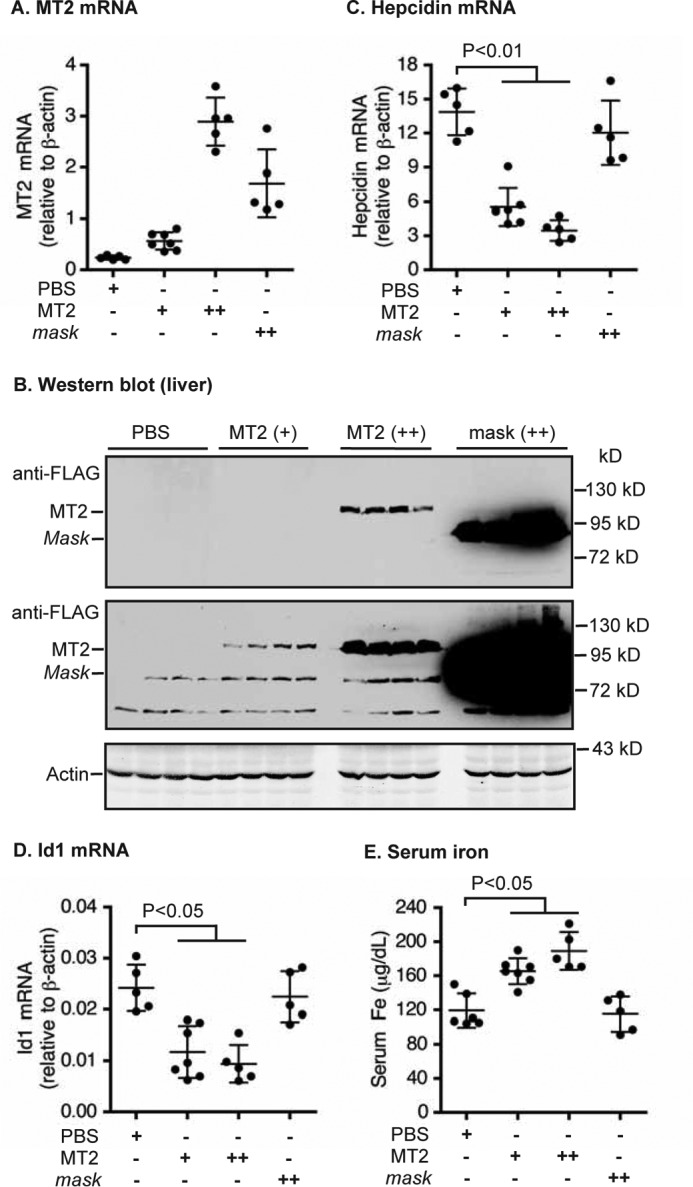
Figure 1.

Expression of tagged MT2 in the liver of MT2−/− mice rescued alopecia and reduced hepcidin expression. A, diagram of mouse MT2 and MT2-mask constructs that were used to generate AAV8 vectors. Cyto, cytoplasmic domain. SEA, sea urchin sperm protein, enteropeptidase agrin. CUB, complement protein subcomponents C1r/C1s, urchin embryonic growth factor and bone morphogenetic protein 1 domain. L, low density lipoprotein receptor class A domain. S/P, serine protease domain. The arrow indicates the predicted cleavage activation site. B, qRT-PCR analysis of hepatic MT2 mRNA. Eight-week old MT2−/− mice of both genders on B6/129S mixed background were intraperitoneally injected with AAV8-MT2 at ∼8 × 10¹¹ genome-particles per mouse, AAV8-MT2-mask (mask) at ∼4 × 10¹² genome-particles per mouse, or PBS vehicle as control. Animals were euthanized for analysis after 3 weeks of injection. Age-matched WT mice on the same background were included as additional controls. C, Western blot analysis of introduced MT2 protein in the liver extracts from three mice for each group by using an anti-FLAG antibody. Two images with different intensities were presented. β-Actin was used as a loading control. n.s., nonspecific band. D, expression of MT2, not mask, rescued the alopecia in MT2−/− mice. E and F, qRT-PCR analysis of hepatic hepcidin (E) and Id1 (F) mRNA. G, liver non-heme iron analysis. All qRT-PCR results are expressed as the amount relative to that of β-actin for each sample. The mean ± S.D. are presented. Each group consists of at least four mice. For statistical analysis, only the results for groups of interest were presented.
Figure 5.

MT2 cleaves Hjv and mildly reduces its cell-surface localization. A, diagram of N-terminal-tagged mouse Hjv with the potential cleavages sites by MT2, furin, and PI-PLC, as well as the antibodies used for Western blot. B, MT2, but not S762A-MT2 or MT2-mask, cleaves Hjv in HEK293 cells. HEK293 cells in 12-well plates were co-transfected with an equal amount of pCMV9-Hjv (2 μg), increasing amount of pCMV6-MT2, S762A-MT2, or MT2-mask (0, 0.5, 1.0, and 2.0 μg), and decreasing amount of pEGFP-N1 (2.0, 1.5, 1.0, 0.5, and 0 μg). All cells were transfected with equal amounts of total plasmid DNA. Fresh medium was changed at 24 h post-transfection. After another 24 h of incubation, MT2 and Hjv in ∼150 μg of cell lysate proteins (L) were immunodetected by using anti-FLAG antibody. β-Actin and EGFP were detected by anti-β-actin and GFP antibodies, respectively. Hjv in ∼600 μl of CM was immunodetected by both anti-FLAG and anti-HJV antibodies. HEK293 cells (Ctrl) were included as a negative control for Hjv and MT2. Two MT2 images with different exposure times are presented. C, expression of MT2 mildly decreases cell-surface Hjv. HEK293 cells were co-transfected with pCMV9-Hjv and an equal amount of pEGFP, pCMV6-MT2, or S762A-MT2 plasmid DNA. At about 48 h after transfection, cell-surface proteins were biotinylated at 4 °C, followed by pull-down of the biotinylated proteins using streptavidin-agarose beads. The eluted cell-surface proteins and about 10% of input lysate were subjected to SDS-PAGE and immunodetection of Hjv, MT2, Na+K+-ATPase (NaKATPase), β-actin, and EGFP using specific antibodies. D, quantification of Hjv bands in C. The intensities of full-length Hjv bands in cell lysate input and cell-surface eluates, as well as the furin-cleaved Hjv band in CM migrating at ∼45 kDa, were quantified by using an Alexa Fluor 800 goat anti-mouse secondary antibody and an Odyssey Infrared Imaging System (Li-Cor). Only the data with and without MT2 were presented. Pair and two-tailed t test was used to calculate the significant difference between two groups. Results are from five independent experiments. E, a small proportion of MT2 is localized on cell surface. HEK293 cells were transfected with pCMV6-MT2, S762A-MT2, or MT2-mask, followed by biotinylation of cell-surface proteins and Western blot analysis by using specific antibodies. * denotes nonspecific band. All experiments were repeated at least three times (technical replicate = 1; independent biological replicates ≥3) with consistent results.
Recent evidence suggests that HJV is not the sole substrate for MT2. MT2−/− mice have a lower, rather than higher, level of Hjv protein (42, 43), which argues against MT2 having a major role in the down-regulation of Hjv levels in vivo. In addition, Hjv−/− mice still retain a robust mechanism to lower hepcidin expression in response to the decreased body iron level (39, 44). Expression of Hjv mRNA in the liver of Hjv−/− mice at about 15% of wild-type mice is sufficient to fully rescue the low hepcidin status (45). These observations favor the idea that Hjv is not a limiting factor, and suggest that MT2 suppresses hepcidin expression through another mechanism. In this study, we tested the hypothesis that MT2 targets multiple key components of the hepcidin induction pathway to suppress hepcidin expression. Results showed that MT2 was able to reduce hepcidin expression independently of Hjv in vivo, and that MT2 cleaved cell surface ALK2, ALK3, ActRIIA, Bmpr2, Hfe, and to a lesser extent, Hjv and Tfr2 in transfected cells. These observations support the idea that MT2 suppresses hepcidin expression by cleaving multiple components of its induction pathway.
Results
Expression of tagged-MT2 in the liver of MT2−/− mice rescues the anemia and alopecia
MT2−/− mice are anemic and have alopecia as a result of low iron levels (31–33). Both genders of MT2−/− mice displayed alopecia, microcytic anemia, low serum iron, low liver non-heme iron, but high hepatic hepcidin mRNA (Fig. 1, Table 1). These results are consistent with those previously reported for MT2−/− mice (31–33). A murine MT2 with a C-terminal FLAG/MYC epitope (Fig. 1A, Table 2) was used to explore the mechanism for MT2 suppression of hepcidin expression. Addition of a C-terminal FLAG/MYC tag to human MT2 does not affect its cleavage of HJV as reported in previous studies (12, 36), rather it allows a convenient immunodetection of the expressed proteins in transfected cells or transduced mouse liver tissues. To validate that the tagged MT2 is also functional in vivo, we expressed this mouse MT2 in the liver of MT2−/− mice using hepatocyte-specific Adeno-Associated Virus 8 (AAV8)-MT2 vectors.
Table 1.
Hematologic parameters and serum iron concentrations for wild-type mice (WT) and MT2−/− mice injected with PBS, AAV8-MT2, or AAV8-MT2-mask vectors
Data are expressed as mean ± S.D. Asterisks denote statistically significant differences from the WT group (***, p < 0.001; **, p < 0.01; n ≥ 4).
| WT | MT2−/− + PBS | MT2−/− + AAV8-MT2 | MT2−/− + AAV8-MT2-mask | |
|---|---|---|---|---|
| Hba (g/dl) | 12.80 ± 0.36 | 7.68 ± 0.51*** | 10.80 ± 0.45** | 7.50 ± 0.56*** |
| RBC (106) | 9.24 ± 0.12 | 10.62 ± 0.26*** | 11.96 ± 0.72** | 10.91 ± 0.39*** |
| HCT (%) | 40.80 ± 1.05 | 34.92 ± 1.41*** | 44.43 ± 5.34 | 35.80 ± 1.34** |
| MCV (fl) | 44.50 ± 0.65 | 32.86 ± 0.57*** | 38.96 ± 5.29 | 32.80 ± 0.42*** |
| MCH (pg) | 13.97 ± 0.30 | 7.13 ± 0.25*** | 8.86 ± 0.41*** | 6.86 ± 0.35*** |
| Serum iron (μg/dl) | 109.24 ± 12.88 | 10.96 ± 3.04*** | 122.91 ± 38.16 | 14.57 ± 4.08*** |
a The abbreviations used are: Hb, hemoglobin; RBC, red blood cells; HCT, hematocrit; MCV, mean cell volume; MCH, mean corpuscular hemoglobin.
Table 2.
Mouse ORF constructs used for transfection studies
| Mouse ORFs | Encoded proteins | Tag epitope |
|---|---|---|
| ActRIIA | Type I transmembrane protein | C-terminal FLAG/MYC |
| ALK2 | Type I transmembrane protein | C-terminal FLAG/MYC |
| ALK3 | Type I transmembrane protein | C-terminal FLAG/MYC |
| Bmpr2 | Type I transmembrane protein | C-terminal FLAG/MYC |
| Hfe | Type I transmembrane protein | C-terminal FLAG/MYC |
| Hjv | GPI-anchored membrane protein | N-terminal 3 × FLAG |
| MT2 | Type II transmembrane protein | C-terminal FLAG/MYC |
| Tfr2 | Type II transmembrane protein | No tag |
| Zip14 | Membrane protein with seven transmembrane segments | C-terminal 3 × FLAG |
MT2−/− mice of both genders were injected intraperitoneally with AAV8-MT2 vectors, AAV8-MT2-mask vectors, or phosphate-buffered saline (PBS) vehicle. MT2-mask, which lacks the proteolytic domain (Fig. 1A), was used as a negative control. All animals were maintained on the regular murine diet. At 3 weeks after injection, mice were euthanized for analysis. As predicted, there was no detectable MT2 mRNA in the liver of MT2−/− mice injected with PBS (Fig. 1B). The MT2 mRNA level in the AAV-MT2 group was comparable with endogenous MT2 mRNA in wild-type (WT) mice (Fig. 1B), and the introduced MT2 in the liver extracts could be detected by using an anti-FLAG antibody (Fig. 1C). When compared with the control group injected with PBS vehicle, expression of tagged MT2 in the liver fully corrected the low serum iron status with a higher level than in WT mice (Table 1), largely rescued the alopecia (Fig. 1D), and greatly ameliorated the anemia by increasing the hemoglobin levels (Table 1). Hepcidin mRNA in the liver was decreased by ∼5-fold (Fig. 1E). Recent studies demonstrate a strong correlation between the levels of hepatic hepcidin mRNA and serum hepcidin in mice (46–48). As a result, only hepcidin mRNA levels were determined in this and the following studies. Inhibitor of DNA binding-1 (Id1) is a direct downstream target of the BMP signaling, and it is widely used as a sensitive indicator for BMP signaling. The parallel decrease in Id1 mRNA (Fig. 1F) indicates that MT2 suppresses hepcidin expression by suppressing the Bmp signaling pathway. In contrast, no significant change was detected when truncated MT2-mask was expressed even at greater levels of mRNA and protein than MT2 group (Fig. 1, B–F, Table 1). Increased serum iron by MT2 expression did not significantly elevate the levels of liver non-heme iron, an indicator for storage iron in the body (Fig. 1G). This is likely due to the massive iron demand for erythropoiesis in MT2−/− mice. Together, these observations indicate that the tagged MT2 is functional in vivo.
MT2 suppresses hepcidin expression independently of Hjv
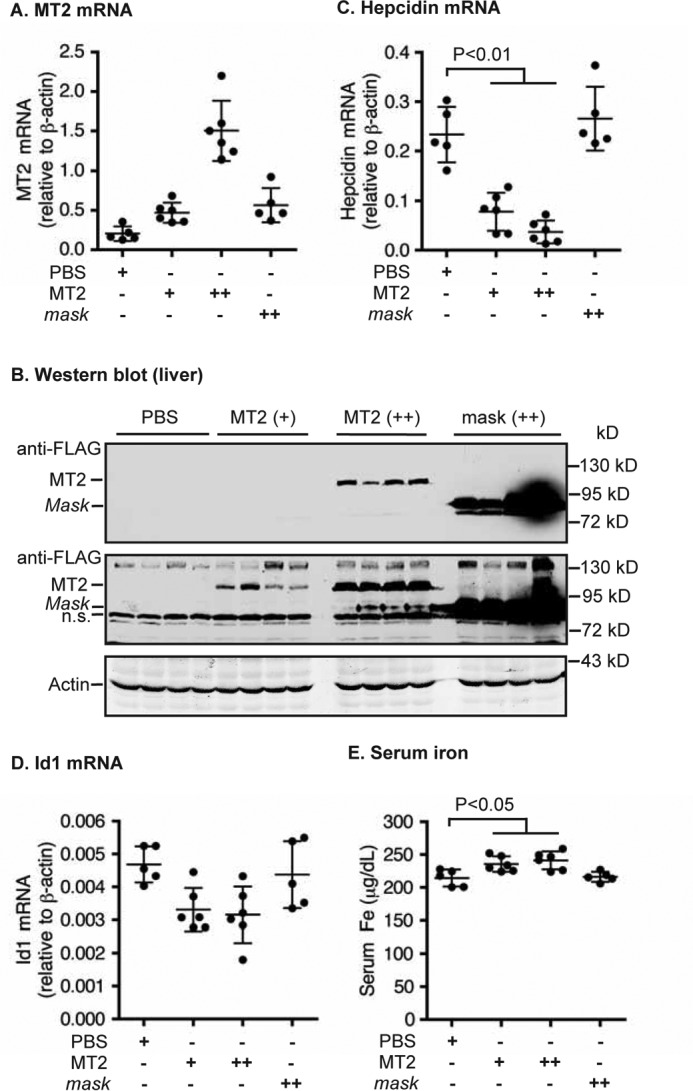
To gain insight into the mechanism of hepcidin suppression by MT2, we used AAV8-MT2 to overexpress MT2 in the livers of WT and Hjv−/− mice. We reasoned that if increased expression of MT2 in Hjv−/− mice leads to a reduction of hepcidin mRNA to a similar extent as in WT mice, it would indicate that MT2 can suppress hepcidin expression independently of Hjv. The effect of two different dosages of AAV8-MT2 vectors was tested first in control WT 129S mice. At 3 weeks after injection, MT2 mRNA levels in the liver were reached at about 2- and 10-fold higher than the endogenously expressed mMT2 mRNA in the control group injected with PBS vehicle (Fig. 2A). The protein levels of exogenously administered MT2 in the liver extracts were proportional to the mRNA levels as determined by Western blot analysis using an anti-FLAG antibody (Fig. 2B). Interestingly, a 2-fold increase in MT2 mRNA was able to decrease hepcidin mRNA by about 4-fold. A further increase in MT2 was able to increase the reduction but to a lesser extent. We used an additional control to determine whether the effect of MT2 was dependent on its proteolytic activity. WT 129S mice were injected with AAV-MT2-mask, where the proteolytic domain is missing. In contrast to the AAV8-MT2 WT group, no evident inhibition of hepcidin expression was detected in the AAV-MT2-mask mice even at ∼4-fold higher levels than endogenous MT2 mRNA (Fig. 2C). The protein level of mask-MT2 was much higher than that of high MT2 group (Fig. 2B), suggesting that MT2-mask was much more stable than full-length MT2 in the liver. The decrease of hepcidin expression in the AAV8-MT2 group was associated with a parallel decrease in Id1 mRNA (Fig. 2D). A significant increase in serum iron was detected in MT2 groups consistent with the idea that decreased hepcidin expression results in higher serum iron (Fig. 2E). These results indicate that the proteolytic domain of MT2 is required for MT2 to suppress hepcidin expression through inhibiting the Bmp signaling pathway and suggest that hepatic MT2 is a limiting factor for regulating hepcidin expression.
Figure 2.
Liver-specific expression of MT2, but not MT2-mask, suppresses hepcidin expression in wild-type mice. Eight-week-old male wild-type 129S mice were intraperitoneally injected with AAV8-MT2 at ∼8 × 10¹¹ (+) and ∼4 × 10¹² (++) genome-particles per mouse, AAV8-MT2-mask at ∼4 × 10¹² (++) genome-particles per mouse, or PBS vehicle as control. A, qRT-PCR analysis of MT2 mRNA in the liver. B, Western blot analysis of introduced MT2 and β-actin in ∼300 μg of liver extracts from four mice for each group by anti-FLAG and β-actin antibodies, respectively. Two images with different intensities for MT2 were presented. C and D, qRT-PCR analysis of hepcidin mRNA (C) and Id1 mRNA (D). All qRT-PCR results are expressed as the amount relative to that of β-actin for each sample. E, serum iron analysis. The mean ± S.D. are presented. Each group consists of at least five mice.
Hjv−/− mice were next used to test whether MT2 acted solely on Hjv. Hjv−/− mice expressed similar levels of endogenous MT2 mRNA as in WT mice (Figs. 2A and 3A). Hjv−/− mice were injected with AAV8-MT2 or AAV8-MT2-mask (Fig. 3, A and B). Intriguingly and contrary to the assumption that MT2 acts solely to cleave Hjv, expression of exogenous MT2 was still able to decrease the level of hepatic hepcidin mRNA in AAV8-MT2 Hjv−/− mice (Fig. 3C). The proportion of decrease was even more pronounced than that seen in AAV8-MT2 WT mice at both dosages, although the basal levels of hepcidin were over 50-fold lower (Figs. 2C and 3C). Because a low level of Id1 mRNA was detected in the liver of Hjv−/− mice, we only detected a trend of decrease in Id1 mRNA by increased MT2 expression (Fig. 3D). Consistently, reduced hepcidin mRNA expression in AAV8-MT2 mice was correlated with a further increase in the baseline high serum iron levels (Fig. 3E). No changes in hepcidin mRNA and serum iron levels were detected in the AAV8-MT2-mask Hjv−/− mice (Fig. 3, C–E). These results indicate that MT2 can suppress Bmp signaling and hepcidin expression independently of Hjv, and suggest that MT2 may cleave other key components of hepcidin induction pathway to suppress hepcidin expression.
Figure 3.
Liver-specific expression of MT2, but not MT2-mask, suppresses hepcidin expression in Hjv−/− mice. Eight-week old male Hjv−/− mice were intraperitoneally injected with AAV8-MT2 at ∼8 × 10¹¹ (+) and ∼4 × 10¹² (++) genome-particles per mouse, AAV8-mask at ∼4 × 10¹² (++) genome-particles per mouse, or PBS vehicle as control. A, qRT-PCR analysis of MT2 mRNA in the liver. B, Western blot analysis of MT2 and β-actin in ∼300 μg of liver extracts by anti-FLAG and β-actin antibodies, respectively. Two images with different intensities for MT2 are presented. n.s., nonspecific band. C and D, qRT-PCR analysis of hepcidin mRNA (C) and Id1 mRNA (D). All qRT-PCR results are expressed as the amount relative to that of β-actin for each sample. E, serum iron analysis. The mean ± S.D. are presented. Each group consists of at least five mice.
Hjv is not a limiting factor for hepcidin expression
Hepatic Hjv acts as a co-receptor to facilitate the BMP signaling and hepcidin expression (9). We reasoned that if MT2 indeed functions through cleaving Hjv, Hjv would be a limiting factor and its level in the liver would be positively correlated with the hepcidin expression. Our previous studies show that in Hjv−/− mice, expression of exogenously introduced Hjv mRNA at ∼15% of WT mice is able to fully rescue the low hepcidin status, which argues against Hjv as a limiting factor for hepcidin expression (45). Here AAV8-Hjv vectors were injected intraperitoneally into 8-week-old WT mice at three different dosages. The FLAG-tagged Hjv is able to rescue the low hepcidin and high serum iron status in Hjv−/− mice (39). qRT-PCR analysis revealed that administration of AAV8-Hjv vector led to about 2-, 4-, and 10-fold higher Hjv mRNA levels when compared with PBS vehicle-injected controls (Fig. 4A). Western blot analysis with an anti-FLAG antibody detected a proportional increase in the level of introduced exogenous Hjv protein in the liver (Fig. 4B). Interestingly, increased Hjv did not significantly elevate the levels of hepatic hepcidin mRNA (Fig. 4C). Consistently, there was no evident change of Id1 mRNA, Bmp6 mRNA, and serum iron concentrations (Fig. 4, D–F). The hepatic Bmp6 mRNA level is increased by bodily iron load (8). These results, together with the lack of correlation between the hepatic Hjv level and hepcidin expression in our previous study (45), suggest that Hjv is not normally a limiting factor for hepcidin expression.
Figure 4.

Increased expression of Hjv in the liver of wild-type mice did not increase hepcidin expression. Eight-week-old male wild-type 129S mice were intraperitoneally injected with AAV8-Hjv at ∼8 × 10¹¹ (+), ∼2 × 10¹² (++), or ∼4 × 10¹² (+++) genome-particles per mouse. The control group was injected with PBS vehicle. A, qRT-PCR analysis of Hjv mRNA in the liver. B, Western blot analysis of introduced Hjv and β-actin in ∼300 μg of the liver extracts by anti-FLAG and β-actin antibodies, respectively. C–E, qRT-PCR analysis of hepcidin mRNA (C), Id1 mRNA (D), and Bmp6 mRNA (E). All qRT-PCR results are expressed as the amount relative to that of β-actin for each sample. F, serum iron analysis. The mean ± S.D. are presented. Each group consists of at least four mice.
MT2 cleaves Hjv but it only mildly decreases its cell surface level
Hjv can be cleaved by both MT2 and the ubiquitously expressed furin (Fig. 5A) (35, 37–39). MT2 is hypothesized to down-regulate hepcidin expression through the cleavage and release of Hjv from cells. We wanted to determine the extent of Hjv cleavage by MT2. HEK293 cells were co-transfected with a constant amount of Hjv and an increasing amount of MT2. Reciprocal amounts of EGFP were co-transfected to balance the amount of protein synthesis in cells. S762A-MT2, a predicted protease dead mutant and MT2-mask were included as negative controls. As expected, when Hjv is expressed without MT2, only a single furin-cleaved Hjv band migrating at ∼45 kDa was detected in the conditioned medium (CM) using either anti-FLAG or anti-HJV antibody (Fig. 5B, lane 2). Co-transfection with MT2 resulted in a decrease in furin-cleaved Hjv in CM in an MT2-dependent manner and the appearance of at least two MT2-cleaved Hjv fragments using an anti-HJV antibody generated against the full-length HJV (Fig. 5B, lanes 3–5). Expression of EGFP did not seem to affect Hjv cleavage by either furin or MT2, because co-transfection with pcDNA3 empty vector resulted in similar results (data not shown). No MT2-cleaved Hjv product was detected in CM when either MT2-mask or the protease dead full-length MT2 (S762A-MT2) were co-expressed (Fig. 5B). Interestingly, in contrast to the marked decrease in furin-cleaved Hjv in the CM, expression of MT2 did not significantly affect total cellular Hjv (Fig. 5B). Consistent with the in vivo studies, a significant accumulation of MT2-mask was detected in cell lysates (Fig. 5B). These observations indicate that cleavage of Hjv is not a major factor in the regulation of cellular levels of Hjv in vitro, and are in agreement with the data in mice, indicating that Hjv may not be the major substrate of MT2 cleavage.
The effect of MT2 expression on cell-surface Hjv levels was detected at about 48 h post-transfection by biotinylation of cell surface proteins at 4 °C, streptavidin bead pull-down of biotinylated proteins, and immunodetection of Hjv. As expected, the plasma membrane protein Na+K+-ATPase was greatly concentrated in the eluates of cell surface proteins with no detectable β-actin (Fig. 5C, lanes 5–8 versus 1–4). Interestingly, in the absence of MT2 expression, only a small fraction of Hjv was found in the cell surface fraction (Fig. 5C, lane 2 versus 6). Co-transfection of Hjv and MT2 at a 1:1 ratio of plasmid DNA only resulted in a mild decrease of cell-surface Hjv by about 10% (Fig. 5, C, lane 6 versus 7, and D). This is in contrast to a marked reduction of furin-cleaved Hjv in CM by about ∼85% (Fig. 5, B and D). As a negative control, expression of S762A-MT2 displayed no evident effect on cell-surface Hjv (Fig. 5C). These results indicate that MT2 cleaves Hjv but only mildly reduces the cell-surface level of Hjv, and suggest that Hjv might not be the major substrate of MT2 because heterozygous Hjv mutant mice exhibit no significant decrease in hepcidin expression.
Biotinylation experiments also revealed a small fraction of MT2 localization on the cell surface when cells express MT2 alone or express MT2 together with Hjv (Fig. 5, C and E). In comparison, greater proportions of S762A-MT2 and MT2-mask were detected on cell surface (Fig. 5, C and E), indicating that lack of proteolytic activity does not affect S762A-MT2 trafficking to the cell surface. Because S762A-MT2 efficiently trafficked to the plasma membrane and did not cleave Hjv, we used it as a negative control in the following studies to explore the key substrates of MT2. The marked accumulation of MT2-mask in cell lysates compared with MT2 and S762A-MT2 (Fig. 5, B and E) as well as in the liver (Figs. 1C, 2B, and 3B) suggests that the catalytic domain rather than its proteolytic activity is critical for MT2 degradation.
MT2 cleaves the essential type I Bmp receptors, ALK2 and ALK3, for hepcidin expression
Because of the extracellular localization of MT2 catalytic domain, we tested the hypothesis that MT2 cleaves key components of the hepcidin induction pathway other than the plasma membrane Hjv to suppress hepcidin expression. All Bmp receptors are type I transmembrane proteins with short extracellular domains at around 120–150 amino acids in length containing arginine residues potentially susceptible to cleavage by MT2 (Fig. 6A). Because the levels of Bmp receptors in tissues and cell lines fall below the limit of immunodetection, we employed a similar co-transfection of HEK293 cells as described above for analyzing MT2 cleavage of Hjv. Due to the lack of appropriate antibodies against the extracellular domains of Bmp receptors for a direct immunodetection of cleaved products, a C-terminal FLAG/MYC epitope was added for each Bmp receptor open reading frame (ORF) (Fig. 6A, Table 2). A decrease in molecular weight in Western blots using an anti-FLAG antibody was adopted as an indicator for MT2 cleavage.
Figure 6.

MT2 cleaves ALK2 and ALK3 and decreases their full-length forms on cell surface. A, a representative diagram for all BMP receptors used in this study, including ALK2, ALK3, ActRIIA, and Bmpr2. All these receptors are type I transmembrane proteins with a short extracellular domain (∼120–150 amino acids), a transmembrane domain (PM), a large intracellular domain, and a C-terminal FLAG/Myc epitope (f/m). B, MT2 cleaves ALK2 in HEK293 cells. HEK293 cells in 12-well plates were co-transfected with an equal amount of pCMV6-ALK2 (2 μg), increasing amounts of pCMV6-MT2 or S762A-MT2 (0, 0.25, 0.5, 1.0, and 2.0 μg), and decreasing amounts of pEGFP-N1 (2.0, 1.75, 1.5, 1.0, and 0 μg). After 48 h of transfection, MT2 and ALK2 in ∼150 μg of cell lysate proteins were immunodetected by using anti-FLAG antibody, and β-actin and EGFP by specific antibodies. HEK293 cells (Ctrl) were included as a negative control. C, MT2 decreases full-length ALK2 on the cell surface. Co-transfection of HEK293 cells with pCMV6-ALK2 and pEGFP-N1, pCMV6-MT2, or S762A-MT2, and biotinylation of cell-surface proteins were performed essentially the same as described in the legend to Fig. 5C. The eluted cell-surface proteins and input lysate were subjected to SDS-PAGE and immunodetection of ALK2 and MT2 using an anti-FLAG antibody, and Na+K+-ATPase (NaK ATPase), β-actin, and EGFP by using specific antibodies. D and E, MT2 cleaves ALK3 in HEK293 cells (D) and decreases the full-length ALK3 on the cell surface (E). The experiments were performed as described above for ALK2 in B and C. ALK3 was immunodetected by using an anti-FLAG antibody. Two MT2/ALK3 images with different exposure times were presented (D). All experiments were repeated at least three times (technical replicate = 1; independent biological replicates ≥ 3) with consistent results.
ALK2 and ALK3 are the only type I BMP receptors expressed in the liver (25), and both are essential for full hepcidin expression (17). HEK293 cells were co-transfected with a constant amount of ALK2 plasmid DNA and an increasing amount of MT2 or S762A-MT2 plasmid DNA. As shown in Fig. 6B, a single ALK2 band migrating at ∼60 kDa was detected by the anti-FLAG antibody (lane 2). When MT2 was co-expressed, an additional ALK2 band migrating immediately below the full-length ALK2 appeared. The intensities of this lower band increased as more MT2 were expressed (Fig. 6B, lanes 3–6). In contrast, this lower band was not detected when the enzymatically inactive S762A-MT2 was co-expressed (Fig. 6B, lanes 7–9). Thus, this lower band likely represented the cleaved ALK2 by MT2. Because MT2 is predicted to cleave only the extracellular domain of a plasma membrane protein, a biotinylation approach was employed to analyze the changes of cell-surface ALK2. As shown in Fig. 6C, ALK2 was detected mainly in the fraction of the biotinylation eluate (lane 2 versus 6), suggesting a predominant cell-surface localization. When HEK293 cells were co-transfected with ALK2 and MT2 plasmid DNA at a 1:1 ratio, the level of cell-surface ALK2 was markedly decreased, and only a faint cleaved form of ALK2 was detectable (Fig. 6C, lane 6 versus 7, quantified in supplemental Fig. S1). A mild increase, rather than decrease, of full-length ALK2 was noticed when S762A-MT2 was co-expressed (Fig. 6C, lane 8, supplemental Fig. S1). These results indicate that MT2 was able to cleave cell-surface ALK2 and to decrease its cell surface localization in a distinctly different manner from Hjv.
MT2 cleavage of ALK3 was examined by using the same approach as described for ALK2. In the absence of MT2, ALK3 was detected predominantly as a single band at ∼74 kDa by an anti-FLAG antibody in HEK293 cell lysate (Fig. 6, D, lane 1, E, lane 2). In contrast to ALK2, co-transfection of ALK3 and MT2 plasmids at a ∼8:1 ratio resulted in a marked decrease in cell lysate ALK3 (Fig. 6, lane 1 versus 2). When more MT2 was expressed, nearly no ALK3 was detectable (Fig. 6D, lanes 3–5). Interestingly, a distinct ALK3 band that migrated immediately below the predominant form was detected only when ALK3 and MT2 were co-transfected at a 1:1 ratio of plasmid DNA (Fig. 6D, lane 5). This smaller ALK3 was likely to be cleaved from ALK3 by MT2, because it was not found by S762A-MT2 expression. In addition, the expression of S762A-MT2 led to no evident decrease in full-length ALK3 (Fig. 6D, lanes 6-8). These results suggest that ALK3 is more sensitive to MT2 cleavage than ALK2. Unexpectedly, the highest level of MT2 led to the stabilization of the cleaved form of ALK3. Similarly, expression of the protease-dead form of MT2, S762A-MT2, led to increased amounts of ALK3 (Fig. 6D; lane 8).
Cell surface biotinylation studies revealed that similar to ALK2, most ALK3 were detected on cell surface (Fig. 6E; lane 2 versus 6). Transfection of ALK3 and MT2 plasmid DNA at a 1:1 ratio resulted in a complete abolishment of the full-length ALK3 on cell surface and an appearance of the truncated form (Fig. 6E; lane 3 versus 7, supplemental Fig. S1). Because no decrease was detected in ALK3 when S762A-MT2 was expressed, these results indicate that MT2 is also able to cleave cell-surface ALK3.
MT2 cleaves type II Bmp receptors, ActRIIA and Bmpr2, on cell surface
We next tested whether MT2 also cleaves type II BMP receptors, ActRIIA and Bmpr2. The Bmp signaling is initiated upon BMP ligand binding to both type I and type II Bmp receptors. Liver-specific deletion of both ActRIIA and Bmpr2 genes in mice decreases hepcidin expression and causes iron overload (18). The short extracellular domains of both receptors contain arginine residues, which are potential cleavage sites of MT2. As shown in Fig. 7A, ActRIIA migrated at ∼94 kDa in SDS-PAGE. When MT2 was expressed, a lower ActRIIA band was detected by anti-FLAG antibody in the cell lysate. This band was intensified as MT2 levels were increasing with a reciprocal decrease of full-length ActRIIA. In contrast, no evident change was detected when the enzymatically inactive S762A-MT2 was co-expressed. Biotinylation analysis of cell-surface proteins showed that expression of MT2, but not S762A-MT2, markedly reduced the levels of full-length ActRIIA (Fig. 7B, supplemental Fig. S1). These results indicate that enzymatic activity is required for the cleavage of ActRIIA.
Figure 7.

MT2 cleaves AcRIIA and Bmpr2 and decreases their full-length forms on cell surface. A and B, MT2 cleaves ActRIIA (A) and decreases the full-length ActRIIA on the cell surface (B). Co-transfection of HEK293 cells with pCMV6-ActRIIA and pEGFP-N1, pCMV6-MT2, or S762A-MT2, biotinylation of cell-surface proteins, and immunodetection were performed essentially the same as described in the legend to Fig. 6, B and C. ActRIIA was detected by using an anti-FLAG antibody. C and D, MT2 cleaves Bmpr2 (C) and decreases the full-length Bmpr2 on cell surface (D). Experiments were performed as described above for ActRIIA. Bmpr2 was detected by using an anti-FLAG antibody. Two MT2/Bmpr2 images with different exposure times were presented (C). E and F, MT2 does not cleave Zip14 (E) and does not decrease cell-surface Zip14 (F). The experiments were performed as described above for ActRIIA and Bmpr2. Zip14 was immunodetected by using an anti-FLAG antibody. All experiments were repeated at least three times (technical replicate = 1; independent biological replicates ≥3) with consistent results.
Co-transfection studies also showed that expression of MT2, but not S762A-MT2, down-shifted the Bmpr2 bands in whole cell lysates and markedly abolished the full-length cell-surface Bmpr2 by Western blot analysis (Fig. 7, C and D, supplemental Fig. S1). These results suggest that Bmpr2 is also a substrate of MT2. Taken together, the above observations strongly indicate that MT2 cleaves all four Bmp receptors that are involved in hepcidin expression with ALK3 being the most sensitive substrate.
To rule out the possibility that transfection of MT2 into cells leads to an indiscriminate cleavage of plasma membrane proteins, we examined whether it cleaves Zip14. Zip14 is a transporter for iron, zinc, and manganese that is mainly expressed in the intestine and liver. It consists of an N-terminal extracellular domain of ∼150 amino acids, seven transmembrane segments, and a C-terminal intracellular domain. Its N-terminal extracellular sequence contains at least 6 arginine residues. It is not directly involved in hepcidin expression. Mouse Zip14 ORF with a C terminus 3×FLAG epitope was co-transfected with either MT2 or S762A-MT2 into HEK293 cells as described above for ALK2, ALK3, ActRIIA, and Bmpr2. Zip14 was immunodetected using an anti-FLAG antibody. As shown in Fig. 7, E and F, neither MT2 nor S762A-MT2 altered the levels or sizes of Zip14 both in whole cell lysates and on the cell surface by an anti-FLAG antibody (supplemental Fig. S1). In addition, the level of the endogenous Na+K+-ATPase, which is also a plasma membrane protein was unaffected by the expression of MT2 (Figs. 6, C and E, and 7, B, D, and F). These observations indicate that MT2 does not cleave Zip14 or Na+K+-ATPase and suggest that the observed MT2 cleavage of ALK2, ALK3, ActRIIA, and Bmpr2 are specific.
Hfe and Tfr2 are also potential substrates of MT2
Hfe and Tfr2 are membrane proteins that facilitate hepcidin expression in the liver (1). Hfe is a type I transmembrane protein that is mainly expressed in hepatocytes (23). Hfe trafficking onto the plasma membrane requires its association with β2-microglobulin (B2M). To determine whether MT2 cleaves Hfe, HEK293 cells were co-expressed with a constant amount of mouse Hfe/mouse B2M plasmid DNA at a 1:1 ratio and increasing amounts of mouse MT2 or S762A-MT2 plasmid DNA as described above for Hjv and Bmp receptors. The mouse Hfe construct contains a C-terminal FLAG/MYC epitope (Table 2). As shown in Fig. 8A, Hfe was predominantly detected as double bands (∼55 and ∼50 kDa) in SDS-PAGE by anti-FLAG antibody (lane 2, upper middle panel). These were due to the differential Asn-linked glycosylation of Hfe. Mouse Hfe sequence contains three potential Asn-glycosylation sites. Digestion with PNGase F, which cleaves both high-mannose and Golgi-modified complex oligosaccharides, was able to down-shift both Hfe bands to a single form (supplemental Fig. S2A). The upper band was likely the fully processed mature form, because it was the only band found on the cell surface by biotinylation (Fig. 8B). Similar to ALK3, co-transfection with MT2 and Hfe at about 1:8 ratio of plasmid DNA was able to markedly reduce the intensity of the upper Hfe band (Fig. 8A, lane 3). As MT2 levels increased, the upper Hfe band became almost undetectable. The intensities of the lower Hfe bands were also decreasing but to a lesser extent. These results suggest that MT2 preferentially cleaves the fully processed Hfe. Interestingly, a fragment of Hfe migrating at ∼17 kDa was also detected in cell lysate by immunodetection using an anti-FLAG antibody (Fig. 8A, lane 3). In contrast to Hjv, no soluble Hfe fragment was detected in the CM (data not shown) by an antibody against human HFE ectodomain that cross-reacts with mouse Hfe (supplemental Fig. S2B). This ∼17 kDa fragment likely resulted from MT2 cleavage of Hfe into small fragments. The additional minor Hfe bands migrating at ∼40 kDa at a higher exposure were likely the degradation products of Hfe because it was absent in untransfected control (Fig. 8A, lower middle panel). As expected, no evident change in the level of Hfe was detected when S762A-MT2 was expressed (Fig. 8A, lane 7-9). Consistently, biotinylation studies showed that expression of MT2, but not S762A-MT2, markedly reduced cell-surface Hfe (Fig. 8B, supplemental Fig. S3A). These results indicate that Hfe is also a substrate of MT2.
Figure 8.

MT2 cleaves Hfe and Tfr2. A, MT2 cleaves Hfe. HEK293 cells in 12-well plates were co-transfected with constant amounts of pCMV6-Hfe (1.33 μg) and pJB-1-B2M (1.33 μg), increasing amounts of pCMV6-MT2 or S762A-MT2 (0, 0.25, 0.5, 1.0, and 1.33 μg), and decreasing amounts of pEGFP-N1 (1.33, 1.08, 0.83, 0.33, and 0 μg). After 48 h of transfection, Hfe and MT2 in ∼150 μg of cell lysate, proteins were immunodetected by using anti-FLAG antibody, and β-actin and EGFP by specific antibodies. HEK293 cells (Ctrl) were included as a negative control. Two Hfe images with different exposure times are presented. B, MT2 decreases cell-surface Hfe. HEK293 cells were co-transfected with pCMV6-Hfe, pJB-1-B2M, and pEGFP-N1 or pCMV6-MT2 or S762A-MT2 at 1:1:1 ratios of plasmid DNA. Biotinylation of cell-surface proteins and immunodetection were performed essentially the same as described in the legend to Fig. 6C. Hfe was detected by using an anti-FLAG antibody. C and D, MT2 cleaves Tfr2. Co-transfection of HEK293 cells with pcDNA3-Tfr2 and pEGFP-N1, pCMV6-MT2, or S762A-MT2, biotinylation of cell-surface proteins, and immunodetection were performed essentially the same as described in the legend to Fig. 6, B and C. At about 24 h post-transfection, medium was changed to Opti-MEM, 1% FCS. Analysis was performed after another 24 h of incubation. About 600 μl of CM was collected for analysis of Tfr2 release. Tfr2 was detected by using a rabbit antibody against mouse Tfr2 extracellular domain. E, qRT-PCR analysis of MT2 mRNA in HepG2 cells and HepG2 cells stably expressing transfected-human MT2 (HepG2-MT2). Results are expressed as the amount relative to that of β-actin. n = 3 biological replicates. F, leupeptin inhibits the cleavage of HJV by endogenous MT2 in HepG2 cells. HepG2 cells stably expressing transfected-HJV (HepG2-HJV) were incubated in Opti-MEM, 1% FCS with or without 100 μm leupeptin (Leu) for about 18 h. Cell lysate (L) and CM were collected for immunodetection of HJV by an anti-HJV antibody. β-Actin was used as a loading control. In CM, the upper and lower HJV bands corresponded to the cleavage products by furin and MT2, respectively. G, leupeptin inhibits MT2 cleavage of endogenous TfR2 in HepG2 cells. HepG2 and HepG2-MT2 cells were incubated in Opti-MEM, 1% FCS with or without 100 μm leupeptin (Leu) for about 18 h. CM and cell lysate were collected. TfR2 in CM was immunoprecipitated by a mouse anti-TfR2 monoclonal antibody, and immunodetected by a rabbit anti-TfR2 antibody. About 5% of cell lysate (∼150 μg of proteins) was used for immunodetection of MT2, TfR2, and β-actin. All experiments were repeated at least three times (technical replicate = 1 or 2; independent biological replicates ≥ 3) with consistent results.
We employed the same co-transfection approach as described above to detect MT2 cleavage of Tfr2 in HEK293 cells. Tfr2 is a type II transmembrane protein that is predominantly expressed in the liver. As depicted in Fig. 8C, expression of MT2 resulted in a decrease in cell lysate Tfr2 by an antibody against the extracellular domain of mouse Tfr2. Distinct from Bmp receptors and Hfe, the extent of decrease remained relatively constant regardless of the increase in MT2 (Fig. 8C, lanes 3–6). At least two soluble Tfr2 fragments migrating at ∼80 and 36 kDa were detected in CM when wild-type MT2, not S762A-MT2, was co-expressed. Consistent with the observations in cell lysate, the levels of Tfr2 fragments in CM remained in similar levels (Fig. 8C, lanes 3–6). Further biotinylation analysis demonstrated a reduction of cell-surface Tfr2 when HEK293 cells were co-transfected with Tfr2 and MT2 plasmid DNA at a 1:1 ratio. No evident effect was noticed with co-transfection with S762A-MT2 (Fig. 8D, supplemental Fig. S3A). Together these results indicate that MT2 cleaves Tfr2, but the extent of cleavage seems independent of MT2 levels.
To determine whether MT2-mediated cleavage occurs for endogenously expressed TfR2, we examined HepG2 cells. HepG2 is a human hepatoma cell line that endogenously expresses both detectable TfR2 (49) and a low level of MT2 mRNA by qRT-PCR (Fig. 8E). Although the endogenous MT2 could not be immunodetected with our antibody, its enzymatic activity was readily detectable by using HJV as a substrate and MT2 siRNA (37). In HepG2 cells that were stably transfected with HJV, there were two major soluble HJV forms in CM (Fig. 8F). Previous studies showed that the upper band is the furin-cleaved product because it is blocked by incubation with furin convertase inhibitor (37). The lower band is the MT2-cleaved product because it was blocked by either incubation with 100 μm leupeptin (Fig. 8F) or MT2-siRNA knockdown (37). Leupeptin is a serine proteinase inhibitor that inhibits the hydrolytic activity of MT2 (28). We used HepG2 cells and HepG2 cells that stably express transfected MT2 (HepG2-MT2) at about 30-fold higher than endogenous MT2 mRNA (Fig. 8E) to determine the cleavage of endogenous TfR2. The endogenous TfR2 and transfected MT2 in cell lysate were readily detectable by Western blotting using antibodies against the extracellular domain of TfR2 and MT2, respectively (Fig. 8G). Interestingly, a faint TfR2 band migrating at ∼80 kDa was detected in the CM of HepG2 cells, and a moderately higher level in the CM of HepG2-MT2 cells (Fig. 8G, lane 1 versus 3). Incubation with leupeptin largely abolished the secretion of this soluble TfR2 from both HepG2 and HepG2-MT2 cells with no evident change of cellular TfR2 (Fig. 8G, lanes 2 and 4 versus 1 and 3). These results indicate that MT2 cleavage of TfR2 indeed occurs for the endogenously expressed proteins, and support the observations above in transfected cells that increased MT2 expression did not facilitate the cleavage of Tfr2.
Holo-Tf prevents MT2 cleavage of Tfr2, but not Bmp receptors or Hfe
Because Tf saturation in the circulation is positively correlated with hepatic hepcidin expression, we next examined whether holo-Tf inhibits the MT2 cleavage of Tfr2 or affects the ability of MT2 to cleave other substrates. HEK293 cells were co-transfected with ALK2, ALK3, ActRIIA, Bmpr2, fHfe/B2M, or Tfr2 and a similar amount of MT2 or EGFP at a 1:1 ratio of substrate plasmid to MT2/EGFP plasmids. After incubation with or without 30 μm holo-Tf for 24 h, Western blot analysis was employed to evaluate the MT2 cleavage of these proteins in cell lysate. In agreement with the observations above, expression of MT2 reduced the full-length forms of ALK2, ALK3, ActRIIA, Bmpr2, the higher molecular weight form of Hfe, and Tfr2 in the cell lysates in the absence of holo-Tf (Fig. 9, supplemental Fig. S3B). Interestingly, incubation with holo-Tf was able to prevent the decrease in Tfr2, but not ALK2, ALK3, ActRIIA, Bmpr2, or Hfe, by MT2 (Fig. 9, supplemental Fig. S3B). Expression of EGFP had no effect on the cleavage of any of the MT2 substrates as anticipated (Fig. 9). In contrast, when MT2 was not co-expressed, holo-Tf did not significantly alter the level of Tfr2 (Fig. 9A). As expected, incubation with holo-Tf elevated the levels of ferritin (Fig. 9), an iron storage protein that is induced by increased cellular iron load. Expression of MT2 did not significantly affect the increase in ferritin levels. Tfr2 binds holo-Tf, and no holo-Tf binding to Bmp receptors and Hfe has been reported. Thus, these observations suggest that the binding of holo-Tf to Tfr2, rather than the increased cellular iron load, blocks MT2 cleavage of Tfr2.
Figure 9.

Holo-Tf blocks MT2 cleavage of Tfr2 (A), but not ALK2 (B), ALK3 (C), ActRIIA (D), Bmpr2 (E), or Hfe (F). pcDNA3-Tfr2, pCMV6-ALK2, ALK3, ActRIIA, Bmpr2, or Hfe/B2M were co-transfected into HEK293 cells with an equal amount of pEGFP-N1 or pCMV6-MT2. At about 24 h post-transfection, medium was changed to Opti-MEM, 1% FCS with or without 30 μm holo-Tf (Tf). After another 24 h of incubation, cell lysate was collected for immunodetection of MT2, ALK2, ALK3, ActRIIA, Bmpr2, and Hfe by using an anti-FLAG antibody, and Tfr2, β-actin, and ferritin by using specific antibodies. All experiments were repeated at least three times (technical replicate = 1; independent biological replicates ≥3) with consistent results. G, a model for MT2 suppression of hepcidin expression. Bmp receptors, Hjv, Hfe, and Tfr2 form a complex with BMP6 at the plasma membrane to induce hepcidin expression through phosphorylation of SMAD1, -5, and -8. MT2 suppresses hepcidin expression by cleaving the extracellular portion of these membrane proteins.
BMP6 exhibits no evident effect on the proteolytic activity of MT2
We next examined whether BMP6 blocks MT2 cleavage of ALK2, ALK3, ActRIIA, Bmpr2, Hfe, Hjv, and Tfr2, because increased bodily iron load elevates hepcidin and BMP6 expression in the liver (8). The same co-transfection approach as described above for holo-Tf was employed. Results revealed no evident effect on MT2 cleavage of these proteins after incubation with BMP6 at 25 ng/ml for 24 h (supplemental Fig. S4). In Hep3B cells, a human hepatoma cell line, induction of hepcidin expression by BMP6 reaches a plateau at 25 ng/ml (50). These results suggest that the proteolytic activity of MT2 is not influenced by BMP6.
Discussion
In this study, we systemically investigated the potential mechanism for MT2 suppression of hepcidin expression. In vivo studies showed that increased MT2 expression was able to suppress hepcidin expression independently of Hjv and that distinct from MT2, Hjv was not normally a limiting factor. Consistently, expression of MT2 only mildly reduced cell-surface Hjv in transfected cells. Further studies revealed that MT2 cleaved cell-surface Bmp receptors that are involved in hepcidin expression, including ALK2, ALK3, ActRIIA, and Bmpr2. MT2 also markedly reduced cell-surface Hfe, and to a lesser extent, Tfr2. Interestingly, holo-Tf prevented MT2 cleavage of Tfr2, whereas BMP6 displayed no evident effect. All these observations indicate that Hjv is not the only substrate of MT2, and support the idea that MT2 suppresses hepcidin expression by cleaving multiple components of its induction pathway.
This study provided another line of evidence in support of the key role of hepatic MT2 in iron homeostasis. We obtained a new strain of global MT2 knock-out mice with a deletion of exons 1 to 3 of the MT2 gene. Homozygous MT2−/− mice recapitulated all the defects of iron deficiency as previously reported in other strains (31–33). MT2 is predominantly expressed in the liver and also at a relatively low level in the kidney and uterus (28, 34). Here we found that liver-specific expression of exogenous MT2 in MT2−/− mice was able to fully correct the low serum iron and high hepcidin mRNA expression, and to effectively rescue the alopecia and the anemia within 3 weeks. These observations suggest that MT2 expression in the liver is sufficient to maintain iron homeostasis. The parallel decrease in the mRNA levels of hepcidin and Id1, two downstream indicators of Bmp signaling, upon MT2 expression strengthens the idea that MT2 suppresses hepcidin expression through inhibiting the Bmp signaling.
Previous studies suggest that MT2 is a limiting factor for iron homeostasis (33, 51). At 3 weeks of age when a high iron demand is needed for the rapid growth, heterozygous MT2+/− mice display pronounced iron deficiency, exhibiting lower hemoglobin, and higher levels of hepatic hepcidin and Id1 mRNA (51). Adult MT2+/− mice at 8 weeks of age display trends toward decreases in serum iron, serum iron saturation, and the stored iron in the liver (33). Here we showed that increased MT2 in adult wild-type mice was able to significantly reduce hepcidin expression and increase serum iron levels. Lowered hepcidin allows more iron absorption from diet and more iron release into circulation from macrophages that digest senescent erythrocytes as well as from the liver that stores excess iron. The decrease of Id1 mRNA by increased MT2 indicates a suppression of the Bmp signaling. Together these observations reveal an inverse correlation of MT2 levels with hepcidin expression, and support the idea that MT2 is a limiting factor for Bmp signaling and hepcidin expression.
Hjv acts as a co-receptor to induce hepcidin expression through the Bmp signaling pathway (9). Deletion of both Hjv alleles in mice causes a marked decrease in hepcidin expression and severe iron overload (52, 53) with no significant change of MT2 mRNA level (Figs. 2A versus 3A). On the basis of the previous observations that MT2 cleaves HJV (36) and that mice lacking both Hjv and MT2 display a similar phenotype to Hjv−/− mice (33), the previous model predicts that MT2 suppresses hepcidin expression by decreasing cell-surface HJV (1). Because this previous model is challenged by the findings showing a lower, rather than a higher, level of plasma membrane Hjv in the liver of MT2−/− mice (42), this study systemically explored the underlying mechanism for MT2 suppression of hepcidin expression, and obtained three lines of evidence that argue against MT2 functioning through Hjv cleavage alone. First, we found that increased MT2 expression in Hjv−/− mice resulted in a further decrease in hepcidin expression, rather than no change as predicted by the model that MT2 acts solely to cleave HJV. Importantly, the extent of decrease was similar to that seen in wild-type mice. These findings indicate that MT2 could suppress hepcidin expression independently of Hjv. This idea is supported by the observations that depletion of bodily iron loading in Hjv−/− mice is still able to markedly decrease hepcidin expression (39, 44, 45).
The second line of evidence that argue against MT2 functioning through Hjv cleavage alone is that Hjv is not normally a limiting factor for hepcidin expression. In the liver of Hjv−/− mice, expression of Hjv mRNA at about 15% of wild-type mice fully rescues the low hepcidin status (45). In contrast to a trend of iron deficiency in MT2+/− mice (33, 51), Hjv+/− mice exhibit no significant increase in tissue iron loading (52, 53). Here we expressed Hjv mRNA up to ∼10-fold higher than the endogenous Hjv mRNA in the liver of wild-type mice, and revealed no significant increase in hepcidin expression. This is unlikely due to the limited supply of Bmp6, because the level of Bmp6 does not seem to be a limiting factor for hepcidin expression. In the liver of MT2−/− mice, the inappropriately high hepcidin expression is associated with a reduced level of Bmp6 mRNA (33). These observations indicate a lack of a correlation between the levels of Hjv and hepcidin expression in the liver, which is in contrast to MT2.
The third line of evidence that argue against MT2 functioning through Hjv cleavage alone is that expression of MT2 mildly decreased the cell-surface Hjv by the biotinylation approach. As a co-receptor, only cell-surface Hjv is supposed to be functional. This observation is different from a previous report showing a pronounced reduction of HJV accumulation on the cell surface by incubation with phosphoinositide-phospholipase C (PI-PLC) at 37 °C (36). PI-PLC cleaves the GPI anchor (Fig. 5A) and releases GPI-anchored proteins from the plasma membrane. These differential observations suggest that MT2 may either prevent PI-PLC getting access to the GPI-linker of HJV or reduces HJV trafficking onto plasma membrane. In this study, we did confirm that there were multiple MT2 cleavage sites in mouse Hjv as previously reported for human HJV (36). In HepG2 cells, we previously showed that release of HJV from the cells constitutes a major pathway of cellular HJV turnover (54). Here we found that in HepG2-HJV cells, inhibition of endogenous MT2 cleavage of HJV by leupeptin increased the intensity of furin-cleaved HJV band in CM (Fig. 8F). Similarly, co-transfection with MT2 in HEK293 cells (Fig. 5B) did not seem to significantly increase the total Hjv fragments in CM. Thus we predict that both furin and MT2 cleave the same pool of cellular HJV through a similar mechanism but at different residues. As a result, expression of MT2 reduces the detection of furin cleavage products of Hjv but displays a mild effect on the cell-surface Hjv level. Together, all these observations suggest that MT2 may exert its inhibitory effect on hepcidin expression by cleaving the key components of the hepcidin induction pathway other than Hjv.
Normal ranges of hepcidin expression in the liver require type I Bmp receptors, ALK2 and ALK3, as well as type II Bmp receptors, ActRIIA and Bmpr2 (17, 18). They are the only BMP receptors expressed in the liver (18, 25). Here we presented evidence showing that MT2 cleaves all these receptors and markedly reduces their full-length forms on cell surface. This cleavage process depends on the enzymatic activity of MT2, because no decrease, rather than an increase for cell surface ALK2 and ALK3, was observed when the enzymatically inactive S762A-MT2 was expressed. Importantly, our results indicate that this cleavage event does not seem to occur indiscriminately to all plasma membrane proteins, because MT2 did not cleave Zip14 and the endogenous Na+K+-ATPase in this study and neogenin in our previous study (55). Neogenin interacts with both HJV and MT2, and it facilitates MT2 cleavage of HJV (55). A recent study shows a co-immunoprecipitation of ALK2 with MT2 (56). This finding supports the idea that MT2 cleavage of Bmp receptors is not a random process, and implies that the stabilized cell-surface ALK2 and ALK3 by S762A-MT2 might result from their direct or indirect interaction that prevents the degradation. Distinct from Hjv, the majority of Bmp receptors were detected on plasma membrane. All Bmp receptors have short extracellular domains with various numbers of arginine residues, the favorable cleavage sites by the serine protease MT2 as demonstrated in HJV (35). The extracellular domains of Bmp receptors are essential for the initiation of Bmp signaling by binding to Bmp ligands. Although the precise MT2 cleavage sites in Bmp receptors have been mapped, we predict that removal of any portion of the extracellular domain would diminish their binding affinity to Bmp ligands, which will consequently lower Bmp signaling and hepcidin expression. Nevertheless, the physiological significance for MT2 cleavage of Bmp receptors in iron homeostasis remains to be verified in vivo.
We also found that MT2 cleaved Hfe, which resulted in decreased cell-surface localization. Hfe facilitates hepcidin expression through the Bmp signaling pathway but to a much lesser extent than Hjv (6). Relative to a marked decrease of hepcidin expression in Hjv−/− mice (52, 53), deletion of both Hfe alleles in mice only leads to a mild reduction in hepcidin expression (57, 58). As a result, it is not surprising that double Hfe−/−Hjv−/− mice exhibit an indistinguishable phenotype to single Hjv−/− mice (58) and that double mutant mice lacking functional Hfe and MT2 mimic the phenotype of MT2 mutant animals (41, 57). Because MT2 is a robust suppressor for hepcidin expression and it cleaved multiple substrates, these observations may not conclusively rule out the possibility that Hfe is a substrate of MT2 as previously predicted (41). Rather our data strongly indicate Hfe as a potent substrate of MT2 although this remains to be determined by further in vivo studies.
Additionally, our results indicate that MT2 mildly cleaved Tfr2 in a distinct fashion from Bmp receptors and Hfe in transfected cells. The cleavage of Tfr2 by MT2 relied on its enzymatic activity, but the extent of cleavage was independent of the levels of MT2. Interestingly, holo-Tf prevented the decrease of Tfr2, but not Bmp receptors or Hfe, by MT2. Similar results are reported by a recent study in HuH7 cells (59), another human hepatoma cell line. In HuH7 cells, expression of TfR2 leads to a secretion of soluble TfR2 into the medium, and holo-Tf inhibits the secretion of TfR2 with no evident increase in cellular TfR2. However, the identity of the protease was not addressed (59). Thus it is likely that holo-Tf binding to TfR2 blocks the MT2 cleavage site in TfR2. Previous studies demonstrate that holo-Tf stabilizes hepatic Tfr2 by redirecting it into recycling endosomes (49, 60, 61). Results from the present and other studies (59) suggest that stabilization of Tfr2 by holo-Tf at least partially results from blocking the cleavage by MT2. Besides, we also obtained evidence showing that MT2 cleavage of TfR2 occurred for the endogenously expressed proteins in HepG2 cells. This observation indicates that the MT2 cleavage of Bmp receptors and Hfe may be physiologically relevant.
In contrast to holo-Tf, no evident effect of BMP6 was found on MT2 cleavage of ALK2, ALK3, ActRIIA, Bmpr2, Hjv, Hfe, and Tfr2. This is consistent with the idea that BMP6 is an essential, but not a limiting, factor for hepcidin expression. Deletion of both Bmp6 alleles in either wild-type or MT2−/− mice leads to a similar extent of decrease in hepatic hepcidin and Id1 expression (62). MT2−/− mice have a reduced hepatic Bmp6 expression but an inappropriately high level of hepcidin mRNA in the liver (33).
In summary, this study provided evidence showing that MT2 could suppress hepcidin expression independently of Hjv. Results revealed that MT2 also cleaves other key components of the hepcidin induction pathway besides Hjv, including at least ALK2, ALK3, ActRIIA, Bmpr2, Hfe, and to a lesser extent, Tfr2. Thus, MT2 has multiple substrates. Our results do not exclude the existence of additional unidentified substrates of MT2. On the basis of these observations, we propose a model in which MT2 exerts its inhibitory effect on hepcidin expression by cleaving and inactivating multiple key elements, rather than Hjv alone (Fig. 9G). This model remains to be determined in vivo.
Experimental procedures
cDNA constructs
We purchased mouse MT2 (NM_027902.1), ALK2 (NM_007394.1), ALK3 (NM_009758.3), ActRIIA (NM_007396.1), Bmpr2 (NM_007561.3), and Hfe (NM_010424.1) ORF with a C-terminal FLAG/MYC epitope in pCMV6 vector (pCMV6-MT2, ALK2, ALK3, ActRIIA, Bmpr2, and Hfe) from Origene (Table 2). The entire sequences of all the plasmids were validated by DNA sequencing. Mouse Hjv ORF with a N-terminal 3×FLAG epitope in pCMV9 vector (pCMV9-Hjv) was generated in our previous study (39). Mouse Zip14 ORF (NM_001135152.1) with a C-terminal 3×FLAG epitope in pEGFP-N1 vector (pEGFP-N1-Zip14) was generated by subcloning Zip14 ORF with a C-terminal 3×FLAG epitope into pEGFP-N1 vector, in which a stop codon was added immediately after the FLAG sequence and before the EGFP sequence. Thus the EGFP sequence was not translated in transfected cells. The entire sequence was confirmed by sequencing. MT2 with a serine to alanine substitution at amino acid 762 (S762A-MT2) and MT2 with deletion of the catalytic domain (MT2-mask) (Fig. 1A) were generated by site-directed mutagenesis using pCMV6-MT2 as a template and the QuikChange kit (Stratagene). After verification by sequencing, MT2 and MT2-mask constructs were subcloned into an AAV8 construct containing a strong liver-specific promoter as described in our previous study (45). The liver-specific promoter is a combination of two copies of a human α1-microglobulin/bikunin enhancer and the promoter from the human thyroid hormone-binding globulin gene. The AAV8-Hjv construct was generated by subcloning FLAG-tagged Hjv ORF into AAV8 (39). AAV8-MT2, MT2-mask, and Hjv vectors were generated at the Molecular Virology Support Core, Oregon Health & Science University. pcDNA3-Tfr2 construct was generated by subcloning mouse Tfr2 ORF into pcDNA3, and the sequence was confirmed by DNA sequencing. We obtained pEGFP-N1 plasmid from Clontech, and pJB-1-mouse B2M from Dr. Pamela Bjorkman at CalTech.
Animal studies
All animal procedures were approved by the Oregon Health & Science University, Department of Comparative Medicine (OHSU DCM). Heterozygous MT2 mutant mice on B6/129 background were purchased from Lexion/Mutant Mouse Resource and Research Center (B6;129S5-Tmprss6tm1Lex/Mmucd, 032683-UCD). Mutant mice were generated by homologous recombination to replace the MT2 genomic region spanning from exon 1 to 3. This genomic region encodes amino acids 1 to 123 of the MT2 protein, which comprises the cytoplasmic domain, transmembrane domain, and a portion of the extracellular SEA domain (Fig. 1A). Heterozygous MT2 mutant mice were bred on mixed background to generate wild-type and homozygous MT2−/− mice. Animals were genotyped by PCR using genomic DNA from toe clips. Hjv−/− mice on 129/SvEvTac (129S) background were obtained from Dr. Nancy Andrews (Duke University). Both Hjv−/− and the corresponding wild-type 129/S mice were bred and maintained in the DCM of OHSU.
We used MT2−/− mice to examine the function of MT2 with a C-terminal FLAG/MYC epitope in vivo. Eight-week-old MT2−/− mice of both genders of F1 generation were intraperitoneally injected with AAV8-MT2 or AAV8-MT2-mask at dosages indicated in the figure legends. Injection of PBS vehicle was included as control. Three weeks later, mice were euthanized for analysis. Blood was collected by cardiac puncture for serum iron and hematology analysis. Livers were rapidly removed, snap-frozen in liquid nitrogen, and then stored at −80 °C for qRT-PCR, Western blot, and tissue non-heme iron assays. Age, gender, and background-matched wild-type mice were included as additional controls.
We used 8-week-old male Hjv−/− and wild-type 129S mice to examine the effects of increased MT2 or Hjv expression in the liver on hepcidin expression. Animals were intraperitoneally injected with AAV8-MT2, MT2-mask, or Hjv at dosages indicated in the figure legends. Experiments were performed as described above for MT2−/− mice. Each group consisted of at least 4 animals. The viral vector stocks were handled according to Biohazard Safety Level 2 guidelines published by the NIH.
qRT-PCR
qRT-PCR analysis of β-actin, MT2, hepcidin, Bmp6, and Id1 transcripts in the liver were conducted as previously described (45). All primers were verified for linearity of amplification. The results are expressed as the amount relative to that of β-actin for each sample.
Blood parameters, serum iron, and the liver non-heme iron assays
Blood parameters for MT2−/− mice were measured using Hemavet 950 (Drew Scientific). Serum iron concentrations were measured using a serum iron/TIBC Reagent Set (Teco Diagnostics, Anaheim, CA). Non-heme iron concentrations in the liver tissues were determined as previously described (52) with the following modifications. Briefly, 50–150 mg wet liver tissues were digested in 250–750 μl of acid buffer (5) at 65 °C for 72 h. The supernatant was collected by centrifugation at 10,000 × g for 5 min, followed by the addition of chromogen (1.86 mm bathophenanthroline sulfonate, 143 mm thioglycolic acid in water) and OD measurement at 535 nm. Each sample was measured twice in triplicate. The iron concentration is expressed as micrograms of iron per gram of wet tissue.
Immunodetection of hepatic MT2 and Hjv proteins in mice
About 300 μg of liver extract proteins were separated by using SDS-PAGE under reducing conditions. We used Ponceau S staining to ensure equal transfer of proteins onto the nitrocellulose membrane. The AAV8-introduced exogenous MT2 and Hjv were probed directly by using an HRP-coupled mouse anti-FLAG M2 IgG (1:10,000; Sigma) and chemiluminescence (Super Signal, Pierce) to reduce the nonspecific background. β-Actin was immunodetected with a mouse anti-β-actin (1:10,000; Sigma), immunodetected by using an Alexa Fluor 800 goat anti-mouse secondary antibody (1:10,000; Invitrogen), and visualized by using an Odyssey Infrared Imaging System (Li-Cor).
Cell lines and transfection
HEK293 cells were obtained from ATCC and maintained in DMEM, 10% fetal calf serum (FCS). We used transient co-transfection with Lipofectamine 2000 (Invitrogen) to determine the potential substrates of MT2. Briefly, HEK293 cells in 12-well plates were co-transfected with the same amount of pCMV9-Hjv, pEGFP-N1-Zip14, pCMV6-ALK2, ALK3, ActRIIA, Bmpr2, Hfe/B2M, or pcDNA3-Tfr2 ORF plasmid DNA, an increasing amount of pCMV6-MT2, S762A-MT2, or MT2-mask plasmid DNA, and a decreasing amount of pEGFP-N1 plasmid DNA. All cells were transfected with equal amounts of total plasmid DNA. After 48 h of transfection, cell lysates were collected, and protein concentrations were determined using a Pierce BCA protein assay kit (Thermo). Lysate protein (∼150 μg) was then subjected to SDS-PAGE. We used Ponceau S staining to ensure equal transfer of proteins onto the nitrocellulose membrane. Hjv, ALK2, ALK3, ActRIIA, Bmpr2, Hfe, and Zip14 were immunodetected by using an HRP-coupled mouse anti-FLAG M2 IgG and chemiluminescence. Tfr2, EGPF, and β-actin in cell lysates were probed with rabbit anti-Tfr2 (number 25257), mouse anti-GFP (ProteinTECH), and mouse anti-β-actin, respectively, immunodetected by using an Alexa Fluor 680 goat anti-rabbit secondary antibody (1:10,000; Invitrogen) or an Alexa Fluor 800 goat anti-mouse secondary antibody, and visualized by Li-Cor. To test the effects of holo-Tf or BMP6 on MT2 cleavage, medium was changed to Opti-MEM, 1% FCS with or without 30 μm holo-Tf (low endotoxin; Calbiochem) or 25 ng/ml of BMP6 (Cell Signaling Technology) at ∼24 h post-transfection. Cell lysate was collected for analysis after another ∼24 h of incubation. To detect the cleaved Hjv and Tfr2 in CM, medium was changed to Opti-MEM, 1% FCS at ∼30 h post-transfection. CM was collected after ∼18 h of incubation. Proteins in CM were first precipitated by using 6% TCA, followed by resuspending the protein pellets with 1× Laemmli buffer and subjecting to SDS-PAGE. Hjv in CM was probed with both an HRP-coupled mouse anti-FLAG M2 IgG and a rabbit anti-HJV antibody generated against the entire sequence of human HJV (37). The latter was able to detect the cleavage products of Hjv by both furin and MT2. Tfr2 in CM was detected as described above for cell lysate Tfr2.
HepG2 cells were purchased from ATCC and maintained in MEM, 10% FCS. HepG2 cells that stably express the transfected human HJV (HepG2-HJV) or human MT2 (HepG2-MT2) were generated previously (55). To determine the effect of leupeptin on HJV release, HepG2-HJV cells were plated in 12-well plates in complete medium. After ∼30 h of incubation, medium was changed to Opti-MEM, 1% FCS with or without 100 μm leupeptin. CM was collected after ∼18 h of culture, and proteins were precipitated by TCA as described above. HJV in CM and cell lysate was detected as described above for Hjv by using anti-HJV antibody. To examine the effects of leupeptin on MT2 cleavage of endogenous TfR2, HepG2 and HepG2-MT2 cells were plated in 100-mm plates in complete medium and incubated with or without 100 μm leupeptin. TfR2 in entire CM was immunoprecipitated by an anti-TfR2 monoclonal antibody, followed by immunodetection with a rabbit anti-TfR2 antibody. About 5% of cell lysate (∼150 μg of lysate proteins) was loaded onto SDS-PAGE for immunodetection of TfR2 and β-actin by Li-Cor.
Biotinylation of cell-surface proteins
HEK293 cells were plated in the polylysine-coated 6-well plate and co-transfected with the same amount of pCMV9-Hjv, pEGFP-N1-Zip14, pCMV6-ALK2, ALK3, ActRIIA, Bmpr2, Hfe/B2M, or pcDNA3-Tfr2 plasmid DNA, and the same amounts of pEGFP-N1, pCMV6-MT2, or S762A-MT2 plasmid DNA. After 48 h of transfection, cell-surface proteins were biotinylated with 0.25 mg/ml of Sulfo-NHS-Biotin (Thermo Fisher Scientific) at 4 °C for 30 min. After the reaction was terminated, cells were immediately solubilized in NET, 1% Triton X-100, 1× protease inhibitors mixture (Roche Applied Science). Biotinylated proteins were isolated by using streptavidin-agarose beads (Thermo Fisher Scientific). Bound proteins were eluted with NET-Triton X-100, 1× Laemmli buffer. Both the eluate (cell surface proteins) and a fraction of cell lysate (input) were subjected to SDS-PAGE and probed with mouse anti-Na+/K+-ATPase α1 (Santa Cruz) as well as the antibodies as described in the figure legends. The intensities of biotinylated full-length ALK2, ALK3, ActRIIA, and Bmpr2 bands, as well as the total biotinylated cell-surface Hfe bands, in X-ray films were quantified by using ImageJ software. The intensities of biotinylated cell surface Tfr2 bands were visualized and quantified by using a Li-Cor.
PNGase F digestion
PNGase F was used to analyze the Asn-linked oligosaccharides on Hfe in cell lysate. Briefly, prepared samples were incubated with PNGase F (New England Biolabs) according to the manufacturer's instruction. After 1.5 h of incubation at 37 °C, the digested samples were subjected to Western blot analysis of Hfe, MT2, GFP, and β-actin as described for immunodetection.
Statistical analysis
Paired and two-tailed Student's t test was used to compare two sets of data. One-way analysis of variance and Tukey's post-test were used to compare three or more sets of data.
Author contributions
C. A. E. and A. Z. designed the experiments, analyzed the data, and wrote the paper. M. W., A. W. W., M. D. K., N. Z., S. J., and A. Z. performed the experiments.
Supplementary Material
Acknowledgments
We thank Dr. Dayana Contreras and Dr. Peizhong Mao for critical reading of the manuscript and helpful comments, Dr. Nancy Andrews at Duke University for Hjv−/− mice, and the Molecular Virology Support Core of OHSU for the generation of AAV8 vectors.
This work was supported by National Institutes of Health Grants R01DK102791 (to A. S. Z.), R01DK072166 (to C. A. E.), and R00DK104066 (to N. Z.). The authors declare that they have no conflicts of interest with the contents of this article. The content is solely the responsibility of the authors and does not necessarily represent the official views of the National Institutes of Health.
This article contains supplemental Figs. S1–S4.
- BMP
- bone morphogenetic protein
- HJV
- hemojuvelin
- HFE
- hemochromatosis protein
- TfR2
- transferrin receptor-2
- GPI
- glycosylphosphatidylinositol
- MT2
- matriptase-2
- CM
- conditioned medium
- qRT
- quantitative RT
- EGFP
- enhanced green fluorescent protein
- B2M
- β2-microglobulin
- PNGase F
- peptide:N-glycosidase F
- AAV8
- adeno-associated virus 8
- PI-PLC
- phosphoinositide-phospholipase C
- MEM
- minimal essential medium.
References
- 1. Muckenthaler M. U., Rivella S., Hentze M. W., and Galy B. (2017) A red carpet for iron metabolism. Cell 168, 344–361 [DOI] [PMC free article] [PubMed] [Google Scholar]
- 2. Valore E. V., and Ganz T. (2008) Posttranslational processing of hepcidin in human hepatocytes is mediated by the prohormone convertase furin. Blood Cells Mol. Dis. 40, 132–138 [DOI] [PMC free article] [PubMed] [Google Scholar]
- 3. Nemeth E., Tuttle M. S., Powelson J., Vaughn M. B., Donovan A., Ward D. M., Ganz T., and Kaplan J. (2004) Hepcidin regulates cellular iron efflux by binding to ferroportin and inducing its internalization. Science 306, 2090–2093 [DOI] [PubMed] [Google Scholar]
- 4. Roetto A., Papanikolaou G., Politou M., Alberti F., Girelli D., Christakis J., Loukopoulos D., and Camaschella C. (2003) Mutant antimicrobial peptide hepcidin is associated with severe juvenile hemochromatosis. Nat. Genet. 33, 21–22 [DOI] [PubMed] [Google Scholar]
- 5. Torrance J. D., and Bothwell T. H. (1968) A simple technique for measuring storage iron concentrations in formalinised liver samples. S. Afr. J. Med. Sci. 33, 9–11 [PubMed] [Google Scholar]
- 6. Ganz T., and Nemeth E. (2012) Hepcidin and iron homeostasis. Biochim. Biophys. Acta 1823, 1434–1443 [DOI] [PMC free article] [PubMed] [Google Scholar]
- 7. Weinstein D. A., Roy C. N., Fleming M. D., Loda M. F., Wolfsdorf J. I., and Andrews N. C. (2002) Inappropriate expression of hepcidin is associated with iron refractory anemia: implications for the anemia of chronic disease. Blood 100, 3776–3781 [DOI] [PubMed] [Google Scholar]
- 8. Kautz L., Meynard D., Monnier A., Darnaud V., Bouvet R., Wang R. H., Deng C., Vaulont S., Mosser J., Coppin H., and Roth M. P. (2008) Iron regulates phosphorylation of Smad1/5/8 and gene expression of Bmp6, Smad7, Id1, and Atoh8 in the mouse liver. Blood 112, 1503–1509 [DOI] [PubMed] [Google Scholar]
- 9. Babitt J. L., Huang F. W., Wrighting D. M., Xia Y., Sidis Y., Samad T. A., Campagna J. A., Chung R. T., Schneyer A. L., Woolf C. J., Andrews N. C., and Lin H. Y. (2006) Bone morphogenetic protein signaling by hemojuvelin regulates hepcidin expression. Nat. Genet. 38, 531–539 [DOI] [PubMed] [Google Scholar]
- 10. Wang R. H., Li C., Xu X., Zheng Y., Xiao C., Zerfas P., Cooperman S., Eckhaus M., Rouault T., Mishra L., and Deng C. X. (2005) A role of SMAD4 in iron metabolism through the positive regulation of hepcidin expression. Cell Metab. 2, 399–409 [DOI] [PubMed] [Google Scholar]
- 11. Feng X. H., and Derynck R. (2005) Specificity and versatility in TGF-β signaling through Smads. Annu. Rev. Cell Dev. Biol. 21, 659–693 [DOI] [PubMed] [Google Scholar]
- 12. Zhang A. S., Anderson S. A., Wang J., Yang F., DeMaster K., Ahmed R., Nizzi C. P., Eisenstein R. S., Tsukamoto H., and Enns C. A. (2011) Suppression of hepatic hepcidin expression in response to acute iron deprivation is associated with an increase of matripatase-2 protein. Blood 117, 1687–1699 [DOI] [PMC free article] [PubMed] [Google Scholar]
- 13. Canali S., Zumbrennen-Bullough K. B., Core A. B., Wang C. Y., Nairz M., Bouley R., Swirski F. K., and Babitt J. L. (2017) Endothelial cells produce bone morphogenetic protein 6 required for iron homeostasis in mice. Blood 129, 405–414 [DOI] [PMC free article] [PubMed] [Google Scholar]
- 14. Koch P. S., Olsavszky V., Ulbrich F., Sticht C., Demory A., Leibing T., Henzler T., Meyer M., Zierow J., Schneider S., Breitkopf-Heinlein K., Gaitantzi H., Spencer-Dene B., Arnold B., Klapproth K., et al. (2017) Angiocrine Bmp2 signaling in murine liver controls normal iron homeostasis. Blood 129, 415–419 [DOI] [PMC free article] [PubMed] [Google Scholar]
- 15. Andriopoulos B. Jr., Corradini E., Xia Y., Faasse S. A., Chen S., Grgurevic L., Knutson M. D., Pietrangelo A., Vukicevic S., Lin H. Y., and Babitt J. L. (2009) BMP6 is a key endogenous regulator of hepcidin expression and iron metabolism. Nat. Genet. 41, 482–487 [DOI] [PMC free article] [PubMed] [Google Scholar]
- 16. Meynard D., Kautz L., Darnaud V., Canonne-Hergaux F., Coppin H., and Roth M. P. (2009) Lack of the bone morphogenetic protein BMP6 induces massive iron overload. Nat. Genet. 41, 478–481 [DOI] [PubMed] [Google Scholar]
- 17. Steinbicker A. U., Bartnikas T. B., Lohmeyer L. K., Leyton P., Mayeur C., Kao S. M., Pappas A. E., Peterson R. T., Bloch D. B., Yu P. B., Fleming M. D., and Bloch K. D. (2011) Perturbation of hepcidin expression by BMP type I receptor deletion induces iron overload in mice. Blood 118, 4224–4230 [DOI] [PMC free article] [PubMed] [Google Scholar]
- 18. Mayeur C., Leyton P. A., Kolodziej S. A., Yu B., and Bloch K. D. (2014) BMP type II receptors have redundant roles in the regulation of hepatic hepcidin gene expression and iron metabolism. Blood 124, 2116–2123 [DOI] [PMC free article] [PubMed] [Google Scholar]
- 19. Wang C. Y., Core A. B., Canali S., Zumbrennen-Bullough K. B., Ozer S., Umans L., Zwijsen A., and Babitt J. L. (2017) Smad1/5 is required for erythropoietin-mediated suppression of hepcidin in mice. Blood 130, 73–83 [DOI] [PMC free article] [PubMed] [Google Scholar]
- 20. Papanikolaou G., Samuels M. E., Ludwig E. H., MacDonald M. L., Franchini P. L., Dubé M. P., Andres L., MacFarlane J., Sakellaropoulos N., Politou M., Nemeth E., Thompson J., Risler J. K., Zaborowska C., Babakaiff R., et al. (2004) Mutations in HFE2 cause iron overload in chromosome 1q-linked juvenile hemochromatosis. Nat. Genet. 36, 77–82 [DOI] [PubMed] [Google Scholar]
- 21. Lee D. H., Zhou L. J., Zhou Z., Xie J. X., Jung J. U., Liu Y., Xi C. X., Mei L., and Xiong W. C. (2010) Neogenin inhibits HJV secretion and regulates BMP-induced hepcidin expression and iron homeostasis. Blood 115, 3136–3145 [DOI] [PMC free article] [PubMed] [Google Scholar]
- 22. Zhang A. S., Yang F., Wang J., Tsukamoto H., and Enns C. A. (2009) Hemojuvelin-neogenin interaction is required for bone morphogenic protein-4-induced hepcidin expression. J. Biol. Chem. 284, 22580–22589 [DOI] [PMC free article] [PubMed] [Google Scholar]
- 23. Zhang A. S., Xiong S., Tsukamoto H., and Enns C. A. (2004) Localization of iron metabolism-related mRNAs in rat liver indicate that HFE is expressed predominantly in hepatocytes. Blood 103, 1509–1514 [DOI] [PubMed] [Google Scholar]
- 24. Zhang A. S., West A. P. Jr, Wyman A. E., Bjorkman P. J., and Enns C. A. (2005) Interaction of hemojuvelin with neogenin results in iron accumulation in human embryonic kidney 293 cells. J. Biol. Chem. 280, 33885–33894 [DOI] [PubMed] [Google Scholar]
- 25. Xia Y., Babitt J. L., Sidis Y., Chung R. T., and Lin H. Y. (2008) Hemojuvelin regulates hepcidin expression via a selective subset of BMP ligands and receptors independently of neogenin. Blood 111, 5195–5204 [DOI] [PMC free article] [PubMed] [Google Scholar]
- 26. D'Alessio F., Hentze M. W., and Muckenthaler M. U. (2012) The hemochromatosis proteins HFE, TfR2, and HJV form a membrane-associated protein complex for hepcidin regulation. J. Hepatol. 57, 1052–1060 [DOI] [PubMed] [Google Scholar]
- 27. Zhao N., Zhang A. S., and Enns C. A. (2013) Iron regulation by hepcidin. J. Clin. Invest. 123, 2337–2343 [DOI] [PMC free article] [PubMed] [Google Scholar]
- 28. Velasco G., Cal S., Quesada V., Sánchez L. M., and López-Otín C. (2002) Matriptase-2, a membrane-bound mosaic serine proteinase predominantly expressed in human liver and showing degrading activity against extracellular matrix proteins. J. Biol. Chem. 277, 37637–37646 [DOI] [PubMed] [Google Scholar]
- 29. Ramsay A. J., Hooper J. D., Folgueras A. R., Velasco G., and López-Otín C. (2009) Matriptase-2 (TMPRSS6): a proteolytic regulator of iron homeostasis. Haematologica 94, 840–849 [DOI] [PMC free article] [PubMed] [Google Scholar]
- 30. Finberg K. E., Heeney M. M., Campagna D. R., Aydinok Y., Pearson H. A., Hartman K. R., Mayo M. M., Samuel S. M., Strouse J. J., Markianos K., Andrews N. C., and Fleming M. D. (2008) Mutations in TMPRSS6 cause iron-refractory iron deficiency anemia (IRIDA). Nat. Genet. 40, 569–571 [DOI] [PMC free article] [PubMed] [Google Scholar]
- 31. Folgueras A. R., de Lara M. F., Pendás A. M., Garabaya C., Rodríguez F., Astudillo A., Bernal T., Cabanillas R., López-Otín C., and Velasco G. (2008) The membrane-bound serine protease matriptase-2 (Tmprss6) is an essential regulator of iron homeostasis. Blood 112, 2539–2545 [DOI] [PubMed] [Google Scholar]
- 32. Du X., She E., Gelbart T., Truksa J., Lee P., Xia Y., Khovananth K., Mudd S., Mann N., Moresco E. M., Beutler E., and Beutler B. (2008) The serine protease TMPRSS6 is required to sense iron deficiency. Science 320, 1088–1092 [DOI] [PMC free article] [PubMed] [Google Scholar]
- 33. Finberg K. E., Whittlesey R. L., Fleming M. D., and Andrews N. C. (2010) Downregulation of Bmp/Smad signaling by Tmprss6 is required for maintenance of systemic iron homeostasis. Blood 115, 3817–3826 [DOI] [PMC free article] [PubMed] [Google Scholar]
- 34. Hooper J. D., Campagnolo L., Goodarzi G., Truong T. N., Stuhlmann H., and Quigley J. P. (2003) Mouse matriptase-2: identification, characterization and comparative mRNA expression analysis with mouse hepsin in adult and embryonic tissues. Biochem. J. 373, 689–702 [DOI] [PMC free article] [PubMed] [Google Scholar]
- 35. Rausa M., Ghitti M., Pagani A., Nai A., Campanella A., Musco G., Camaschella C., and Silvestri L. (2015) Identification of TMPRSS6 cleavage sites of hemojuvelin. J. Cell Mol. Med. 19, 879–888 [DOI] [PMC free article] [PubMed] [Google Scholar]
- 36. Silvestri L., Pagani A., Nai A., De Domenico I., Kaplan J., and Camaschella C. (2008) The serine protease matriptase-2 (TMPRSS6) inhibits hepcidin activation by cleaving membrane hemojuvelin. Cell Metab. 8, 502–511 [DOI] [PMC free article] [PubMed] [Google Scholar]
- 37. Maxson J. E., Chen J., Enns C. A., and Zhang A. S. (2010) Matriptase-2- and proprotein convertase-cleaved forms of hemojuvelin have different roles in the down-regulation of hepcidin expression. J. Biol. Chem. 285, 39021–39028 [DOI] [PMC free article] [PubMed] [Google Scholar]
- 38. Lin L., Nemeth E., Goodnough J. B., Thapa D. R., Gabayan V., and Ganz T. (2008) Soluble hemojuvelin is released by proprotein convertase-mediated cleavage at a conserved polybasic RNRR site. Blood Cells Mol. Dis. 40, 122–131 [DOI] [PMC free article] [PubMed] [Google Scholar]
- 39. Zhao N., Maxson J. E., Zhang R. H., Wahedi M., Enns C. A., and Zhang A. S. (2016) Neogenin facilitates the induction of hepcidin expression by hemojuvelin in the liver. J. Biol. Chem. 291, 12322–12335 [DOI] [PMC free article] [PubMed] [Google Scholar]
- 40. Truksa J., Gelbart T., Peng H., Beutler E., Beutler B., and Lee P. (2009) Suppression of the hepcidin-encoding gene Hamp permits iron overload in mice lacking both hemojuvelin and matriptase-2/TMPRSS6. Br. J. Haematol. 147, 571–581 [DOI] [PubMed] [Google Scholar]
- 41. Lee P., Hsu M. H., Welser-Alves J., and Peng H. (2012) Severe microcytic anemia but increased erythropoiesis in mice lacking Hfe or Tfr2 and Tmprss6. Blood Cells Mol. Dis. 48, 173–178 [DOI] [PMC free article] [PubMed] [Google Scholar]
- 42. Krijt J., Fujikura Y., Ramsay A. J., Velasco G., and Nečas E. (2011) Liver hemojuvelin protein levels in mice deficient in matriptase-2 (Tmprss6). Blood Cells Mol. Dis. 47, 133–137 [DOI] [PubMed] [Google Scholar]
- 43. Gurieva I., Frýdlová J., Rychtarčiková Z., Vokurka M., Truksa J., and Krijt J. (2017) Erythropoietin administration increases splenic erythroferrone protein content and liver TMPRSS6 protein content in rats. Blood Cells Mol. Dis. 64, 1–7 [DOI] [PubMed] [Google Scholar]
- 44. Gkouvatsos K., Fillebeen C., Daba A., Wagner J., Sebastiani G., and Pantopoulos K. (2014) Iron-dependent regulation of hepcidin in Hjv−/− mice: evidence that hemojuvelin is dispensable for sensing body iron levels. PLoS ONE 9, e85530. [DOI] [PMC free article] [PubMed] [Google Scholar]
- 45. Zhang A. S., Gao J., Koeberl D. D., and Enns C. A. (2010) The role of hepatocyte hemojuvelin in the regulation of bone morphogenic protein-6 and hepcidin expression in vivo. J. Biol. Chem. 285, 16416–16423 [DOI] [PMC free article] [PubMed] [Google Scholar]
- 46. Gutschow P., Schmidt P. J., Han H., Ostland V., Bartnikas T. B., Pettiglio M. A., Herrera C., Butler J. S., Nemeth E., Ganz T., Fleming M. D., and Westerman M. (2015) A competitive enzyme-linked immunosorbent assay specific for murine hepcidin-1: correlation with hepatic mRNA expression in established and novel models of dysregulated iron homeostasis. Haematologica 100, 167–177 [DOI] [PMC free article] [PubMed] [Google Scholar]
- 47. Lefebvre T., Dessendier N., Houamel D., Ialy-Radio N., Kannengiesser C., Manceau H., Beaumont C., Nicolas G., Gouya L., Puy H., and Karim Z. (2015) LC-MS/MS method for hepcidin-25 measurement in human and mouse serum: clinical and research implications in iron disorders. Clin. Chem. Lab. Med. 53, 1557–1567 [DOI] [PubMed] [Google Scholar]
- 48. Nai A., Rubio A., Campanella A., Gourbeyre O., Artuso I., Bordini J., Gineste A., Latour C., Besson-Fournier C., Lin H. Y., Coppin H., Roth M. P., Camaschella C., Silvestri L., and Meynard D. (2016) Limiting hepatic Bmp-Smad signaling by matriptase-2 is required for erythropoietin-mediated hepcidin suppression in mice. Blood 127, 2327–2336 [DOI] [PMC free article] [PubMed] [Google Scholar]
- 49. Johnson M. B., and Enns C. A. (2004) Diferric transferrin regulates transferrin receptor 2 protein stability. Blood 104, 4287–4293 [DOI] [PubMed] [Google Scholar]
- 50. Meynard D., Vaja V., Sun C. C., Corradini E., Chen S., López-Otín C., Grgurevic L., Hong C. C., Stirnberg M., Gütschow M., Vukicevic S., Babitt J. L., and Lin H. Y. (2011) Regulation of TMPRSS6 by BMP6 and iron in human cells and mice. Blood 118, 747–756 [DOI] [PMC free article] [PubMed] [Google Scholar]
- 51. Nai A., Pagani A., Silvestri L., and Camaschella C. (2010) Increased susceptibility to iron deficiency of Tmprss6-haploinsufficient mice. Blood 116, 851–852 [DOI] [PubMed] [Google Scholar]
- 52. Huang F. W., Pinkus J. L., Pinkus G. S., Fleming M. D., and Andrews N. C. (2005) A mouse model of juvenile hemochromatosis. J. Clin. Invest. 115, 2187–2191 [DOI] [PMC free article] [PubMed] [Google Scholar]
- 53. Niederkofler V., Salie R., and Arber S. (2005) Hemojuvelin is essential for dietary iron sensing, and its mutation leads to severe iron overload. J. Clin. Invest. 115, 2180–2186 [DOI] [PMC free article] [PubMed] [Google Scholar]
- 54. Maxson J. E., Enns C. A., and Zhang A. S. (2009) Processing of hemojuvelin requires retrograde trafficking to the Golgi in HepG2 cells. Blood 113, 1786–1793 [DOI] [PMC free article] [PubMed] [Google Scholar]
- 55. Enns C. A., Ahmed R., and Zhang A. S. (2012) Neogenin interacts with matriptase-2 to facilitate hemojuvelin cleavage. J. Biol. Chem. 287, 35104–35117 [DOI] [PMC free article] [PubMed] [Google Scholar]
- 56. Pagani A., Colucci S., Bocciardi R., Bertamino M., Dufour C., Ravazzolo R., Silvestri L., and Camaschella C. (2017) A new form of IRIDA due to combined heterozygous mutations of TMPRSS6 and ACVR1A encoding the BMP receptor ALK2. Blood 129, 3392–3395 [DOI] [PMC free article] [PubMed] [Google Scholar]
- 57. Finberg K. E., Whittlesey R. L., and Andrews N. C. (2011) Tmprss6 is a genetic modifier of the Hfe-hemochromatosis phenotype in mice. Blood 117, 4590–4599 [DOI] [PMC free article] [PubMed] [Google Scholar]
- 58. Kent P., Wilkinson N., Constante M., Fillebeen C., Gkouvatsos K., Wagner J., Buffler M., Becker C., Schümann K., Santos M. M., and Pantopoulos K. (2015) Hfe and Hjv exhibit overlapping functions for iron signaling to hepcidin. J. Mol. Med. 93, 489–498 [DOI] [PubMed] [Google Scholar]
- 59. Pagani A., Vieillevoye M., Nai A., Rausa M., Ladli M., Lacombe C., Mayeux P., Verdier F., Camaschella C., and Silvestri L. (2015) Regulation of cell surface transferrin receptor-2 by iron-dependent cleavage and release of a soluble form. Haematologica 100, 458–465 [DOI] [PMC free article] [PubMed] [Google Scholar]
- 60. Robb A., and Wessling-Resnick M. (2004) Regulation of transferrin receptor 2 protein levels by transferrin. Blood 104, 4294–4299 [DOI] [PubMed] [Google Scholar]
- 61. Johnson M. B., Chen J., Murchison N., Green F. A., and Enns C. A. (2007) Transferrin receptor 2: evidence for ligand-induced stabilization and redirection to a recycling pathway. Mol. Biol. Cell 18, 743–754 [DOI] [PMC free article] [PubMed] [Google Scholar]
- 62. Lenoir A., Deschemin J. C., Kautz L., Ramsay A. J., Roth M. P., Lopez-Otin C., Vaulont S., and Nicolas G. (2011) Iron-deficiency anemia from matriptase-2 inactivation is dependent on the presence of functional Bmp6. Blood 117, 647–650 [DOI] [PMC free article] [PubMed] [Google Scholar]
Associated Data
This section collects any data citations, data availability statements, or supplementary materials included in this article.