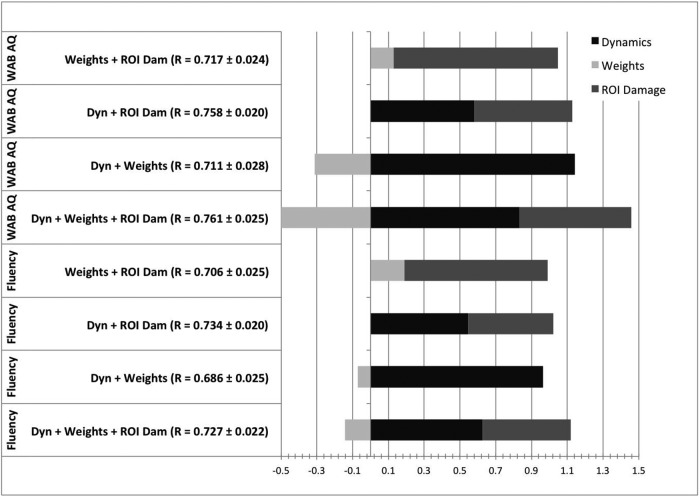
Figure 8.
This graph illustrates the OLS weights assigned to each measure when models using combined measures were constructed (x-axis). For each possible combination, the correlation coefficients obtained with out of sample testing (i.e., when applied to the test data) are listed and the OLS weights are stacked to demonstrate their relative values.

