

Abstract
As a result of improved relevance to in vivo physiology, in vitro studies are increasingly performed in diverse, three-dimensional (3D) biomaterials. However, material–cell type pairing effects on cytokine availability remain unclear. We cultured five cell types in agarose, alginate, collagen, Matrigel, or RGD-functionalized polyethylene glycol (PEG) hydrogels. We measured 21 cytokines in the conditioned media, and we identified differences in measured cytokine levels that were cell-type- or material-dependent. We further evaluated our data using principal component analysis. Interestingly, component one identified two classes of biomaterials with characteristic cytokine expression levels. Component two identified cell-type-dependent differences in cytokines related to the wound response. Although elements of soluble cytokine availability are shared despite parameter differences, material and cellular properties variably influenced cytokine levels, underlining the influence of biomaterial–cell type pairings on in vitro assay outcomes. Relationships between material properties, cellular responses, and cytokine availability in 3D in vitro models warrant further investigation.
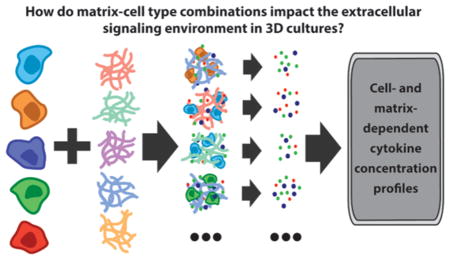
Graphical Abstract
INTRODUCTION
On account of more relevant cytokine expression,1 gene expression,2 drug-resistance characteristics,1,3 and recreation of in vivo cellular and tissue level architecture,4 it is widely accepted that three-dimensional (3D) cell culture microenvironments are more in vivo-like than traditional two-dimensional (2D) cell cultures.5,6 These findings have inspired a variety of 3D in vitro models and assays using different tissue and cell types and various matrix materials. In breast cancer research, various natural and synthetic biomaterials are being introduced to investigate the morphology,7,8 proliferation,9,10 and invasion11,12 of breast cancer cells.13 It is important to note that chemical, mechanical, and topographical properties of various ECM materials substantially influence the behavior and functions of cells.14,15 For example, it has been shown that soft matrices promote physiological prolactin actions and activation of STAT5. STAT5 activation in clinical breast cancers correlates with sensitivity to antiestrogen therapy and positive outcomes.16 However, stiff matrices promote pro-tumorigenic outcomes, including increased matrix metalloproteinase (MMP)-dependent invasion and collagen scaffold realignment. 17
Cytokines are important modulators of many morphogenesis- and cancer-related functions.18 The concentrations of a number of cytokines vary between cancerous and normal breast tissue.19 Furthermore, tissue concentrations of several of these cytokines have been correlated to cancer grade, immune infiltration, and vascularity.19 Because of their in vivo significance and their accessibility in many 3D culture formats, cytokine levels in 3D cultures represent attractive and potentially informative markers in screening, functional, and mechanistic applications.20 However, because cytokines are infrequently assayed in conjunction with changes in 3D matrix properties and cell types, the variability and role of cytokine concentrations in 3D models are poorly understood. There is existing evidence that points toward functionally significant differences in levels of endogenous cytokines (e.g., basic fibroblast growth factor: bFGF; vascular endothelial growth factor: VEGF; and interleukin-8: IL-8) in 3D cancer cultures for different matrix materials.1,21 We have demonstrated differences in cytokine levels in 2D versus 3D cultures of human mammary fibroblasts. These differences affected the function and morphology of cocultured breast cancer cells.22 However, common experiments in 3D frequently include treatment with exogenous growth factors4 or other cytokines,23 but typically do not capture the true soluble factor environment as endogenously sourced cytokines are not considered.
On the basis of the importance of matrix properties and cytokine levels in regulating cell function, we hypothesized that the variety of cell–matrix pairings used throughout the breast cancer literature in particular may influence functionally significant cytokine levels in 3D assays and models. We anticipated potential differences in cytokine secretion, diffusion of molecules through the matrices, and soluble factor interactions with the biomaterials’ chemistries. Additionally, the number of properties with potential to affect cell–matrix interactions presented an unrealistic parameter space. Therefore, we elected to establish effects of different 3D in vitro model designs on cytokine concentrations. Further, we chose to focus on characterizing the combined effect of common material–cell type pairings and culture conditions on the composite readout of soluble cytokine levels. To test our hypothesis, five biomaterials (agarose, alginate, collagen type I, Matrigel, and RGD-functionalized PEG) that are commonly used in 3D in vitro cultures were selected to culture breast epithelial cells (MCF10As, T47D, MDA-MB-231) and stromal cells (HMF, human mammary fibroblast, and NDF, normal dermal fibroblasts) in 3D. We then compared the resultant soluble cytokine level profiles.
MATERIALS AND METHODS
Cell Culture
The MCF10A normal breast epithelial cell line used in this work was purchased from the American Type Culture Collection (ATCC, Manassas, VA, U.S.A.) and maintained in culture with DMEM/F12 medium supplemented with horse serum (5%, Invitrogen, Carlsbad, CA, U.S.A.), epidermal growth factor (EGF, 20 ng/mL, Peprotech, Oak Park, CA, U.S.A.), hydrocortisone (0.5 mg/mL), cholera toxin (100 ng/mL), insulin (10 μg/mL), and penicillin/streptomycin (1%). Breast cancer cell line MDA-MB-231 and human normal dermal fibroblasts (NDF) were also purchased from ATCC and cultured with high-glucose DMEM (4.5 mg/mL), fetal bovine serum (FBS, 10%), and penicillin/streptomycin (1%). T47D breast carcinoma cells were cultured in RPMI 1640, supplemented with FBS (10%), bovine insulin (0.2 Units/mL), and penicillin/streptomycin (1%). Human mammary fibroblasts (HMFs) immortalized with human telomerase were provided by Dr. Charlotte Kuperwasser.24 HMF cells were cultured with high-glucose DMEM (4.5 mg/mL), calf serum (10%), and penicillin/streptomycin (1%). All cell lines were maintained in separate Petri dishes inside an incubator at 37 °C and 5% CO2 before mixing with biomaterials for 3D cell culture.
Collagen 3D Cell Culture
A collagen stock solution was prepared by mixing collagen (4.73 mg/mL, rat tail; BD Biosciences) with HEPES buffer (100 mM in 2X PBS) in a 1:1 ratio to neutralize the acidic collagen solution. Cells were trypsinized and resuspended in MEM. The neutralized collagen solution and serum-free media (SF-MEM) was added to cells such that the final collagen concentration was 1.3 mg/mL and the final cell density was 100 000 cells/mL. The resulting collagen/cell mixture was mixed by pipetting up/down the solution gently. Next, 40 μL of the collagen/cell mixture were added to wells in a 96-well plate (4000 cells/well), and samples were incubated at 37 °C for 30 min to complete collagen polymerization. After polymerization, 200 μL of MEM was added on top of the gels. Samples were kept inside an incubator at 37 °C and 5% CO2 for 4 days.
Matrigel 3D Cell Culture
Cells were detached from Petri dishes using 0.05% trypsin, resuspended in serum-free DMEM (SF-DMEM), and mixed with Matrigel (growth-factor reduced, BD Biosciences) in a 1:1 ratio such that the final cell density was 100 000 cells/mL and 50% Matrigel. Samples were mixed by pipetting up/down the solution gently. Subsequently, 40 μL of the cells/Matrigel mixture were added to wells of a 96-well plate and incubated at 37 °C for 30 min to complete polymerization. After polymerization, 200 μL of MEM was added on top of the gels. Samples were kept inside an incubator at 37 °C and 5% CO2 for 4 days.
3D Cell Culture in Poly(ethylene glycol) (PEG) Hydrogels
Thiol–ene photopolymerization was used to form PEG hydrogels25 by cross-linking 8-arm PEG-norbornene (PEG-NB) molecules (20 000 MW, 8ARM (TP)-NB-20K, JenKem, U.S.A.) with MMP-degradable peptides (KCGGPQGIWGQGCK, GenScript) and functionalized with RGD-peptide to promote cell adhesion (CRGDS, Genscript), such as that previously described.26 Cells were detached from Petri dishes using 0.05% trypsin, resuspended in PBS to 400 000 cells/mL, and mixed with Irgacure 2959 photoinitiator (0.2% in 1X PBS) in a 1:1 ratio. After mixing the cells with the photoinitiator, 100 μL of the cells/photoinitiator mixture were mixed with 100 μL of a 2× hydrogel monomer (in 1× PBS) to obtain a final cell concentration of 100 000 cells/mL in 40 mg/mL PEG-NB, 60% peptide cross-links (ratio of cross-linker thiols to norbornene arms), and 2 mM CRGDS. Then 40 μL of the final PEG/cell mixture was added to wells of a 96-well plate and polymerized under a UV lamp at ~5–10 mW cm−2 for 2 min (plates were placed on the top shelf of the exposure stand for a UVP XX-15L lamp, Fisher). After polymerization, 200 μL of MEM were added on top of the gels. Samples were kept inside an incubator at 37 °C and 5% CO2 for 4 days.
Alginate 3D Cell Culture
An aqueous solution of alginate (2% w/v) was prepared by mixing the polymer in sterile SF-MEM. The solution was stirred overnight with a magnetic stirrer at room temperature. A 100 mM CaCl2 solution was prepared in deionized water and sterilized by filtration. Next, 250 μL of the 100 mM CaCl2 solution was added to wells in a 12-well plate. Cells were trypsinized and resuspended in MEM, and they were mixed with the alginate solution in a 1:1 ratio to get a final alginate concentration of 1% w/v and 100 000 cells/mL. Inserts were placed on top of the wells containing the CaCl2 solution, and 40 μL of the cells/alginate solution was added to the well inserts to allow alginate gels to polymerize through contact with the 40 μL of the CaCl2 solution at the bottom. After 30 min, the CaCl2 solution was aspirated out of the wells, and 200 μL of MEM was added on top of the gels. Samples were kept inside an incubator at 37 °C and 5% CO2 for 4 days.
Agarose 3D Cell Culture
Ultralow gelling temperature agarose (0.1 g, Sigma-Aldrich) was mixed with 5 mL of phosphate buffer saline (PBS, 1×) solution. The solution was then placed in a microwave for 10 s to heat up the solution and dissolve the agarose completely. While the agarose solution was cooled to room temperature (RT), cells were trypsinized and resuspended in MEM. After the agarose gel was cooled to RT, cells and agarose were mixed in a 1:1 ratio to get a final agarose concentration of 1% agarose and 100 000 cells/mL. Subsequently, 40 μL of the cells/agarose mixture was added to wells of a 96-well plate and incubated over ice for 10 min to complete gelling. Then 200 μL of MEM was added on top of the gels after agarose gelled. Samples were kept inside an incubator at 37 °C and 5% CO2 for 4 days.
Cytokine Screening
The levels of cytokines secreted by T47D, MCF10A, MDA-MB-231, HMF, and NDF cells were analyzed in the culture supernatants using Luminex Technology and the human Cytokine/chemokine Magnetic Bead panel kit (no. HCYTOMAG- 60K, EMD Millipore Corp, MA) following the manufacturer’s protocol. Cells were cultured in 96-well plates for 4 days, and the media (MEM for all cultures) was collected for analysis. Cytokine/chemokine levels were quantified using the Coomassie (Bradford) Protein Assay Kit (Thermo Scientific) for normalized loading 50 μg of total protein in each bead-based ELISA sample.
Principal Component Analysis
Principal component analysis (PCA) was used to aid in the interpretation of the data set generated in this study. The original data matrix included each cell type–biomaterial combination (25 observations) and the corresponding cytokine level measures (21 variables). We used the first two components (cumulative explained variation >75%) to interrogate the data set for multivariate relationships. Computation was performed in SIMCA-P+ 12.0.1 and MatLab R2013a 8.1.0.604. All experiments were done on three separate independent samples. Data points in figures represent the average values.
RESULTS
Cytokine Secretion in 3D Culture Combinations
We investigated the influence of five biomaterials (Table 1) on the protein secretion patterns of normal mammary, breast cancer, and stromal cells in 3D cultures. A panel of five cell lines was selected to represent highly invasive breast cancer (MDA-MB-231), normal mammary epithelium (MCF10A), noninvasive carcinoma (T47D), fibrocystic stroma (HMF), and normal stroma (NDF). All cells were cultured in 96-well plates for 4 days using the “3D embedded” culture protocol described in the Methods section.7 After culture, conditioned media were collected, and protein quantification was performed to analyze the extracellular levels of 21 human cytokines that have demonstrated important roles in breast cancer progression. Table 2 summarizes the main functions of each of the cytokines investigated in this study. The cytokine levels in each conditioned medium were analyzed using Luminex technology (see Materials and Methods; multiplexed bead-based ELISA). Three independent medium samples were collected and analyzed for each cell line. The heat map shown in Figure 1 displays amounts of cytokines measured for each condition. Color values were represented on a log scale between zero (dark green) and the maximum detected concentration (yellow). For many cytokines, PEG and alginate gels resulted in the highest levels of soluble protein compared to the other biomaterials tested (e.g., TNFα, IL-2, IL-5) while others were more variably detected across materials and cell lines (e.g., IL-8, MCP-1, G-CSF).
Table 1.
Commonly Used Biomaterials in Breast Cancer Research
| Biomaterial | Type | Composition | Polymerization | Characteristics | ref |
|---|---|---|---|---|---|
| agarose | natural | β-D-galactopyranosyl and 3,6-anhydro-L-galactopyranosyl units | dissolved in near-boiling water then cooled | nonadhesive for cells | 27–29 |
| polysaccharides derived from marine algae | |||||
| concentration-dependent solute diffusion and mechanics | |||||
| alginate | natural | 1,4′-linked β-D-mannuronic acid (M) and α-L-guluronic acid (G) residues | divalent cations, such as Ca2+, Sr2+, or Ba2+, cause ionic cross-linking | nonadhesive for cells | 27,30 |
| anionic polysaccharides derived from marine algae | |||||
| G and M block ratio- and concentration-dependent mechanics | |||||
| collagen type I | natural | procollagen triple helices assembled into fibrils and fibers | temperature increase | major fibrillary component in mammary gland | 31 |
| provides structural integrity | |||||
| concentration- and cross-linking-dependent mechanics | |||||
| serves as biochemical ligand | |||||
| Matrigel | natural | various basement membrane proteins, primarily laminin, collagen IV, and enactin, and growth factors | temperature increase | batch-to-batch variation in mechanics and composition | 32 |
| derived from mouse sarcoma cells | |||||
| PEG | Synthetic | ethyl glycol monomers | acrylic or methacrylic group coupling to PEG chain hydroxel ends | can be functionalized to include binding motifs, degradable moieties, and other bioactive molecules | 26,33 |
| Michael-type addition reactions | |||||
| thiol–ene reactions | tunable chemistry and mechanics | ||||
| enzymatic cross-linking reactions |
Table 2.
Panel of Human Cytokines and Their Functions in Breast Cancer
| abbrev. | Cytokine | Function | ref |
|---|---|---|---|
| EGF | epidermal growth factor | promotes growth, survival | 34 |
| FGF-2 | basic fibroblast growth factor | promotes survival and apoptosis | 35 |
| G-CSF | granulocyte colony-stimulating factor | stimulates angiogenesis, promotes neutrophil maturation | 36 |
| GM-CSF | granulocyte macrophage colony-stimulating factor | inhibits tumor growth and metastasis, stimulates immune response | 37 |
| IFN-γ | interferon gamma | inhibits growth | 38 |
| MCP-1 | monocyte chemotactic protein 1 | increases macrophage recruitment, stimulates migration | 39 |
| PDGF-AA | platelet-derived growth factor | AA stimulates angiogenesis | 40 |
| PDGF-BB | platelet-derived growth factor | BB stimulates angiogenesis | 41 |
| TNF-α | tumor necrosis factor | alpha stimulates apoptosis, proliferation | 42 |
| TNF-β | tumor necrosis factor beta | activation of dormant tumor cells | 43 |
| VEGF | vascular endothelial growth factor | modulates angiogenesis | 44 |
| IL-1β | interleukin-1 beta | pro-inflammatory | 45 |
| IL-2 | interleukin-2 | promotes growth and differentiation of T and B cells | 46 |
| IL-4 | interleukin-4 | Induces apoptosis, inhibits tumor growth, simulates normal cell growth | 47 |
| IL-5 | interleukin-5 | no correlation identified | 48 |
| IL-6 | interleukin-6 | pro-inflammatory, controls proliferation | 49 |
| IL-8 | interleukin-8 | pro-inflammatory, increases invasiveness and metastatic potential | 50 |
| IL-10 | interleukin-10 | anti-inflammatory, control tumor proliferation | 51 |
| IL-12p40 | interleukin-12p40 subunit | induces IF N-γ production, IL-12p70 antagonist | 52 |
| IL-12p70 | interleukin-12p70 | subunit regulates T cell survival | 53 |
| IL-13 | interleukin-13 | suppresses macrophage cytotoxic activity | 54 |
Figure 1.

Cytokine screening in 3D cultures. The protein levels of a panel of 21 cytokines were quantified for five cell lines (MDA, MB-231, MCF10A, T47D, HMF, NDF) cultured in five different biomaterials (collagen, Matrigel, PEG, alginate, agarose). Measured cytokine levels were mapped on a log color scale across cytokines and culture combinations ranging from yellow (highest protein levels) to dark green (undetectable protein levels). Each color represents an average of three independent conditions.
Principal Component Analysis Implementation
In studies generating complex data sets, such as the screen of culture conditions described here, important aspects of data can be detected using principal component analysis (PCA).55,56 PCA is a dimension reduction transformation of a data set, which identifies linearly uncorrelated composite variables in the original variable space. These composite variables are termed principal components and are selected such that they maximally capture variability and display covariance in the data set.55,57 With these composite variable axes the data can be depicted in a lower dimension representation that simplifies analysis while maximally maintaining variation from the original data. Principal components often cluster correlating conditions and variables and highlight the strongest contributing factors to variation in the data.
PCA was implemented to investigate relationships between material–cell type combinations in scores, between cytokines in loadings, and between cytokines and culture combinations in biplot representations. In PCA, a loading is the relative contribution of a variable (cytokine) to the linear combination of variables represented by a principal component. A score represents the measured cytokine levels for a given cell type–biomaterial combination multiplied by the linear combination of contributions (loading) for the cytokines in the principal component in question summed over all cytokines. The principal components are computed in such a way that they are orthogonal (uncorrelated) axes in variable space that capture maximal levels of variation in the data. Hence, the scores plot in Figure 2 is effectively a “shadow” of the swarm of cell line–biomaterial data points in 21-dimensional cytokine space projected onto the most informative plane (i.e., that plane to which the points lie nearest and that thereby results in minimal loss of variation in the data). We have included 95% confidence ellipses for each material, which demonstrate two classes of biomaterials with no overlap across classes but a high degree of overlap within classes.
Figure 2.

Principal components 1 and 2 scores plot. Scores were computed for PCA of the full data set and plotted for components one and two. Observations were color-coded by biomaterial for all five cell types: red = agarose, purple = alginate, green = collagen, blue = Matrigel, orange = PEG. 95% confidence intervals were computed in Matlab for each material and plotted using the same color-coding as above. The Hotelling’s 95% confidence interval for outlier detection was plotted in black.
To quantify goodness of fit and predictive ability of the principal components the cumulative explained variation, (R2X)cum, and predicted variation, (Q2)cum, were computed in SIMCA-P+ using previously described methods.57 A characteristic feature in PCA of biological data (and other noise containing data) is the divergence in explained and predicted variation beyond a certain PC. Explained variation or the incorporation of the variation from the original dataspace into the condensed dataspace will continue to increase until enough PCs have been included to explain all of the variation (a number of PCs less than or equal to the original number of measured variables), whereas the predictive capability will reach a maximum and then decline due to overfitting of the data.55,57 Figure 3A demonstrates that there are minor increases in the cumulative explained variation for each additional component beyond component two (i.e., the increase in the cumulative explained variation from component 2 to component 3 is <0.1). Meanwhile, the predictive capability of the analysis begins to decrease after component two, reflecting a negative predictive effect for components beyond component two. Therefore, we chose to use the first two components, with (R2X)cum = 0.75 and (Q2)cum = 0.61, for analysis and interpretation of the data. The explained variation and predicted variation were further broken down to evaluate the degree to which variation in individual variables (cytokines) was captured in the first two components, (R2VX)cum, and how well predicted the cytokines measures were by the analysis, (Q2VX)cum. Figure 3B demonstrates that the majority of cytokines were both well explained and well predicted, whereas EGF, PDGF-AA, MCP-1, GM-CSF, and VEGF were not well explained or well predicted in the first two components. Therefore, variation in these five cytokines contributed little to the analysis.
Figure 3.

Explained and predicted variation. Explained and predicted variation for the model (A) and by variable (B) were computed in SIMCA-P+. (A) The explained variation (R2X(cum)) increased <0.1 per additional component after component two and predicted variation (Q2(cum)) for the model decreased after component two. (B) The explained variation (R2VX[2](cum)) and predicted variation (Q2VX[2](cum)) show good fit and prediction for most variables with the first two components.
Outlier Detection
Strong outliers among observations (cell type–biomaterial conditions) are capable of shifting principal components toward themselves. The scores for these conditions are identified using the Hotelling’s T2 ellipse of 95% confidence for the data set.57 However, it was probable that with 25 conditions one of them would fall outside of the 95% confidence ellipse without being fundamentally different than the other conditions. To investigate whether the cytokine pattern measured for NDFs cultured in agarose, the score for which was outside of the Hotelling’s T2 ellipse (Figure 2), represented a characteristically unique case or an extreme case from the same population, we used all conditions but NDFs cultured in agarose to generate a new principal component space (Supplemental Figures S1, S2). Omission of this observation had very little effect on the scores, loadings, or goodness of fit of the analysis compared to the full data set. On the basis of the fidelity of the model with and without this condition, we concluded that NDFs in agarose had a high score in component two, but it did not skew the analysis.
We also looked for moderate outliers that rather than shifting principal components toward themselves fall far from the plane (or hyperplane) defined by the principal component space. As such, moderate outliers are not well explained in the analysis and have a high distance from the model, or DModX, which was calculated in SIMCA-P+ as previously described.57 Of the 25 cell line-biomaterial combinations, only HMFs in PEG fell above the threshold for moderate outlier detection (D-Crit(0.05)) in both component one and component two (Supplemental Figure S3). Thus, while PCA analysis captured a good deal of variation in most observations, HMFs in PEG were not well explained in the first two principal components.
Scores and Loadings Analysis
Further analysis of correlations in the cytokine levels and culture conditions was facilitated by scores and loadings bar plots for the first two components (Figure 4). Scores for all cell types in agarose, collagen, and Matrigel were positive, whereas the scores for all cell types in alginate and PEG were negative in principal component one (Figure 4A). For PCA analysis, sign convention is somewhat arbitrary but is consistent for all scores and loadings in a given principal component. Therefore, the significance of the signs of the scores in the first component is that it enables separation of the materials across the origin into two groups. Negative loadings in component one correlating with the scores for alginate and PEG were widespread, as they included 13 of the 21 cytokines (Figure 4B). For component two, the only positive projections were for NDFs in agarose, alginate, collagen, and Matrigel and HMFs in PEG (Figure 4C). There were five cytokines whose loading correlated with the positively projecting culture conditions. These cytokines were FGF-2, G-CSF, GM-CSF, IL-6, and IL-8. Importantly GM-CSF and IL-8 were not well predicted by the model and may have been subject to overfitting (Figure 3B). The remaining cytokines did not contribute significantly to component two.
Figure 4.

PCA scores and loadings graphs. Using SIMCA-P+ we computed scores and loadings for component one (A and B, respectively) and component two (C and D, respectively) for the entire data set. Loadings are color-coded by material: red = agarose, purple = alginate, green = collagen, blue = Matrigel, orange = PEG. Error bars represent jack-knifing uncertainty bars with 95% confidence. Component one separates the loadings for agarose and PEG from those of the other three materials (A) and is defined by strong loadings for many cytokines (B). Component two separates NDFs in the first four materials and HMFs in PEG from the other conditions (C) and is characterized by strong loadings in five wound/inflammation response-related cytokines (D).
DISCUSSION
Inspection of our data reveals that some cytokines were detected in what appeared to be a cell-type-specific manner, whereas others showed elevated or low levels specific to a given material. Media from all MCF10A cultures showed relatively high levels of EGF despite the lack of exogenously supplied EGF, which is typically supplemented in the cell type’s growth media at comparable concentrations58 (up to 10 ng/mL in our cultures versus 20 ng/mL in growth media, Figure 1). Interestingly, the highest levels of EGF were measured in the supernatant of MCF10A-agarose cultures, whereas the same 3D culture condition yielded minimal detection of the other assayed cytokines. As a culture matrix, agarose does not support colony formation for nontransformed MCF10A while transformed MCF10As can form colonies in “soft agar” assays. This phenomenon has enabled assessment of the transforming potential of treatments.59–61 Our data suggests that in agarose endogenously sourced EGF could significantly affect the sensitivity of the colony forming assay for different modes of MCF10A transformation62 and tested treatments.61
Because our measurements were of cytokines in the supernatant, there are several factors that may have contributed to the development of relatively cytokine-rich or -poor extracellular environments. There were likely differences in cytokine production across culture combinations, variations in matrix sequestration (e.g., agarose, alginate, and PEG supporting minimal adsorption of proteins compaired to Matrigel and collagen), and differences in degradation of certain factors across conditions. Thus, the elevated levels of EGF in MCF10A-agarose compared to other 3D cultures likely resulted from differences in production and degradation based on cell–matrix interactions as well as minimal adsorption to the matrix. Despite the range of physical, chemical, and biological characteristics of the matrices and the differences in cell types, our cytokine measurements that could be compared to in vivo concentration data fell within the range measured for clinical samples or were of the same order of magnitude as cytokine concentrations in the in vivo tissues as reported in the literature (Figure 1).19
As opposed to the MCF10A-specific EGF levels, VEGF and PDGF-AA were detected in highest concentrations in cultures of all cell types in Matrigel. These maxima varied in their absolute concentrations but point toward the potential for material inherent aspects of 3D culture environments. In addition to differences in production, degradation, and sequestration compared to the other biomaterials, Matrigel contains growth factors and may have also contributed to the measured levels factors such as VEGF and PDGF-AA.32,63 For this reason, we elected to use growth-factor-reduced Matrigel, which does not have reported levels of VEGF and has lower levels of PDGF than we detected. Thus, cell-sourced PDGF-AA and VEGF likely contributed to supernatant levels of the growth factors in a material-specific manner. This potential material-driven effect may be a contributing factor to Matrigel invasion assay results. For example, signaling through VEGF is an essential element of MDA-MB-231 invasion in Matrigel.64 These matrix-dependent characteristics of cytokine levels in 3D cultures demonstrate that behaviors in a given 3D in vitro model should be attributed to the cell type and its environment. As such, a comparison of invasion in Matrigel should be considered as a specific assay readout and not an indication of overall invasive capacity for different cell types owing to Matrigel’s unique effect on the extracellular soluble factor environment. Our data suggests that results from 3D models should be considered as unique to the cell–matrix pairing where cell parameters (such as density and passage number/primary source) as well as material properties (which may include cell binding motif density, stiffness, concentration, and integrin-binding ligand identities) affect the in vitro environment with the potential to impact resultant readouts.
We have described observations based on manual inspection of our data. However, our screen of biomaterial and cell type combinations and the influence of these various 3D culture conditions on soluble extracellular cytokine levels resulted in a large data set represented in Figure 1. Variability in relative cytokine levels that depended on both biomaterial and cell type suggested complex and multifaceted interactions that were difficult to parse by inspection. We therefore chose to use the multivariate data analysis technique, PCA, to look for correlations in the data. This analysis was characterized by good fit and prediction coefficients for the first two principal components and for the majority of variables (Figure 3). For the culture conditions, there were no strong outliers that adversely influenced the analysis and only one condition, HMFs in PEG, was a moderate outlier in both principal components, further indicating a robust model (Supplemental Figures S2, S3). We are therefore confident that the PCA identified strong correlations and was not subject to widespread overfitting.
The PCA score plot in Figure 2 indicates that PEG and alginate have characteristically different soluble cytokine level patterns as compared to collagen, Matrigel, and agarose. It is possible that these patterns are due to differences in production by the cells in 3D culture, difference in stability/degradation, differences in sequestration by the matrix, or a combination of these factors. This separation in principal component one (the linear combination of variables that explains maximal variation in the data) suggests that the strongest influence on relative soluble cytokine levels is the biomaterial. Interestingly, agarose and alginate did not cluster together, although they lack moieties recognized by integrins and therefore support spheroid but not matrix adherent culture;65,66 however, the other three materials contain peptide sequences that support cell–matrix interactions.26,32,67 This observation indicates that properties beyond direct cell–matrix interactions for the conditions tested contributed to the measured differences in cytokine levels. For example, the matrix conditions investigated here are known to result in different elastic moduli from material to material. Approximations based on similar biomaterial formulations in the literature give the following elastic moduli: 1% w/w agarose ~40 kPa,68 2% w/v alginate ~4 kPa,30 1.3 mg/mL collagen ~0.73–2.18 kPa,69 Matrigel ~0.5 kPa,70 4% w/w and 1:1 ratio cross-linker thiols to norbornene arms PEG ~0.1–6 kPa.26 Within the two classes of biomaterials (class 1: PEG and alginate; class 2: agarose, collagen, and Matrigel) stiffnesses vary widely. It is likely that the overall effect on cytokine availability in the conditioned media is dependent on a number of parameters including direct cell–matrix interactions, matrix mechanics, and matrix–cytokine interactions.
Correlation between scores and loadings in principal component space can be informative when interpreting PCA figures. Figure 4A,B display the scores and loadings respectively for principal component one with standard errors computed from all rounds of Jack-knife cross validation.57 As noted based on the scores plots in Figures 2 and 4, component one separates the positively projecting materials, agarose, collagen, and Matrigel, from the negatively projecting alginate and PEG for all cell types. Most loadings are negative, correlating with the projections of alginate and PEG conditions. These variables or cytokines represent a set of proteins with diverse functions. Though no particular function or pathway seems to be most influential in component one, inspection of the original data suggests that the defining characteristic of these cytokines is that they were measured in relatively high concentrations for alginate and PEG and were lowly detected or were undetected for the other three materials. Therefore, principal component one could be termed the “alginate/PEG” component and identifies biomaterial dependent differences in a large number of cytokines as the strongest feature in the data set in terms of variation.
Similar inspection of component two scores and loadings (Figure 4C,D, respectively) reveals cell-type-dependent variation as the second strongest source of variation in the data. With PEG as the exception, each material showed stronger relative levels of five cytokines in NDFs than the other cell types (Figure 4C,D). In PEG, it was HMFs that most strongly projected in component two. These five cytokines included FGF-2, involved in the wound response/angiogenesis71 G-CSF, involved in neutrophil production; GM-CSF, contributes to granulocyte and monocyte production;72 IL-6, with anti- and proinflammatory functions;73 and IL-8, a neutrophil chemoattractant. 74 All five are involved with the wound response and inflammation. Though it is important to note that with low prediction coefficients, the contributions of GM-CSF and IL-8 require further inspection. The second component could then be termed the “wound response” component. This component suggests that the elevated levels of cytokines involved the wound response that are characteristic of the extracellular environment in dermal, and fibrotic mammary fibroblast cultures comprise the second most prominent feature in the data. Future studies comparing the cytokine levels in 3D culture matrices for cell types from other tissues should aid in determining which soluble signaling factors in the microenvironment are cell- or matrix-intrinsic or modulated by both.
CONCLUSIONS
In summary, the use of three-dimensional cell cultures has increased in the past decade, and its use will continue to expand as more in vivo-like systems are being developed. Several natural and synthetic biomaterials have been utilized to provide cells with 3D microenvironments where cells can interact with each other and with the ECM. Although these biomaterials have been shown to be useful for increasing the biological relevance of cell cultures, biomaterials are often selected without thorough consideration of their influence on cellular behavior. Our data indicates that cell type and material selection can significantly influence signaling and mechanistic studies that depend on the concentration of cytokines available to the cells in culture.
In this work, it was hypothesized that soluble extracellular cytokine levels would vary according to the biomaterial and cell type selected for 3D culture. Indeed, the data presented suggests that biomaterials influence the soluble protein levels available in 3D cultures of normal epithelial, breast cancer, and stromal cells (Figures 1, 2, and 4). Interestingly, PEG and alginate gels resulted in the highest amount of many proteins measured in conditioned media regardless of cell type. PCA confirmed that the relatively high levels of many of the cytokines assayed in PEG and alginate versus agarose, collagen, and Matrigel was the most prominent feature in the data set in terms of variation. It is a key finding that despite inherent differences in the known properties of these materials, such as cell–matrix interactions and mechanical properties, they gave rise to two discrete classes of responses across cell lines.
Differences in protein levels could significantly affect the results in 3D cocultures where paracrine signals and mechanistic strategies are investigated. Scores and loadings in principal component two indicated that there also exist significant differences in cytokine levels dependent on cell type. Interestingly, cytokines that varied based on cell type in component two were all involved in the wound or inflammation response, suggesting that the pairing of biomaterials and cell types can influence functional responses and readouts significantly. Overall, our data suggests that future work aimed at dissecting material property and cell state influences that modulate extracellular cytokine levels should enhance our understanding of key aspects of 3D microenvironment regulation and modulation.
Supplementary Material
Acknowledgments
This work was supported by the US Food and Drug Administration intramural research fund from the Division of Cellular and Gene Therapies. This work was supported by the National Institutes of Health NIH T32 GM008349 and NIH grant RO1 HL093282, University of Wisconsin Carbone Cancer Center Cancer Center Support Grant P30 CA014520, Environmental Protection Agency 83573701-Human Models for Analysis of Pathways (H-MAPs) Center.
Footnotes
Supporting Information
The Supporting Information is available free of charge on the ACS Publications website at DOI: 10.1021/acs.biomac. 6b01469.
Supplemental principal component analysis figures (PDF)
Notes
The authors declare the following competing financial interest(s): D.J.B. holds equity in Bellbrook Labs LLC, Tasso Inc., Stacks to the Future LLC, Lynx Biosciences LLC, Onexio Biosystems LLC and Salus Discovery LLC. W.L.M. is a founder and stockholder for Stem Pharm, Inc., and Tissue Regeneration Systems, Inc.
References
- 1.Fischbach C, Chen R, Matsumoto T, Schmelzle T, Brugge JS, Polverini PJ, Mooney DJ. Nat Methods. 2007;4(10):855–860. doi: 10.1038/nmeth1085. [DOI] [PubMed] [Google Scholar]
- 2.Zietarska M, Maugard CM, Filali-Mouhim A, Alam-Fahmy M, Tonin PN, Provencher DM, Mes-Masson A. Mol Carcinog. 2007;46(10):872–885. doi: 10.1002/mc.20315. [DOI] [PubMed] [Google Scholar]
- 3.Shield K, Ackland ML, Ahmed N, Rice GE. Gynecol Oncol. 2009;113(1):143–148. doi: 10.1016/j.ygyno.2008.11.032. [DOI] [PubMed] [Google Scholar]
- 4.Ewald AJ, Brenot A, Duong M, Chan BS, Werb Z. Dev Cell. 2008;14(4):570–581. doi: 10.1016/j.devcel.2008.03.003. [DOI] [PMC free article] [PubMed] [Google Scholar]
- 5.Baker BM, Chen CS. J Cell Sci. 2012;125:3015–3024. doi: 10.1242/jcs.079509. [DOI] [PMC free article] [PubMed] [Google Scholar]
- 6.Lee J, Cuddihy MJ, Kotov NA. Tissue Eng, Part B. 2008;14(1):61–86. doi: 10.1089/teb.2007.0150. [DOI] [PubMed] [Google Scholar]
- 7.Lee GY, Kenny PA, Lee EH, Bissell MJ. Nat Methods. 2007;4(4):359–365. doi: 10.1038/nmeth1015. [DOI] [PMC free article] [PubMed] [Google Scholar]
- 8.Kenny PA, Lee GY, Myers CA, Neve RM, Semeiks JR, Spellman PT, Lorenz K, Lee EH, Barcellos-hoff MH, Petersen OW, Gray JW, Bissell MJ. Mol Oncol. 2007;1:84–96. doi: 10.1016/j.molonc.2007.02.004. [DOI] [PMC free article] [PubMed] [Google Scholar]
- 9.Weigelt B, Lo AT, Park CC, Gray JW, Bissell MJ. Breast Cancer Res Treat. 2010;122:35–43. doi: 10.1007/s10549-009-0502-2. [DOI] [PMC free article] [PubMed] [Google Scholar]
- 10.Lazennec G, Bresson D, Lucas A, Chauveau C, Vignon F. Endocrinology. 2001;142(9):4120–4130. doi: 10.1210/endo.142.9.8395. [DOI] [PMC free article] [PubMed] [Google Scholar]
- 11.Deakin NO, Turner CE. Mol Biol Cell. 2011;22:327–341. doi: 10.1091/mbc.e10-09-0790. [DOI] [PMC free article] [PubMed] [Google Scholar]
- 12.Furlan A, Vercamer C, Desbiens X, Pourtier A. J Cell Physiol. 2008;215:782–793. doi: 10.1002/jcp.21360. [DOI] [PubMed] [Google Scholar]
- 13.Rijal G, Li W. Biomaterials. 2016;81:135–156. doi: 10.1016/j.biomaterials.2015.12.016. [DOI] [PubMed] [Google Scholar]
- 14.Brandl F, Sommer F, Goepferich A. Biomaterials. 2007;28(2):134–146. doi: 10.1016/j.biomaterials.2006.09.017. [DOI] [PubMed] [Google Scholar]
- 15.Drury JL, Mooney DJ. Biomaterials. 2003;24(24):4337–4351. doi: 10.1016/s0142-9612(03)00340-5. [DOI] [PubMed] [Google Scholar]
- 16.Yamashita H, Nishio M, Ando Y, Zhang Z, Hamaguchi M, Mita K, Kobayashi S, Fujii Y, Iwase H. Endocr-Relat Cancer. 2006;13(3):885–893. doi: 10.1677/erc.1.01095. [DOI] [PubMed] [Google Scholar]
- 17.Barcus CE, Keely PJ, Eliceiri KW, Schuler LA. J Biol Chem. 2013;288(18):12722–12732. doi: 10.1074/jbc.M112.447631. [DOI] [PMC free article] [PubMed] [Google Scholar]
- 18.Wilson J, Balkwill F. Semin Cancer Biol. 2002;12:113–120. doi: 10.1006/scbi.2001.0419. [DOI] [PubMed] [Google Scholar]
- 19.Chavey C, Bibeau F, Gourgou-Bourgade S, Burlinchon S, Boissière F, Laune D, Roques S, Lazennec G. Breast Cancer Res. 2007;9(1):R15. doi: 10.1186/bcr1648. [DOI] [PMC free article] [PubMed] [Google Scholar]
- 20.Asthana A, Kisaalita WS. Drug Discovery Today. 2016;21(6):950–961. doi: 10.1016/j.drudis.2016.03.009. [DOI] [PubMed] [Google Scholar]
- 21.Fischbach C, Kong HJ, Hsiong SX, Evangelista MB, Yuen W, Mooney DJ. Proc Natl Acad Sci U S A. 2009;106(2):399–404. doi: 10.1073/pnas.0808932106. [DOI] [PMC free article] [PubMed] [Google Scholar]
- 22.Sung KE, Su X, Berthier E, Pehlke C, Friedl A, Beebe DJ. PLoS One. 2013;8(10):e76373. doi: 10.1371/journal.pone.0076373. [DOI] [PMC free article] [PubMed] [Google Scholar]
- 23.Sullivan NJ, Sasser AK, Axel A, Vesuna F, Raman V, Ramirez N, Oberyszyn TM, Hall BM. Oncogene. 2009;28(33):2940–2947. doi: 10.1038/onc.2009.180. [DOI] [PMC free article] [PubMed] [Google Scholar]
- 24.Kuperwasser C, Chavarria T, Wu M, Magrane G, Gray JW, Carey L, Richardson A, Weinberg RA. Proc Natl Acad Sci U S A. 2004;101(14):4966–4971. doi: 10.1073/pnas.0401064101. [DOI] [PMC free article] [PubMed] [Google Scholar]
- 25.Fairbanks BD, Schwartz MP, Halevi AE, Nuttelman CR, Bowman CN, Anseth KS. Adv Mater. 2009;21:5005–5010. doi: 10.1002/adma.200901808. [DOI] [PMC free article] [PubMed] [Google Scholar]
- 26.Hansen TD, Koepsel JT, Le NN, Nguyen EH, Zorn S, Parlato M, Loveland SG, Schwartz MP, Murphy WL. Biomater Sci. 2014;2:745–756. doi: 10.1039/C3BM60278H. [DOI] [PMC free article] [PubMed] [Google Scholar]
- 27.de Vos P, Lazarjani HA, Poncelet D, Faas MM. Adv Drug Delivery Rev. 2014;67:15–34. doi: 10.1016/j.addr.2013.11.005. [DOI] [PubMed] [Google Scholar]
- 28.Liu J, Hilderink J, Groothuis TAM, Otto C, van Blitterswijk CA, de Boer J. J Tissue Eng Regener Med. 2015;9(8):952–960. doi: 10.1002/term.1654. [DOI] [PubMed] [Google Scholar]
- 29.Chen J, Irianto J, Inamdar S, Pravincumar P, Lee DA, Bader DL, Knight MM. Biophys J. 2012;103(6):1188–1197. doi: 10.1016/j.bpj.2012.07.054. [DOI] [PMC free article] [PubMed] [Google Scholar]
- 30.LeRoux MA, Guilak F, Setton LA. J Biomed Mater Res. 1999;47(1):46–53. doi: 10.1002/(sici)1097-4636(199910)47:1<46::aid-jbm6>3.0.co;2-n. [DOI] [PubMed] [Google Scholar]
- 31.Schedin P, Keely PJ. Cold Spring Harbor Perspect Biol. 2011;3(1):a003228. doi: 10.1101/cshperspect.a003228. [DOI] [PMC free article] [PubMed] [Google Scholar]
- 32.Kleinman HK, Martin GR. Semin Cancer Biol. 2005;15:378–386. doi: 10.1016/j.semcancer.2005.05.004. [DOI] [PubMed] [Google Scholar]
- 33.Kloxin AM, Kloxin CJ, Bowman CN, Anseth KS. Adv Mater. 2010;22(31):3484–3494. doi: 10.1002/adma.200904179. [DOI] [PMC free article] [PubMed] [Google Scholar]
- 34.Masuda H, Zhang D, Bartholomeusz C, Doihara H, Hortobagyi GN, Ueno NT. Breast Cancer Res Treat. 2012;136(2):331–345. doi: 10.1007/s10549-012-2289-9. [DOI] [PMC free article] [PubMed] [Google Scholar]
- 35.Yiangou C, Gomm JJ, Coope RC, Law M, Luqmani YA, Shousha S, Coombes RC, Johnston CL. Br J Cancer. 1997;75(1):28. doi: 10.1038/bjc.1997.5. [DOI] [PMC free article] [PubMed] [Google Scholar]
- 36.Voloshin T, Gingis-Velitski S, Bril R, Benayoun L, Munster M, Milsom C, Man S, Kerbel RS, Shaked Y. Blood. 2011;118(12):3426–3435. doi: 10.1182/blood-2010-11-320812. [DOI] [PMC free article] [PubMed] [Google Scholar]
- 37.Eubank TD, Roberts RD, Khan M, Curry JM, Nuovo GJ, Kuppusamy P, Marsh CB. Cancer Res. 2009;69(5):2133–2140. doi: 10.1158/0008-5472.CAN-08-1405. [DOI] [PMC free article] [PubMed] [Google Scholar]
- 38.García-Tuñón I, Ricote M, Ruiz A, Fraile B, Paniagua R, Royuela M. BMC Cancer. 2007;7(1):1. doi: 10.1186/1471-2407-7-158. [DOI] [PMC free article] [PubMed] [Google Scholar]
- 39.Fujimoto H, Sangai T, Ishii G, Ikehara A, Nagashima T, Miyazaki M, Ochiai A. Int J Cancer. 2009;125(6):1276–1284. doi: 10.1002/ijc.24378. [DOI] [PubMed] [Google Scholar]
- 40.Heinzman JM, Brower SL, Bush JE. Cancer Cell Int. 2008;8(1):11. doi: 10.1186/1475-2867-8-11. [DOI] [PMC free article] [PubMed] [Google Scholar]
- 41.de Jong JS, van Diest PJ, van der Valk P, Baak J. J Pathol. 1998;184(1):44–52. doi: 10.1002/(SICI)1096-9896(199801)184:1<44::AID-PATH984>3.0.CO;2-H. [DOI] [PubMed] [Google Scholar]
- 42.Rivas MA, Carnevale RP, Proietti CJ, Rosemblit C, Beguelin W, Salatino M, Charreau EH, Frahm I, Sapia S, Brouckaert P, Elizalde PV, Schillaci R. Exp Cell Res. 2008;314(3):509–529. doi: 10.1016/j.yexcr.2007.10.005. [DOI] [PubMed] [Google Scholar]
- 43.Park KS, Mok JW, Ko HE, Tokunaga K, Lee MH. Eur J Immunogenet. 2002;29(1):7–10. doi: 10.1046/j.0960-7420.2001.00260.x. [DOI] [PubMed] [Google Scholar]
- 44.Ferrara N, Gerber H, Lecouter J. Nat Med. 2003;9(6):669–676. doi: 10.1038/nm0603-669. [DOI] [PubMed] [Google Scholar]
- 45.Pantschenko AG, Pushkar I, Anderson KH, Wang Y, Miller LJ, Kurtzman SH, Barrows G, Kreutzer DL. Int J Oncol. 2003;23(2):269–284. [PubMed] [Google Scholar]
- 46.Whiteside TL, Herberman RB. Curr Opin Immunol. 1995;7(5):704–710. doi: 10.1016/0952-7915(95)80080-8. [DOI] [PubMed] [Google Scholar]
- 47.Nagai S, Toi M. Breast Cancer. 2000;7(3):181–186. doi: 10.1007/BF02967457. [DOI] [PubMed] [Google Scholar]
- 48.Lyon DE, McCain NL, Walter J, Schubert C. Nurs Res. 2008;57(1):51. doi: 10.1097/01.NNR.0000280655.58266.6c. [DOI] [PMC free article] [PubMed] [Google Scholar]
- 49.Dethlefsen C, Højfeldt G, Hojman P. Breast Cancer Res Treat. 2013;138(3):657–664. doi: 10.1007/s10549-013-2488-z. [DOI] [PubMed] [Google Scholar]
- 50.Kim H, Choi JA, Park GS, Kim JH. PLoS One. 2012;7(11):e49186. doi: 10.1371/journal.pone.0049186. [DOI] [PMC free article] [PubMed] [Google Scholar]
- 51.Hamidullah, Changkija B, Konwar R. Breast Cancer Res Treat. 2012;133(1):11–21. doi: 10.1007/s10549-011-1855-x. [DOI] [PubMed] [Google Scholar]
- 52.Heckel MC, Wolfson A, Slachta CA, Schwarting R, Salgame P, Katsetos CD, Platsoucas CD. Cell Immunol. 2011;266(2):143–153. doi: 10.1016/j.cellimm.2010.09.010. [DOI] [PubMed] [Google Scholar]
- 53.Del Vecchio M, Bajetta E, Canova S, Lotze MT, Wesa A, Parmiani G, Anichini A. Clin Cancer Res. 2007;13(16):4677–4685. doi: 10.1158/1078-0432.CCR-07-0776. [DOI] [PubMed] [Google Scholar]
- 54.Srabovic N, Mujagic Z, Mujanovic-Mustedanagic J, Muminovic Z, Softic A, Begic L. Biochem medica. 2011;21(2):131–138. doi: 10.11613/bm.2011.021. [DOI] [PubMed] [Google Scholar]
- 55.Krzanowski WJ. Principles of Multivariate Analysis: A User’s Perspective. Oxford University Press; Oxford, U.K: 2000. revised ed. [Google Scholar]
- 56.Abdi H, Williams LJ. Wiley Interdiscip Rev Comput Stat. 2010;2(4):433–459. [Google Scholar]
- 57.Eriksson L, Byrne T, Johansson E, Trygg J, Vikström C. Multi- and Megavariate Data Analysis Basic Principles and Applications. MKS Umetrics AB; Malmö, Sweden: 2013. [Google Scholar]
- 58.Debnath J, Muthuswamy SK, Brugge JS. Methods. 2003;30(3):256–268. doi: 10.1016/s1046-2023(03)00032-x. [DOI] [PubMed] [Google Scholar]
- 59.Overholtzer M, Zhang J, Smolen GA, Muir B, Li W, Sgroi DC, Deng CX, Brugge JS, Haber DA. Proc Natl Acad Sci U S A. 2006;103(33):12405–12410. doi: 10.1073/pnas.0605579103. [DOI] [PMC free article] [PubMed] [Google Scholar]
- 60.Zhang J, Smolen GA, Haber DA. Cancer Res. 2008;68(8):2789–2794. doi: 10.1158/0008-5472.CAN-07-6205. [DOI] [PubMed] [Google Scholar]
- 61.Hirsch HA, Iliopoulos D, Tsichlis PN, Struhl K. Cancer Res. 2009;69(19):7507–7511. doi: 10.1158/0008-5472.CAN-09-2994. [DOI] [PMC free article] [PubMed] [Google Scholar]
- 62.Wells A, Welsh JB, Lazar CS, Wiley HS, Gill GN, Rosenfeld MG. Science (Washington, DC, U S) 1990;247(4945):962–964. doi: 10.1126/science.2305263. [DOI] [PubMed] [Google Scholar]
- 63.Vukicevic S, Kleinman HK, Luyten FP, Roberts AB, Roche NS, Reddi AH. Exp Cell Res. 1992;202:1–8. doi: 10.1016/0014-4827(92)90397-q. [DOI] [PubMed] [Google Scholar]
- 64.Bachelder RE, Crago A, Chung J, Wendt MA, Shaw LM, Robinson G, Mercurio AM. Cancer Res. 2001;61(15):5736–5740. [PubMed] [Google Scholar]
- 65.Rowley JA, Madlambayan G, Mooney DJ. Biomaterials. 1999;20:45–53. doi: 10.1016/s0142-9612(98)00107-0. [DOI] [PubMed] [Google Scholar]
- 66.Haji-Karim M, Carisson J. Cancer Res. 1978;38(5):1457–1464. [PubMed] [Google Scholar]
- 67.Even-ram S, Yamada KM. Curr Opin Cell Biol. 2005;17:524–532. doi: 10.1016/j.ceb.2005.08.015. [DOI] [PubMed] [Google Scholar]
- 68.Normand V, Lootens DL, Amici E, Plucknett KP, Aymard P. Biomacromolecules. 2000;1(4):730–738. doi: 10.1021/bm005583j. [DOI] [PubMed] [Google Scholar]
- 69.Lopez-Garcia MDC, Beebe DJ, Crone WC. Biomed Mater Eng. 2010;20(6):361–369. doi: 10.3233/BME-2010-0649. [DOI] [PubMed] [Google Scholar]
- 70.Soofi SS, Last JA, Liliensiek SJ, Nealey PF, Murphy CJ. J Struct Biol. 2009;167(3):216–219. doi: 10.1016/j.jsb.2009.05.005. [DOI] [PMC free article] [PubMed] [Google Scholar]
- 71.Cross MJ, Claesson-Welsh L. Trends Pharmacol Sci. 2001;22(4):201–207. doi: 10.1016/s0165-6147(00)01676-x. [DOI] [PubMed] [Google Scholar]
- 72.Morstyn G, Burgess AW. Cancer Res. 1988;48(20):5624–5638. [PubMed] [Google Scholar]
- 73.Scheller J, Chalaris A, Schmidt-Arras D, Rose-John S. Biochim Biophys Acta, Mol Cell Res. 2011;1813:878–888. doi: 10.1016/j.bbamcr.2011.01.034. [DOI] [PubMed] [Google Scholar]
- 74.Baggiolini M, Walz A, Kunkel SL. J Clin Invest. 1989;84:1045–1049. doi: 10.1172/JCI114265. [DOI] [PMC free article] [PubMed] [Google Scholar]
Associated Data
This section collects any data citations, data availability statements, or supplementary materials included in this article.