Abstract
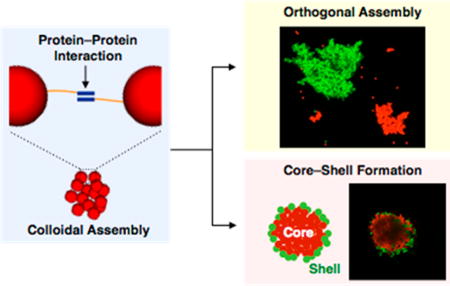
Programmable colloidal assembly enables the creation of mesoscale materials in a bottom-up manner. Although DNA oligonucleotides have been used extensively as the programmable units in this paradigm, proteins, which exhibit more diverse modes of association and function, have not been widely used to direct colloidal assembly. Here we use protein–protein interactions to drive controlled aggregation of polystyrene microparticles, either through reversible coiled-coil interactions or through intermolecular isopeptide linkages. The sizes of the resulting aggregates are tunable and can be controlled by the concentration of immobilized surface proteins. Moreover, particles coated with different protein pairs undergo orthogonal assembly. We demonstrate that aggregates formed by association of coiled-coil proteins, in contrast to those linked by isopeptide bonds, are dispersed by treatment with chemical denaturants or soluble competing proteins. Finally, we show that protein–protein interactions can be used to assemble complex core–shell aggregates. This work illustrates a versatile strategy for engineering colloidal systems for use in materials science and biotechnology.
Graphical Abstract
INTRODUCTION
Assembly of colloidal particles into mesoscale aggregates has been a topic of continuing interest because of its relevance to applications in photonics, drug delivery and synthetic biology.1–4 Many strategies have been used to drive assembly of colloidal particles, including evaporation,5,6 depletion,7 and electrostatic interactions.8,9 Recently, research on colloidal assembly has focused on the use of specific interactions between grafted biomolecules to direct the assembly of particles into more complex architectures.10 DNA oligonucleotides have been used extensively for this purpose because interparticle interactions can be programmed simply and directly through Watson–Crick base-pairing.11–14 Many researchers have used this approach to form colloidal crystals and aggregates.11–14 By tuning the relative sizes of the underlying colloidal particles and complementarity of the oligonucleotides, researchers have been able to create a striking variety of ordered superlattices.12
An alternative approach is to use associative proteins or peptides to program colloidal assembly.15–17 Stevens and co-workers demonstrated the assembly of gold nanoparticles using coiled-coil peptide domains as associative units.17 Coiled-coil domains are especially well suited to the task of directing colloidal assembly; they form helical bundles of small and predictable aggregation number, they are relatively easily engineered through variation in amino acid sequence,18,19 and many examples in the natural world can serve as starting points for new designs.20 Self-assembly of nanoparticles by homooligomeric16 and heterodimeric17 coiled-coil peptides grafted to particle surfaces, as well as by peptide linkers,21 has been reported. Multistep assembly of hierarchically structured inorganic nanoparticles has also been shown.22
Work on protein-mediated assembly of micron-sized colloidal particles has been more limited. Schoen and co-workers used self-associating coiled-coil peptides to drive formation of small (~ 20 particles) clusters.15 They were able to reverse cluster formation by addition of excess soluble peptide. Deyev and co-workers have used the barnase-barstar interaction to form complex structures that span multiple length scales.23,24
Here we examine two systems for protein-mediated assembly of colloidal microparticles–one based on a pair of high-affinity coiled-coil proteins,19 the other on the SpyTag/SpyCatcher system, which forms covalent isopeptide bonds between associative protein domains.25 We show that these interactions can be used to drive large-scale aggregation of particles, and to determine the conditions that allow dispersal of aggregates. Aggregate size can be controlled by stoichiometry or by competition with soluble peptide. Finally, we show that these interactions can be used to create complex architectures such as core–shell aggregates. The strategies described here should enable the assembly of particulate and cellular systems for applications in catalysis, drug delivery and tissue engineering.26
RESULTS AND DISCUSSION
Design of Associative Proteins
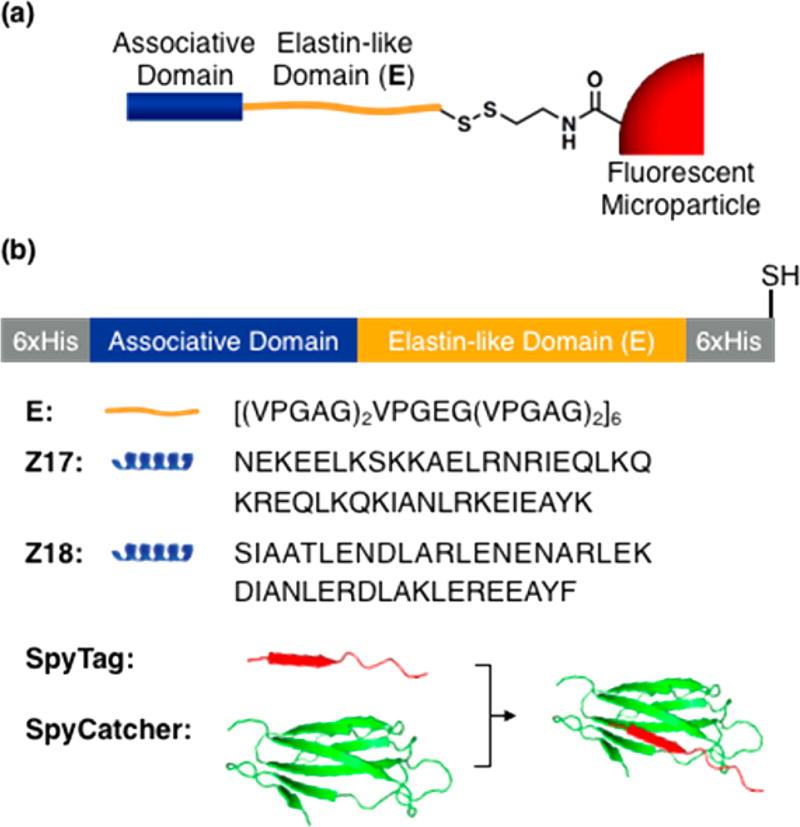
We employed two pairs of associative protein domains, designated SYNZIP17/SYNZIP18 (Z17/Z18) and SpyTag/SpyCatcher, in this study (Figure 1b). Z17 and Z18 are coiled-coil peptides derived from the SYNZIP library introduced by Keating and co-workers,19 and are reported to form antiparallel coiled-coil dimers with high (<10 nM) affinity. SpyTag and SpyCatcher were derived from the Streptococcus pyogenes fibronectin-binding protein FbaB by Howarth and co-workers,25 who showed that association of the two domains leads to formation of an isopeptide bond between a lysine residue in SpyCatcher and an aspartic acid residue in SpyTag. The SpyTag/SpyCatcher interaction has been used to prepare cross-linked hydrogels,27 to control protein topology,28 to analyze expression and localization of proteins,29,30 and to create long, extended proteins by linking together multiple polypeptides.31 Each of the associative protein domains was genetically fused at its C-terminus to an elastin-like polypeptide bearing a C-terminal cysteine residue for site-specific conjugation to particle surfaces. Hexahistidine tags were added to N- and C-termini of each protein to facilitate purification. These proteins, along with a control protein containing no associative domain (denoted E), were expressed in Escherichia coli and purified by affinity chromatography. Yields of purified protein were in all cases at least 50 mg/L.
Figure 1.
(a) Schematic illustration of polystyrene particles functionalized with associative proteins. (b) Designs of artificial proteins used in this study. Complete amino acid sequences are given in the Supporting Information. Crystal structure of SpyTag and SpyCatcher is adopted from PDB (ID: 4MLI).
Assembly of Protein-Functionalized Particles
Carboxylated fluorescent polystyrene particles (d = 2.0 μm) were activated by treatment with N-hydroxysuccinimide and 1-ethyl-3-(3-(dimethylamino)propyl)carbodiimide hydrochloride. 2-(2-Pyridinyldithio)ethaneamine hydrochloride was added to introduce thiol-reactive pyridyl disulfide functionality to the particle surface.32 After removal of excess reagents, proteins bearing C-terminal cysteine residues were grafted to the particle surface via thiol exchange.
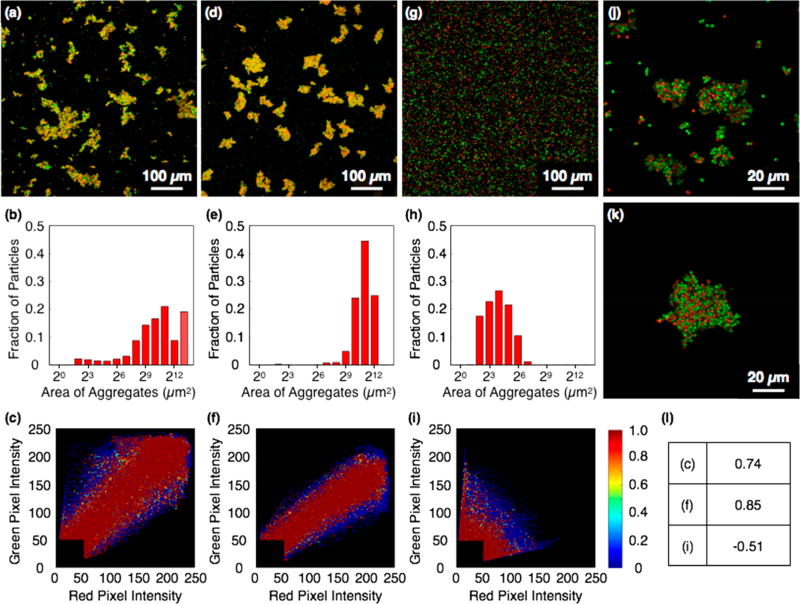
To initiate colloidal assembly, protein-functionalized particles were mixed in phosphate-buffered saline (PBS, pH 7.5) with 0.005% tween 20 and continuously mixed at 25 °C. After 30 min, particle suspensions bearing either the Z17/Z18 pair or the SpyTag/SpyCatcher pair contained visible aggregates. Suspensions were cast between glass coverslips separated by a 120-μm spacer and imaged by fluorescence confocal microscopy. Mixtures of Z17- and Z18-functionalized particles formed aggregates, broadly distributed in size with an average projected area of 1300 μm2 (Figure 2a,b). Aggregates formed from mixtures of SpyTag- and SpyCatcher-functionalized particles were larger (average projected area 3100 μm2; Figure 2d,e). Cross-association of Z17 and Z18 particles, and of SpyTag and SpyCatcher particles, was apparent in fluorescence images (Figure 2j,k) and in the results of colocalization analysis (Figure 2c,f,i). In contrast, no clustering was observed when particles functionalized with Z17 were mixed with those bearing SpyTag (Figure 2g,h). Colocalization analysis of Z17/SpyTag suspensions revealed negative correlation of green and red fluorescence signals (ρ = –0.51) indicating no substantial cross-association (Figure 2i). Aggregates formed using either protein pair do not grow without bound, probably because larger aggregates are fragmented by the constant mixing during the aggregation process.
Figure 2.
Assembly of microparticles functionalized with (a) Z17 (green) and Z18 (red), (d) SpyCatcher (green) and SpyTag (red), and (g) SpyTag (green) and Z17 (red). (b,e,h) Size distributions of aggregates shown in (a,d,g). (c,f,i) Colocalization plots of aggregates shown in (a,d,g). (j,k) Magnified images of aggregates of (j) Z17/Z18 and (k) SpyTag/SpyCatcher. (l) Pearson correlation coefficients of colocalization plots.
To investigate the dependence of cluster size on the density of grafting of associative proteins, we prepared sets of fluorescent particles functionalized with different ratios of Z17 and SpyCatcher; each set was then mixed with particles functionalized with SpyTag (Figure S1). In this way, the effective number of protein interactions between particles could be varied, although we were unable to determine the absolute surface densities of grafted proteins by flow cytometry, bicinchoninic acid (BCA) assay or other means. When particles were functionalized by treatment with Z17 and SpyCatcher at a 1:3 ratio (v/v) and mixed with SpyTag-functionalized particles, we found aggregates of average projected area 2900 μm2. When the concentration of SpyCatcher was reduced to half that of Z17, the aggregate size decreased substantially (average projected area 310 μm2).
Dissociation of Particle Aggregates
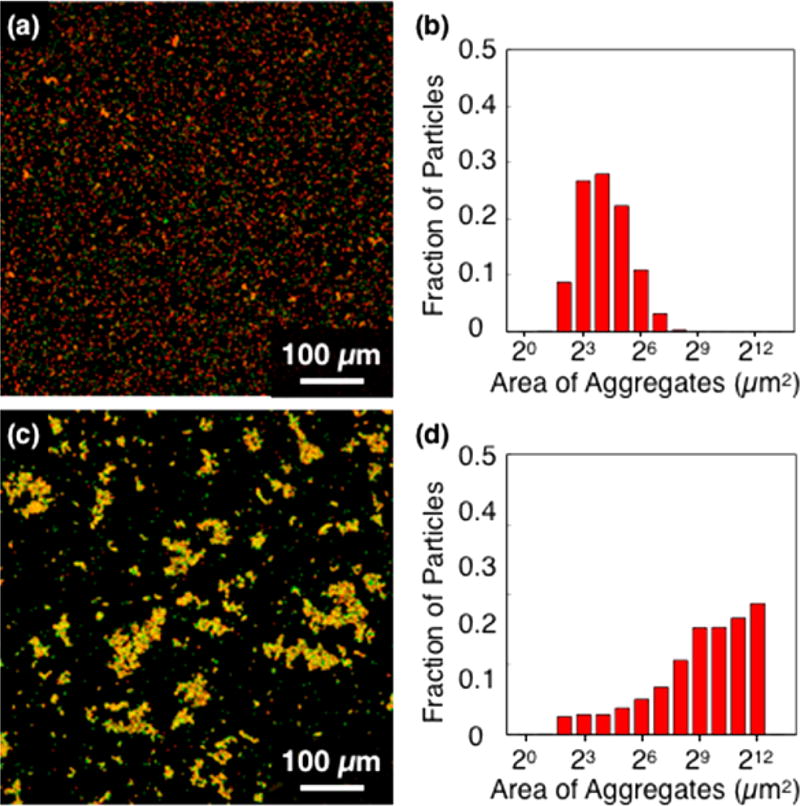
The Z17/Z18 pair drives particle association through physical protein–protein interactions whereas the SpyTag/SpyCatcher pair is expected to form covalent interparticle bonds. We anticipated that the former pair would be dissociated by chemical denaturants and by excess soluble protein competitors, and that the latter would be resistant to such treatments. To test these expectations, we added guanidine hydrochloride (GuHCl) or soluble Z17 protein (identical to the protein that was conjugated to particles) to suspensions of assembled particles, mixed at 25 °C, and analyzed the resultant aggregates by fluorescence confocal microscopy. Aggregates of Z17- and Z18-coated particles were effectively dispersed both by 5 M GuHCl (3 h) and by 1.0 mg/mL soluble Z17 (24 h) (Figure 3a–d). Notably, the sizes of the aggregates were controlled by the amounts of denaturant and soluble protein (Figures S2, S3). In contrast, aggregates assembled through interaction of grafted SpyTag and SpyCatcher domains remained intact upon addition of GuHCl or free SpyTag, indicative of stable covalent bond formation between surface-bound proteins (Figures 3e,f, S4).
Figure 3.
Dissociation of Z17–Z18 particle aggregates by (a) 1 mg/mL and (c) 0 mg/mL (control) soluble Z17 mixed at 25 °C for 24h. (b,d) Size distributions of Z17–Z18 particle aggregates shown in (a,c).
Orthogonal Assembly and Selective Dissociation
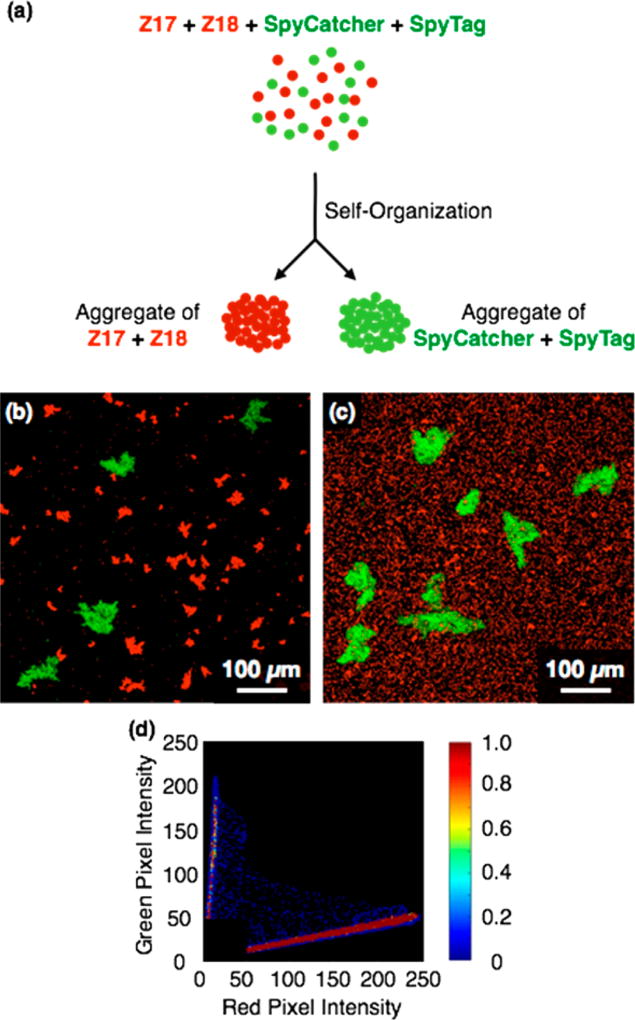
In light of the specificity of the SYNZIP proteins and the SpyTag/SpyCatcher pair, we expected mixtures of particles coated with Z17, Z18, SpyTag and SpyCatcher to undergo orthogonal assembly (Figure 4a). To test this hypothesis, red fluorescent particles functionalized with Z17 or Z18 and green particles functionalized with SpyTag or SpyCatcher were mixed in PBS with 0.005% tween 20 for 40 min until visible particle aggregates were formed. The resulting particle suspensions were imaged by confocal microscopy. As shown in Figure 4b, aggregates of red particles and green particles formed separately, and the colocalization plot revealed a strong negative correlation (ρ = –0.61) between red and green fluorescence channels. Notably, aggregates formed by association of Z17 and Z18 were smaller than those formed by SpyTag and SpyCatcher, consistent with the results of aggregation experiments with separate particle mixtures (Figure 2a,b).
Figure 4.
(a) Schematic illustration of orthogonal assembly of protein-functionalized particles. Red fluorescent particles are coated with Z17 and Z18, and green fluorescent particles are coated with SpyTag and SpyCatcher. (b) Orthogonal assembly in a 1:1:1:1 particle mixture of Z17 (red), Z18 (red), SpyCatcher (green) and SpyTag(green) in PBS with 0.005% tween 20 mixed at 25 °C for 40 min. (c) Selective dissociation of Z17–Z18 aggregates by 1 mg/mL soluble Z17 for 24 h. (d) Colocalization plot of red and green particles shown in (b).
Because the SpyTag/SpyCatcher pair forms aggregates that are stable with respect to denaturants and excess competitive protein (Figure 3, S4), we imagined that Z17/Z18 aggregates would be selectively dissociated in mixtures of all four particles. We prepared such mixtures, and then added 5 M GuHCl or 1 mg/mL free Z17 to investigate their dissociation behavior (Figure 4c, S5). After mixing for 24 h in 1 mg/mL free Z17, significant dissociation of aggregates of Z17- and Z18-functionalized particles was observed, whereas no dissociation of SpyTag- and SpyCatcher-functionalized particles was noted (Figure 4c). Similarly, selective dissociation of aggregates of Z17- and Z18-functionalized particles was observed upon treatment with 5 M GuHCl (Figure S5).
Formation of Core–Shell Architecture
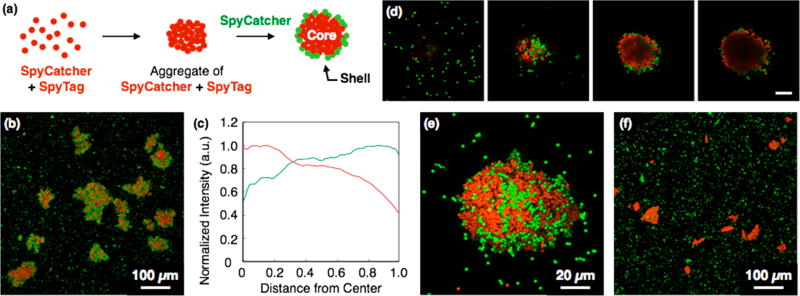
In drug delivery and tissue engineering applications, it may be useful to form core–shell aggregates to control diffusion of materials into or out of particle clusters. For example, core–shell structures enable the controlled sequential delivery of multiple drugs33 or delivery of hydrophilic drugs.34 Toward this end, we constructed core–shell aggregates by exploiting the strong, selective interaction between SpyTag and SpyCatcher (Figure 5a). Red fluorescent particles were functionalized with SpyTag or SpyCatcher and mixed in PBS with 0.005% tween 20 to form covalent core structures. After 30 min, green fluorescent particles coated with SpyCatcher were added, and the suspension was mixed for 1 h to form the shell. Confocal fluorescence microscopy confirmed the formation of core–shell aggregates with surface-confined green fluorescent particles surrounding the red core structure, although the surface coverage is incomplete (Figure 5b). Z-stacked images (Figure 5d) show that the cores are formed exclusively by red particles, which exclude the green particles added subsequently. Moreover, radial fluorescence intensity profiles reveal decreasing red fluorescence near the aggregate surface, where green fluorescence increases (Figure 5c). In contrast, addition of green E-functionalized particles to red SpyTag/SpyCatcher cores did not yield shell layers (Figure 5f); assembly of the shell appears to require specific interaction between SpyTag and SpyCatcher. Quantitative analysis of core–shell aggregates showed that 60 ± 8% (n = 9) of the surface was occupied by green particles (Figure S7), while in the control images, only 7 ± 4% (n = 9) of the surface was green (Figure S8).
Figure 5.
(a) Schematic illustration of formation of core–shell architecture. (b) Core–shell structure formed by SpyTag- and SpyCatcher-functionalized particles. SpyCatcher-coated particles (green) were added to the aggregates of SpyTag- and SpyCatcher-functionalized particles (red) in PBS with 0.005% tween 20 at 25 °C. (c) Fluorescence intensity of core–shell structure shown in (b), plotted against the distance from center of the aggregates. (d) Z-stack of magnified images of core–shell structure formed by SpyTag and SpyCatcher. Images are shown with 3.87 μm slice spacing. Total thickness: 11.6 μm. Scale bar: 20 μm. (e) Orthogonal projection image of (d). (f) Control experiment for core–shell formation. E-functionalized particles (green) were added to the aggregates of SpyTag- and SpyCatcher-functionalized particles (red).
We were unable to construct core–shell structures by SYNZIP-driven assembly. In the SYNZIP system, the core and shell layers were poorly defined; the reversibility of the interaction between Z17 and Z18 appears to enable intermixing of the core and shell.
CONCLUSIONS
In this study, we demonstrated programmed assembly of microparticles using two associative protein pairs (Z17/Z18 and SpyTag/SpyCatcher), as well as selective dissociation of mixed aggregates and the formation of core–shell architectures. The methods developed in this report represent a new strategy for the synthesis of mesoscale materials using programmable protein–protein interactions. The strategy is general and easily expanded, owing to the diversity of associative protein domains.31,35,36 The preparation of complex colloidal aggregates in a scalable, programmable manner should find application in catalysis, health technologies and environmental remediation.37–39
METHODS
Cloning, Protein Expression, Purification
Experimental details of cloning, protein expression, and purification can be found in the Supporting Information.
Immobilization of Associative Proteins
Fluorescent carboxylated polystyrene microparticles (d = 2.0 μm; Sigma-Aldrich) were dispersed in 50 mM MES buffer (pH 6.8). A solution of 30 mM NHS and 20 mM EDC in MES buffer was added and mixed at 25 °C. After 30 min, particles were collected by centrifugation and washed with PBS (pH 7.5). PDEA was dissolved in sodium acetate buffer (100 mM, pH 4.2) and added to particles to a final concentration of 25 mM. After mixing at 25 °C for 30 min, particles were collected and washed with PBS. Protein solution (1 mg/mL) in PBS with 10 mM sodium azide was added to particles and samples were mixed at 25 °C for 22 h. Particles were washed with PBS to remove unreacted proteins, and dispersed in PBS with 10 mM sodium azide for use in assembly experiments.
Image Analysis
All image analysis code was written in Matlab 2015a. Images were generally saved as 16 bit.czi files. Czi files were opened using the Bioformats toolbox and custom-written code.40
Cluster size analysis was performed as follows: For simplicity, confocal z-stack images were collapsed into maximum intensity projections. These projections were manually thresholded based on the intensity in each fluorescence channel. Pixels above the threshold in either channel were defined to be “bright”. The projected areas of aggregates containing contiguous “bright” pixels were extracted. The projected areas were then converted into area-weighted distributions and area-weighted averages according to the equations:
where Pw,i is the area-weighted probability of a cluster of projected area i, and Ni is the number of clusters of this size. These probabilities were binned logarithmically (base 2), and plotted as histograms. The height of a bar represents the probability that a particle chosen at random is found in an aggregate of projected area between the number for that bar and the number for the next bar (e.g., the bar for 128 μm2 contains aggregates between 128 and 256 μm2). Aggregate “volumes” may be extracted in similar fashion, but in our experience, projected areas can be determined more accurately because the laser intensity is attenuated in the cores of larger aggregates.
Colocalization analysis was performed as follows: Confocal z-stack images were collapsed into maximum intensity projections. Because individual particles extend beyond a single pixel, images were blurred using a mean filter acting on a disc of radius five pixels (representing approximately two particle diameters). In this way, adjacent pixels were blurred into each other, while leaving the larger-scale structure of the aggregate intact. Dark pixels (those below threshold) were then excluded from the analysis, and the colocalization between fluorescence channels was plotted using scatplot.41 Pearson correlation coefficients were calculated to provide a measure of colocalization of green and red fluorescence signals.
Core–shell fluorescence intensity profiles were created as follows: In maximum intensity projections, large aggregates were identified by thresholding in a manner similar to that used for cluster size analysis. For each large aggregate, z-stacks with high levels of fluorescence were combined using a mean-intensity projection. Then, starting at the centroid of each aggregate, 100 radii representing equally spaced directions were drawn to the edge of the aggregate (determined by thresholding), extracting the fluorescence intensities from each channel. The fluorescence intensities were then scaled (with a value of 1 representing the maximum fluorescence intensity in each aggregate) and plotted along a “location” axis from 0 to 1 (with 0 representing the centroid and 1 representing the edge of the aggregate for each radius). Further explanation of this algorithm can be found in the Supporting Information.
Estimates for surface coverage of shell particles was performed by finding a surface projection of the 3D z-stack images. The algorithm is explained in the Supporting Information.
All image analysis code can be obtained from http://tirrell-lab.caltech.edu/Code.
Supplementary Material
Acknowledgments
We thank Trudy Padmore for technical assistance with particle conjugation and Andres Collazo for assistance with confocal microscopy. This work was supported by Defense Advanced Research Projects Agency Biological Robustness in Complex Settings Contract HR001-15-C-0093. M.O is supported by the Nakajima Foundation. B.S. is supported by NIH Training Grant 1T32GM112592 and by the Rosen Center for Bioengineering. Imaging was performed in the Biological Imaging Facility, with the support of the Caltech Beckman Institute and the Arnold and Mabel Beckman Foundation.
Footnotes
ASSOCIATED CONTENT
- Details of cloning, protein expression and purification; additional fluorescence images, size distribution histograms, and further details about image analysis algorithms (PDF)
The authors declare no competing financial interest.
References
- 1.Li F, Josephson DP, Stein A. Angew. Chem. Int. Ed. 2011;50:360. doi: 10.1002/anie.201001451. [DOI] [PubMed] [Google Scholar]
- 2.Velev OD, Gupta S. Adv. Mater. 2009;21:1897. [Google Scholar]
- 3.Lin MY, Lindsay HM, Weitz DA, Ball RC, Klein R, Meakin P. Nature. 1989;339:360. [Google Scholar]
- 4.Rosi NL, Mirkin CA. Chem. Rev. 2005;105:1547. doi: 10.1021/cr030067f. [DOI] [PubMed] [Google Scholar]
- 5.Fan F, Stebe KJ. Langmuir. 2004;20:3062. doi: 10.1021/la030380c. [DOI] [PubMed] [Google Scholar]
- 6.Zhou Z, Yan Q, Li Q, Zhao XS. Langmuir. 2007;23:1473. doi: 10.1021/la062601v. [DOI] [PubMed] [Google Scholar]
- 7.Lin Kh, Crocker JC, Prasad V, Schofield A, Weitz DA, Lubensky TC, Yodh AG. Phys. Rev. Lett. 2000;85:1770. doi: 10.1103/PhysRevLett.85.1770. [DOI] [PubMed] [Google Scholar]
- 8.Rugge A, Tolbert SH. Langmuir. 2002;18:7057. [Google Scholar]
- 9.Leunissen ME, Christova CG, Hynninen AP, Royall CP, Campbell AI, Imhof A, Dijkstra M, van Roij R, van Blaaderen A. Nature. 2005;437:235. doi: 10.1038/nature03946. [DOI] [PubMed] [Google Scholar]
- 10.Snyder CE, Ong M, Velegol D. Soft Matter. 2009;5:1263. [Google Scholar]
- 11.Mirkin CA, Letsinger RL, Mucic RC, Storhoff JJ. Nature. 1996;382:607. doi: 10.1038/382607a0. [DOI] [PubMed] [Google Scholar]
- 12.Macfarlane RJ, Lee B, Jones MR, Harris N, Schatz GC, Mirkin CA. Science. 2011;334:204. doi: 10.1126/science.1210493. [DOI] [PubMed] [Google Scholar]
- 13.Wang Y, Wang Y, Zheng X, Ducrot É, Yodh JS, Weck M, Pine D. Nat. Commun. 2015;6:7253. doi: 10.1038/ncomms8253. [DOI] [PMC free article] [PubMed] [Google Scholar]
- 14.Di Michele L, Varrato F, Kotar J, Nathan SH, Foffi G, Eiser E. Nat. Commun. 2013;4:2007. doi: 10.1038/ncomms3007. [DOI] [PubMed] [Google Scholar]
- 15.Schoen AP, Hommersom B, Heilshorn SC, Leunissen ME. Soft Matter. 2013;9:6781. [Google Scholar]
- 16.Ernenwein D, Ghosh P, Rotello V, Chmielewski J. J. Mater. Chem. 2010;20:5608. [Google Scholar]
- 17.Stevens MM, Flynn NT, Wang C, Tirrell DA, Langer R. Adv. Mater. 2004;16:915. [Google Scholar]
- 18.Woolfson D. Adv. Protein Chem. 2005;70:79. doi: 10.1016/S0065-3233(05)70004-8. [DOI] [PubMed] [Google Scholar]
- 19.Reinke AW, Grant RA, Keating AE. J. Am. Chem. Soc. 2010;132:6025. doi: 10.1021/ja907617a. [DOI] [PMC free article] [PubMed] [Google Scholar]
- 20.Mason JM, Arndt KM. ChemBioChem. 2004;5:170. doi: 10.1002/cbic.200300781. [DOI] [PubMed] [Google Scholar]
- 21.Ryadnov MG, Ceyhan B, Niemeyer CM, Woolfson DN. J. Am. Chem. Soc. 2003;125:9388. doi: 10.1021/ja0352045. [DOI] [PubMed] [Google Scholar]
- 22.Park WM, Champion JA. ACS Nano. 2016;10:8271. doi: 10.1021/acsnano.6b01003. [DOI] [PubMed] [Google Scholar]
- 23.Nikitin MP, Zdobnova TA, Lukash SV, Stremovskiy OA, Deyev SM. Proc. Natl. Acad. Sci. U. S. A. 2010;107:5827. doi: 10.1073/pnas.1001142107. [DOI] [PMC free article] [PubMed] [Google Scholar]
- 24.Aghayeva UF, Nikitin MP, Korostylev EV, Lukash SV, Deyev SM, Petrov RV. Dokl. Biochem. Biophys. 2012;445:210. doi: 10.1134/S1607672912040084. [DOI] [PubMed] [Google Scholar]
- 25.Zakeri B, Fierer J, Celik E, Chittock E, Schwarz-Linek U, Moy V, Howarth M. Proc. Natl. Acad. Sci. U. S. A. 2012;109:E690. doi: 10.1073/pnas.1115485109. [DOI] [PMC free article] [PubMed] [Google Scholar]
- 26.Perez RA, Kim H-W. Acta Biomater. 2015;21:2. doi: 10.1016/j.actbio.2015.03.013. [DOI] [PubMed] [Google Scholar]
- 27.Sun F, Zhang WB, Mahdavi A, Arnold FH, Tirrell DA. Proc. Natl. Acad. Sci. U. S. A. 2014;111:11269. doi: 10.1073/pnas.1401291111. [DOI] [PMC free article] [PubMed] [Google Scholar]
- 28.Zhang W, Sun F, Tirrell DA, Arnold FH. J. Am. Chem. Soc. 2013;135:13988. doi: 10.1021/ja4076452. [DOI] [PubMed] [Google Scholar]
- 29.Bedbrook CN, Kato M, Ravindra Kumar S, Lakshmanan A, Nath RD, Sun F, Sternberg PW, Arnold FH, Gradinaru V. Chem. Biol. 2015;22:1108. doi: 10.1016/j.chembiol.2015.06.020. [DOI] [PMC free article] [PubMed] [Google Scholar]
- 30.Dovala D, Sawyer WS, Rath CM, Metzger LE. Protein Expression Purif. 2016;117:44. doi: 10.1016/j.pep.2015.09.021. [DOI] [PubMed] [Google Scholar]
- 31.Veggiani G, Nakamura T, Brenner MD, Gayet RV, Yan J, Robinson CV, Howarth M. Proc. Natl. Acad. Sci. U. S. A. 2016;113:1202. doi: 10.1073/pnas.1519214113. [DOI] [PMC free article] [PubMed] [Google Scholar]
- 32.Bubenikova S, Stancu IC, Kalinovska L, Schacht E, Lippens E, Declercq H, Cornelissen M, Santin M, Amblarde M, Martineze J. Carbohydr. Polym. 2012;88:1239. [Google Scholar]
- 33.Narayanan S, Pavithran M, Viswanath A, Narayanan D, Mohan CC, Manzoor K, Menon D. Acta Biomater. 2014;10:2112. doi: 10.1016/j.actbio.2013.12.041. [DOI] [PubMed] [Google Scholar]
- 34.Lim MPA, Lee WL, Widjajab E, Loo SCJ. Biomater. Sci. 2013;1:486. doi: 10.1039/c3bm00175j. [DOI] [PubMed] [Google Scholar]
- 35.Thompson KE, Bashor CJ, Lim WA, Keating AE. ACS Synth. Biol. 2012;1:118. doi: 10.1021/sb200015u. [DOI] [PMC free article] [PubMed] [Google Scholar]
- 36.Kim S, Kim JH, Lee JS, Park CB. Small. 2015;11:3623. doi: 10.1002/smll.201500169. [DOI] [PubMed] [Google Scholar]
- 37.Gartner ZJ, Bertozzi CR. Proc. Natl. Acad. Sci. U. S. A. 2009;106:4606. doi: 10.1073/pnas.0900717106. [DOI] [PMC free article] [PubMed] [Google Scholar]
- 38.Elias S, Banin E. FEMS Microbiol. Rev. 2012;36:990. doi: 10.1111/j.1574-6976.2012.00325.x. [DOI] [PubMed] [Google Scholar]
- 39.Kim HJ, Du W, Ismagilov RF. Integr. Biol. 2011;3:126. doi: 10.1039/c0ib00019a. [DOI] [PMC free article] [PubMed] [Google Scholar]
- 40.Linkert M, Rueden CT, Allan C, Burel JM, Moore W, Patterson A, Loranger B, Moore J, Neves C, Macdonald D, Tarkowska A, Sticco C, Hill E, Rossner M, Eliceiri KW, Swedlow JR. J. Cell Biol. 2010;189:777. doi: 10.1083/jcb.201004104. [DOI] [PMC free article] [PubMed] [Google Scholar]
- 41.Sanchez-Barba A. 2005 https://www.mathworks.com/matlabcentral/fileexchange/8577-scatplot.
Associated Data
This section collects any data citations, data availability statements, or supplementary materials included in this article.


