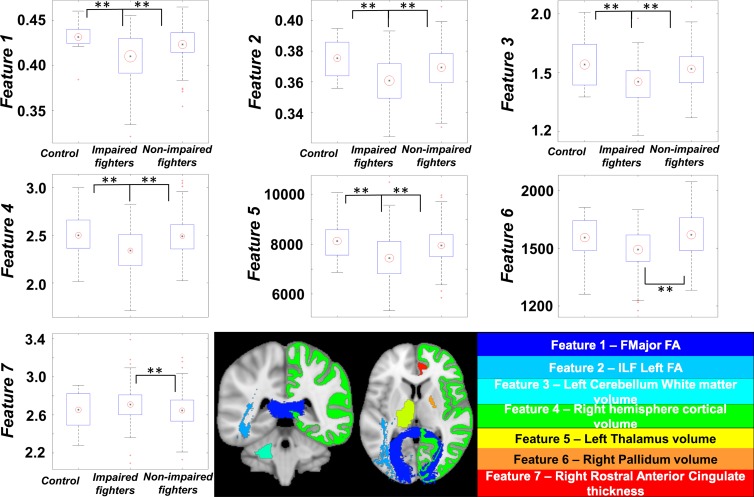
Figure 3:
Boxplots of features identified by using our classifier is shown for every group. Black central dot represents mean, and radius of red circle represents standard deviation of each feature. All standard deviations were scaled to same number throughout groups to reflect between-group differences. ** = Between-group statistical differences for each feature over respective groups. Imaging biomarkers were overlaid on Montreal Neurological Institute 152 template brain and shown at bottom. Name of biomarker is color coordinated with overlaid colors on Montreal Neurological Institute 152 template. Data in boxplots for feature 3 are × 104, and data in the feature 4 boxplot are × 105. ** = corrected P < .05 indicates a significant difference.

