

Abstract
Background
The esophagogastric junction (EGJ) is a complex sphincter composed of both the crural diaphragm (CD) and lower esophageal sphincter (LES). 3D high-resolution manometry (3D-HRM) provides a dynamic 360° representation of EGJ pressure in which the CD has a distinct pressure signature. We aimed to develop 3D-HRM metrics to: 1) quantify the vigor of CD contractility, 2) to best eliminate the CD contribution and thereby isolate the LES component of EGJ contractility, and 3) to compare these metrics to conventional HRM metric of EGJ contractility.
Methods
20 healthy subjects underwent 3D-HRM studies. Two novel 3D-HRM EGJ metrics, 3D-DHA and 3D-LES pressure (3D-LESP) were devised and calculated to best approximate the CD and LES components of the composite EGJ pressure topography. These values were then compared to conventional HRM metrics of EGJ contractility, the EGJ contractile integral (EGJ-CI), inspiratory EGJ pressure and expiratory EGJ pressure.
Key Results
Mean 3D-DHA correlated most strongly with EGJ-CI (r=0.82, p<0.001), while the 3D-LESP correlated most strongly with inspiratory EGJ pressure (r=0.91 p<0.001) and expiratory EGJ pressure (r=0.85, p<0.001).
Conclusions & inferences
We devised novel 3D-HRM metrics to quantify the CD (3D-DHA) and LES (3D-LESP) elements of EGJ contractility. Both measures correlated strongly with conventional HRM metrics of EGJ contractility. The 3D-DHA, in particular, correlated strongly with the EGJ-CI suggesting that both are largely determined by CD contractility. It is hoped that future studies will show these new metrics useful in quantifying elements of the anti-reflux barrier in mechanistically defined subsets of GERD patients.
Keywords: esophageal manometry, esophagogastric junction, lower esophageal sphincter, gastroesophageal reflux disease
INTRODUCTION
The esophagogastric junction (EGJ) is a complex sphincter composed of both the crural diaphragm (CD) and lower esophageal sphincter (LES), the relative dominance of which varies with the respiratory cycle. Recently a high-resolution manometry (HRM) metric, termed the EGJ-contractile integral (EGJ-CI), has been developed to capture both attributes of EGJ barrier function (1). The EGJ-CI is referenced to gastric pressure and among the HRM metrics tested, best discriminated patients with graded degree of EGJ dysfunction as quantified with pH-impedance reflux monitoring studies (1). Since then, several studies have used the EGJ-CI to evaluate EGJ barrier function in defined patient populations (2–4). For example, Tolone et al. compared a large group of GERD patients to functional heartburn patients and reported that GERD patients, defined by endoscopy and pH-impedance studies, had a significantly lower median EGJ-CI (11 vs 22 mmHg·cm, p<0.02) (2). However, apart from the case of complete LES-CD separation with hiatus hernia, the EGJ-CI cannot differentiate EGJ pressure signals generated by the LES and CD components raising the possibility that a more refined manometric technique may provide a more robust assessment of EGJ contractility. The recent development of 3D-HRM offers an opportunity to explore that hypothesis.
The 3D-HRM assembly (ManoScan 3D, Given Imaging, Los Angeles, CA) is a 128-channel solid-state manometric recording device incorporating a 9-cm 3D-HRM segment into an otherwise standard HRM array (Figure 1A). The 3D-HRM segment is comprised of 12 rings of eight radially dispersed independent pressure sensors with the rings spaced 7.5 mm apart (5) providing a dynamic 360° representation of EGJ pressure (Figure 1B). When displayed in a panoramic view (Figure 1C), the diaphragmatic hiatus (DH) has a distinct pressure signature characterized as an inverted V with the apex of the V (DHA) corresponding to CD contact and achieving maximal pressure at full inspiration. The LES, with a circumferential pressure signature throughout the respiratory cycle is much less evident in 3D-HRM recordings (6). The aims of this study were to develop 3D-HRM metrics to: 1) quantify the vigor CD contractility, 2) to best eliminate the CD contribution and thereby isolate the LES component of EGJ contractility, and 3) to compare these metrics to conventional HRM metric of EGJ contractility.
Figure 1.
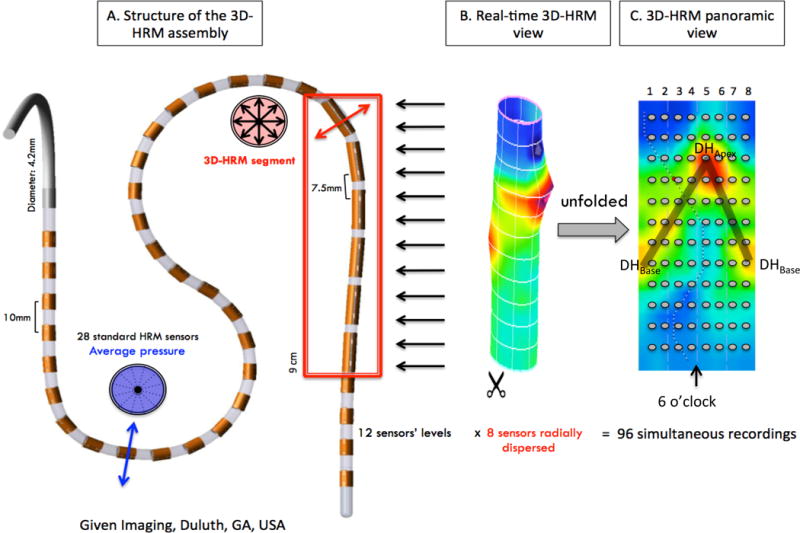
Schematic depiction of the 3D-HRM assembly and resulting 3D-HRM views: Panel A is a representation of the 3D-HRM catheter composed of 32 standard HRM sensors (28 proximal and 4 distal to the 3D segment) and a 3D-HRM segment with 12 levels of 8 radially dispersed sensors. The resulting 3D segment image is a cylinder (Panel B) that can be unfolded to obtain an instantaneous panorama of the pressure topography of the 3D segment (Panel C). The gray dots indicate positions of individual pressure sensors. The orientation of the assembly relative to the esophagogastric junction was not controlled; hence, by convention, the apical diaphragmatic signal (DHApex) was defined as 6 o’clock. The shaded ‘V’ on the topographic plot indicates the disposition of the diaphragm signal (a dominant peak labeled DHApex and a second prominent peak labeled DHBase) (6).
METHODS
Subjects
3D-HRM studies of 20 healthy volunteer subjects were included in this analysis. Volunteers were recruited by advertisement or word of mouth and had no history of esophageal symptoms (heartburn, regurgitation, dysphagia), previous gastrointestinal surgery, or significant medical conditions. All subjects underwent a brief interview, upper endoscopy examination and pH monitoring. The study protocol was approved by the Sun Yat-sen University Institutional Review Board and informed consent was obtained from each subject.
Study protocol
All subjects were studied using the 3D-HRM catheter (Figure 1). Transducers were calibrated at 0 and 300 mmHg using externally applied pressure. Studies were performed in the supine position after a 6hr fast. The manometry assembly was placed transnasally and positioned to record from the hypopharynx to the stomach with the 3D-HRM segment straddling the EGJ and with about 3 intra-gastric sensor rings. After a period of accommodation, 5 minutes of quiescent recording was obtained during which subjects were asked to breathe normally.
HRM data analysis
Calculation of Conventional HRM metrics of the EGJ
Conventional HRM metrics were calculated using ManoView™ analysis software (ManoView ESO 3.0, Given Imaging, Los Angeles, CA) as described in Nicodème et al. (1). Metrics utilized to quantify resting EGJ pressure were the EGJ-contractile integral (EGJ-CI), expiratory EGJ pressure, and inspiratory EGJ pressure. The EGJ-CI value was measured with the distal contractile integral tool during 3 consecutive quiescent respiratory cycles with the isobaric contour tool set at 2 mmHg greater than the intragastric pressure and expressed in units of mmHg·cm. Inspiratory and expiratory EGJ pressures were calculated for the same three respiratory cycles and referenced to intragastric pressure.
Calculation of 3D-HRM metrics of the EGJ
The 3D-HRM metrics of EGJ were calculated using a customized MATLAB (The Math Works, Natick, MA) program (7) applied to the same three respiratory cycles for each study. The MATLAB algorithm of 3-D segment data at each point in time is as follows:
Localize the center of DHA and DHB by generating a maximal spatial pressure variation (SPV) plot of the greatest pressure at each axial locus along the 3D-HRM segment at each instant (Figure 2, left panels). The spatial position of DHA was at the maximal pressure point and DHB was at the second maximal pressure point distal to DHA.
Define a “clean” intragastric pressure (IGP). This was taken as the pressure value at the lowest axial level of the 3D-HRM segment at the radial sensor corresponding to that of DHA. In general, this was opposite the wall of sensor contact (Figure 1C and Figure 2).
Calculate contractile integral values for 180° × 2.25 cm rectangles (4 radial sectors and 4 axial sensors) centered on DHA (dashed magenta box in Figure 2A and 2B) and DHB (dashed black box in Figure 2A and 2B) termed 3D-DHA and 3D-DHB, respectively. These values reflect the instantaneous DH effect. After dividing by 2.25 cm and 4 sectors and referencing to IGP, the resultant 3D-DHA and 3D-DHB values, indicative of the diaphragmatic pressure exerted on opposite semi-circumferences of the EGJ were expressed as mmHg·cm·sector. Since these measures varied widely with respiration, the mean values across three respiratory cycles were reported.
Calculate the 3D LES pressure (3D-LESP) value at each instant. This was derived from a spatial pressure variation plot of the minimal radial pressures at each axial location and referencing to IGP (Figure 2, right panels). The maximum of the minimal radial pressures (3D-eSleeve) was taken as the best approximation of the LES pressure component (Figure 2) (8). Again, because of respiratory fluctuation, mean 3D-LESP values over the course of the three respiratory cycles were reported.
Figure 2.
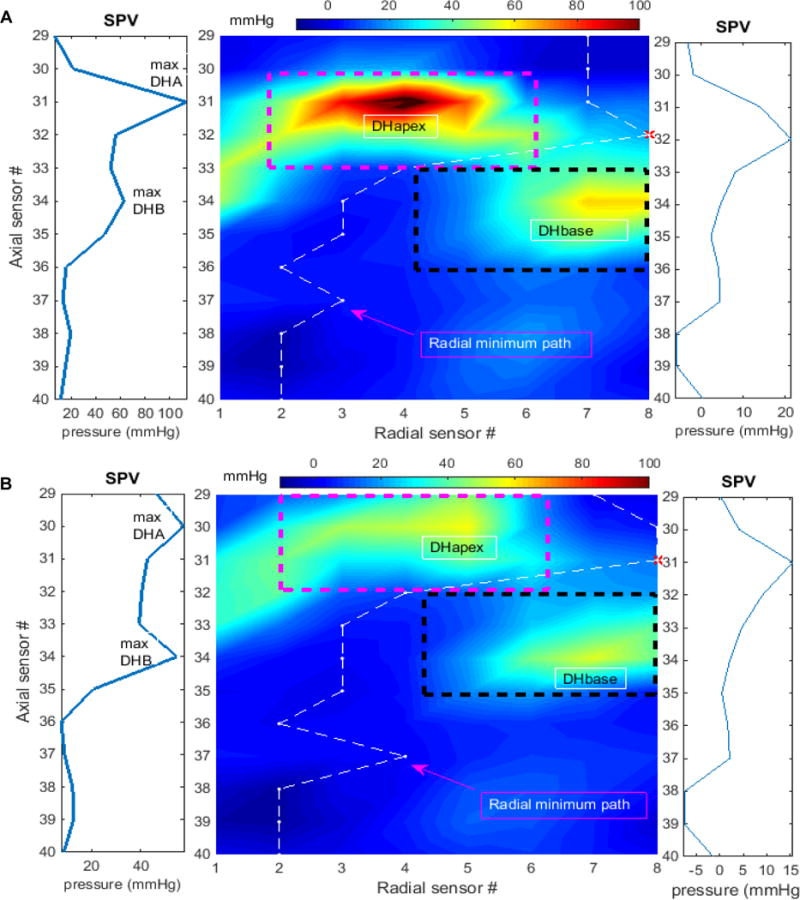
Methodology for calculation 3D-HRM EGJ metrics depicted at instants of maximal inspiration (Panel A) and mid expiration (Panel B). In each panel, the dashed magenta box is the area for calculating 3D-DHA and the black box for 3D-DHB. The corresponding maximal spatial pressure variation (SPV) plots to the left were used for localization of center positions of DHA and DHB. The white dashed line indicates path of the minimal radial pressures and the corresponding spatial pressure variation plot on the right shows the values of these minimal pressures. The maximum of the minimums (red *) was used to define the 3D-LESP axial position and value.
Statistical analysis
Data were summarized as means, SD, median (IQR, interquartile range) and 95% confidence interval (CI) for the mean. Metrics were compared using the Wilcoxon rank sum test. Pearson correlation method was used to determine the association among metrics. A p<0.05 was considered significant.
RESULTS
The 20 healthy subjects were composed of 13 female and 7 male (mean age 25 years, range 21 to 32 years). All had esophageal acid exposure times <4% (median [IQR]: 0 [0, 0]) and none had esophagitis or hiatal hernia. All subjects successfully completed the study. Table 1 summarizes their conventional HRM EGJ metrics. There was significant correlation between EGJ-CI and both inspiratory EGJ pressure (R=0.87, P<0.001) and expiratory EGJ pressure (R=0.83, P<0.001).
Table 1.
Conventional HRM metrics of resting EGJ pressure in 20 healthy controls.
| Metric: | EGJ-CI (mmHg·cm) | Inspiratory EGJ pressure (mmHg) | Expiratory EGJ pressure (mmHg) |
|---|---|---|---|
| Means±SD | 73.0 ± 31.4 | 28.7 ± 13.0 | 20.4 ± 10.8 |
| Median (IQR) | 65.4 (52.3–98.9) | 28.5 (19.0–31.5) | 19.0 (13.0–23.7) |
| 95% CI | 58.3 – 87.7 | 22.6 – 34.8 | 15.3 – 25.4 |
| R* | 0.87, P<0.001 | 0.83, P<0.001 |
Note: SD, standard deviation; CI, confidence interval; IQR, interquartile range; EGJ-CI, esophagogastric junction contractile index;
correlation coefficient to EGJ-CI.
The results of novel 3D-HRM metrics of EGJ pressure are shown in Table 2 and the correlation of these with conventional HRM metrics of EGJ contractility are shown in Table 3. The correlations of EGJ-CI with both 3D-LESP (R=0.77, P<0.001) and 3D-DHA (R=0.82, P<0.001) were strong, suggesting that these metrics quantified similar attributes of the EGJ contractility. Notably, the 3D-LESP correlated most strongly with the conventional EGJ pressure metrics of inspiratory and expiratory EGJ pressure with r values of 0.91 and 0.85 respectively. On the other hand, the 3D-DHA correlated most strongly with the EGJ-CI suggesting that both of these were strongly driven by CD contractility. In contrast, there was no significant correlation between 3D-DHB and any of the conventional metrics. Accordingly, 3D-DHB was not considered to be a robust metric.
Table 2.
Novel 3D-HRM metrics of resting EGJ pressure in 20 healthy controls. 3D-LESP was the maximal value along the spatial pressure variation plot of the minimum radial pressures in the 3D segment. 3D-DHA was a contractile integral value surrounding DHA and 3D-DHB was a contractile integral surrounding for DHB.
| Metric: | 3D-LESP (mmHg) |
3D-DHA (mmHg·cm·sector) |
3D-DHB (mmHg·cm·sector) |
|---|---|---|---|
| Means ± SD | 16.1±8.9 | 30.4±12.9† | 10.1±5.3 |
| Median (IQR) | 12.0 (9.6–19.6) | 30.7 (20.1–37.5)† | 10.2 (5.9–13.2) |
| 95% CI | 11.9 – 20.3 | 24.4 – 36.4 | 7.6 – 12.6 |
Note: SD, standard deviation; CI, confidence interval; IQR, interquartile range;
P<0.001 compared to 3D-DHB.
Table 3.
Correlations (R, P value) of the three novel 3D-HRM metrics (3D-LESP, 3D-DHA, 3D-DHB) with conventional HRM metrics of EGJ pressure (EGJ-CI, inspiratory EGJ pressure, expiratory EGJ pressure) in 20 healthy controls.
| 3D-LESP (mmHg) |
3D-DHA (mmHg·cm·sector) |
3D-DHB (mmHg·cm·sector) |
|
|---|---|---|---|
| EGJ-CI (mmHg·cm) | 0.77, P<0.001 | 0.82, P<0.001 | 0.45, P=0.05 |
| Inspiratory EGJ pressure (mmHg) | 0.91, P<0.001 | 0.80, P<0.001 | 0.21, NS |
| Expiratory EGJ pressure (mmHg) | 0.85, P<0.001 | 0.75, P<0.001 | 0.21, NS |
Figure 4 and 5 show scatter plots comparing 3D-DHA (Figure 4) and 3D-LESP (Figure 5) to conventional metrics of EGJ contractility.
Figure 4.
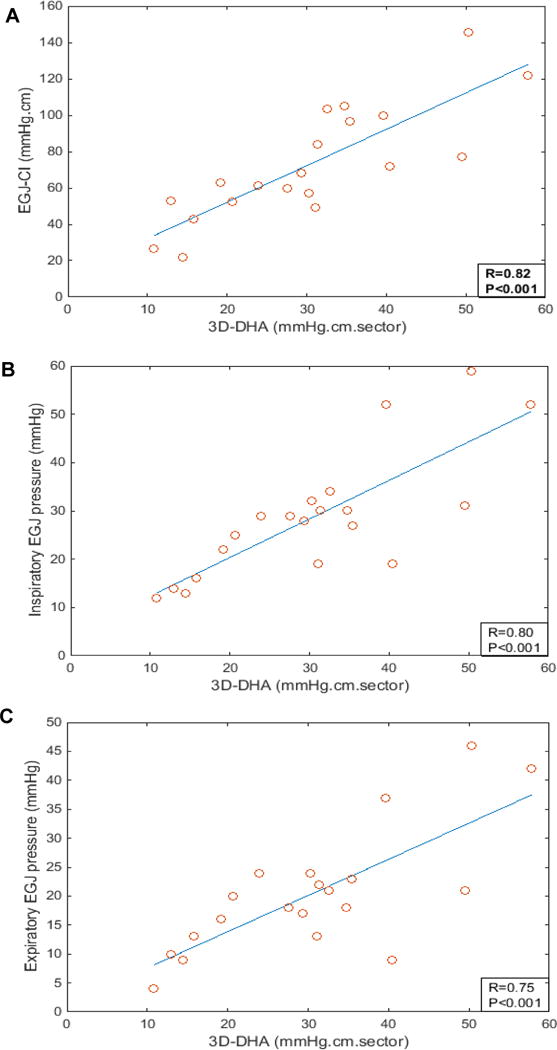
Scatter plots of the correlation (A) between mean 3D-DHA and esophagogastric junction contractile index (EGJ-CI) values, (B) between mean 3D-DHA and inspiratory EGJ pressure values, and (C) between mean 3D-DHA and expiratory EGJ pressure values.
Figure 5.
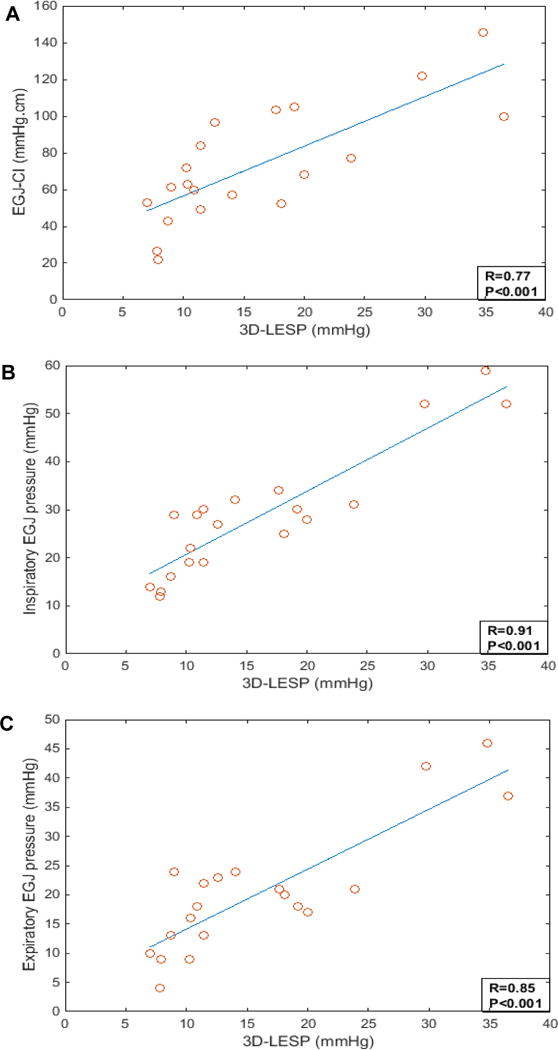
Scatter plots of the correlation (A) between mean 3D-LESP and esophagogastric junction contractile index (EGJ-CI) values, (B) between mean 3D-LESP and inspiratory EGJ pressure values, (C) between mean 3D-LESP and expiratory EGJ pressure values.
DISCUSSION
It is well known that EGJ competence is the fundamental defense against reflux, making it of great clinical significance. However, a major confounder of quantifying EGJ competence is the dual contribution of the CD and LES to EGJ pressure. The aims of this investigation were to study EGJ pressure topography of normal individuals with a novel 3D-HRM device, to develop novel 3D-HRM metrics for quantifying EGJ competence, and to compare those metrics with recently developed HRM metrics of EGJ contractility, specifically the EGJ-CI, inspiratory EGJ pressure, and expiratory EGJ pressure. The major findings of the study were that the 3D-HRM metric that best isolated CD contractility, the 3D-DHA correlated most strongly with the EGJ-CI while the metric that optimally excluded the CD signal, the 3D-LESP correlated most strongly with the conventional HRM metrics of inspiratory and expiratory EGJ pressure.
The 3D HRM pressure signature of the EGJ exemplified in Figure 1 is remarkable for its axial asymmetry, radial asymmetry, and marked respiratory fluctuation. We leveraged these features along with known attributes of the LES (it is a circular muscle) and the CD (it contracts with inspiration and has marked radial asymmetry) to develop 3D-HRM metrics that best segregate the contributions of these elements to the recorded intraluminal pressure. The emerging picture continues to be the surprising dominance of the CD, best quantified by the 3D-DHA in this investigation, to the overall intraluminal pressure topography. Evident in the spatial pressure variation plots in Figure 2 and the comparative data in Figure 3, this pressure dominance is true throughout the respiratory cycle. In fact, our best estimate of the LES component of EGJ pressure, the 3D-LESP, which excludes the CD pressure signature to the maximal extent possible (8) averaged only 12 mmHg in this set of 20 healthy volunteers who exhibited essentially zero acid reflux on pH monitoring studies. The strong correlation between the 3D-DHA and the EGJ-CI is also noteworthy as it implies that the EGJ-CI, the most robust HRM metric yet defined in terms of clinically correlating with EGJ competence (1–4), is also strongly driven by the CD component.
Figure 3.
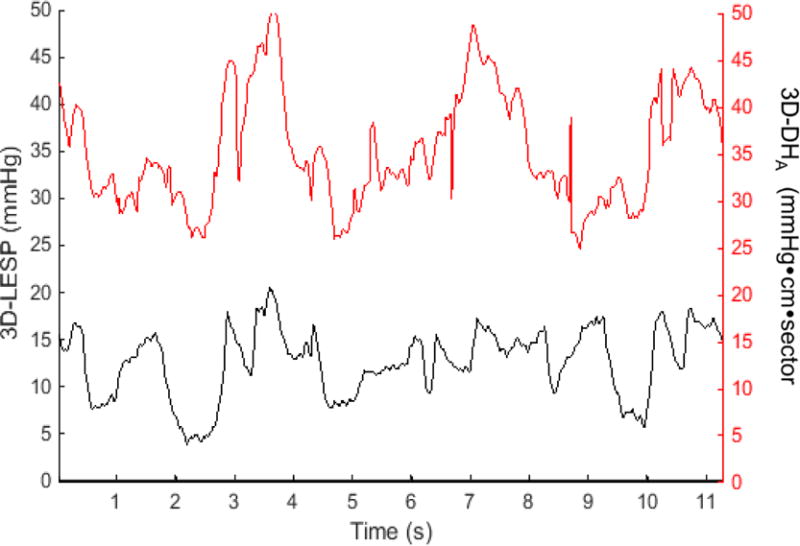
Representative plots of 3D-LESP (curves in black) and 3D-DHA values (curves in red) during three consecutive respiratory cycles (mean 3D-LESP= 12.63 mmHg and mean 3D-DHA =35.4 mmHg·cm·sector) in a healthy subject with a 3D-HRM assembly.
Based on correlation analysis of 3D-HRM EGJ metrics with conventional HRM EGJ metrics summarized in Table 3, we found that 3D-LESP and 3D-DHA were both strongly correlated with all three conventional HRM metrics, suggesting that all of these metrics track with EGJ contractility to some extent. However, the key clinical issue is which one correlates best with EGJ barrier function as defined clinically with pH or pH-impedance monitoring studies, and that question is yet to be addressed. Thus far, the EGJ-CI retains that distinction; whether or not one of these novel 3D-HRM metrics will prove superior remains to be seen. Indeed, a limitation of this study is the lack of 3D-HRM data on symptomatic patient also studied with pH-impedance monitoring for validation of these metrics against a functional assessment of EGJ competence. However, our focus was on the development of this novel approach in comparison with conventional HRM EGJ metrics and future studies will apply these paradigms to GERD patients.
As with any manometric measurements, the numerical 3D-HRM data generated are specific for the instrument used in our investigations and should not be directly compared to data obtained using other instruments. As has been repeatedly shown with HRM instrumentation, what is normal for one device is not necessarily normal for another, especially with respect to measures of the EGJ (9). This issue may partially explain the discrepancy between the EGJ-CI values reported in Table 1 from those previously reported by Nicodème et al (6) utilizing a conventional HRM assembly.
This study has some limitations. Firstly, the subjects studied were mostly young and the sample size was relatively small. Applying these normal ranges to clinical populations needs to be approached cautiously. Secondly, although we devised algorithms to optimally isolate the LES and CD contributions to EGJ pressure morphology, it is not possible to completely achieve this as the structure do overlap and are necessarily mutually influenced. Further experimentation with breathing maneuvers and pharmacological challenges such as atropine may be helpful to further characterize their respective contributions.
In summary, we devised novel 3D-HRM metrics to quantify the CD (3D-DHA) and LES (3D-LESP) elements of the composite 3D EGJ pressure topography. Both measures were shown to correlate with the conventional HRM metrics of EGJ-CI, Inspiratory EGJ pressure and expiratory EGJ pressure. The 3D-DHA, in particular, was strongly correlated with the EGJ-CI suggesting that both of these are largely determined by CD contractility. It is hoped that future studies will show these new metrics to be useful in quantifying elements of the anti-reflux barrier in mechanistically defined subsets of GERD patients.
Key Points.
3D high-resolution manometry (3D-HRM) provides a dynamic 360° representation of esophagogastric junction (EGJ) pressure in which the crural diaphragm (CD) has a distinct pressure signature. The aim of this study was to develop novel metrics for defining the vigor of the CD and lower esophageal sphincter (LES) elements of the composite EGJ 3D pressure topography.
The 3D-HRM metric that best isolated CD contractility, the 3D-DHA, correlated most strongly with the conventional HRM metric, the EGJ contractile integral (EGJ-CI), while the metric that optimally excluded the CD signal, the 3D-LESP correlated most strongly with the conventional HRM metrics of inspiratory and expiratory EGJ pressure.
It is hoped that future studies will show these new metrics to be useful in quantifying elements of the anti-reflux barrier in mechanistically defined subsets of GERD patients.
Acknowledgments
FUNDING
This study was supported by grant R01 DC00646 (PJK) from the United States Public Health Service.
Abbreviations
- CD
crural diaphragm
- DH
diaphragmatic hiatus
- EGJ
esophagogastric junction
- GERD
gastroesophageal reflux disease
- HRM
high resolution manometry
- IGP
intragastric pressure
- LES
lower esophageal sphincter
Footnotes
DISCLOSURE
No conflicts of interests.
AUTHOR CONTRIBUTIONS
ZL: data analysis, data interpretation, drafting of the manuscript, and approval of the final version; YX and MC: study concept, data acquisition and interpretation, and approval of the final version; YL: data acquisition, data analysis and approval of the final version; JEP: study concept interpretation of the data, review and approval of the final version. PJK contributed to the study concept and design, interpretation of the data, revising the manuscript critically, and approval of the final version.
References
- 1.Nicodème F, Pipa-Muniz M, Khanna K, Kahrilas PJ, Pandolfino JE. Quantifying esophagogastric junction contractility with a novel HRM topographic metric, the EGJ-Contractile integral: nomative values and preliminary evaluation in PPI non-responders. Neurogastroenterol Motil. 2014;26:353–60. doi: 10.1111/nmo.12267. [DOI] [PMC free article] [PubMed] [Google Scholar]
- 2.Tolone S, De Bortoli N, Marabotto E, De Cassan C, Bidini G, Roman S, Furnari M, Savarino V, et al. Esophagogastric junction contractility for clinical assessment in patients with GERD: a real added value? Neurogastroenterol Motil. 2015;27:1423–31. doi: 10.1111/nmo.12638. [DOI] [PubMed] [Google Scholar]
- 3.Gor P, Li Y, Munigala S, Patel A, Bolkhir A, Gyawali CP. Interrogation of esophagogastric junction barrier function contractile integral: an observational cohort study. Dis Esophagus. 2015 doi: 10.1111/dote.12389. Epub ahead of print. [DOI] [PMC free article] [PubMed] [Google Scholar]
- 4.Wang D, Patel A, Mello M, Shriver A, Gyawali CP. Esophagogastric junction contractile integral (EGJ-CI) quantifies changes in EGJ barrier function with surgical intervention. Neurogastroenterol Motil. 2016;28:639–46. doi: 10.1111/nmo.12757. [DOI] [PMC free article] [PubMed] [Google Scholar]
- 5.Kwiatek MA, Pandolfino JE, Kahrilas PJ. 3D-high-resolution manometry of esophagogastric junction. Neurogastroenterol Motil. 2011;23:e461–9. doi: 10.1111/j.1365-2982.2011.01733.x. [DOI] [PMC free article] [PubMed] [Google Scholar]
- 6.Nicodème F, Lin Z, Pandolfino JE, Kahrilas PJ. Esophagogastric junction pressure morphology: comparison between a station pull-through and real-time 3D-HRM representation. Neurogastroenterol Motil. 2013;25:e591–8. doi: 10.1111/nmo.12168. [DOI] [PMC free article] [PubMed] [Google Scholar]
- 7.Lin Z, Roman S, Pandolfino JE, Kwiatek MA, Kahrilas PJ. Automated calculation of distal contractile integral in esophageal pressure topography (EPT) with a region-growing algorithm. Neurogastroenterol Motil. 2012;24:e4–e10. doi: 10.1111/j.1365-2982.2011.01795.x. [DOI] [PMC free article] [PubMed] [Google Scholar]
- 8.Nicodème F, Pandolfino JE, Lin Z, Xiao Y, Escobar G, Kahrilas PJ. Adding a radial dimension to the assessment of esophagogastric junction relaxation: validation studies of the 3D-eSleeve. Am J Physiol Gastrointest Liver Physiol. 2012;303:G275–G280. doi: 10.1152/ajpgi.00063.2012. [DOI] [PMC free article] [PubMed] [Google Scholar]
- 9.Herregods TVK, Roman S, Kahrilas PJ, Smout AJPM, Bredenoord AJ. Normative values in esophageal high-resolution manometry. Neurogastroenterol Motil. 2015;27:175–87. doi: 10.1111/nmo.12500. [DOI] [PubMed] [Google Scholar]