eLife logoLink to eLife
. 2017 Nov 6;6:e30867. doi: 10.7554/eLife.30867

Cytokinesis in vertebrate cells initiates by contraction of an equatorial actomyosin network composed of randomly oriented filaments

Felix Spira 1, Sara Cuylen-Haering 1,, Shalin Mehta 2,, Matthias Samwer 1, Anne Reversat 3, Amitabh Verma 2, Rudolf Oldenbourg 2, Michael Sixt 3, Daniel W Gerlich 1,
Editor: Mohan K Balasubramanian4
PMCID: PMC5673306  PMID: 29106370

Abstract

The actomyosin ring generates force to ingress the cytokinetic cleavage furrow in animal cells, yet its filament organization and the mechanism of contractility is not well understood. We quantified actin filament order in human cells using fluorescence polarization microscopy and found that cleavage furrow ingression initiates by contraction of an equatorial actin network with randomly oriented filaments. The network subsequently gradually reoriented actin filaments along the cell equator. This strictly depended on myosin II activity, suggesting local network reorganization by mechanical forces. Cortical laser microsurgery revealed that during cytokinesis progression, mechanical tension increased substantially along the direction of the cell equator, while the network contracted laterally along the pole-to-pole axis without a detectable increase in tension. Our data suggest that an asymmetric increase in cortical tension promotes filament reorientation along the cytokinetic cleavage furrow, which might have implications for diverse other biological processes involving actomyosin rings.

Research organism: Human

Introduction

Animal cells divide by contracting the cell cortex in an equatorial zone between the two poles of the mitotic spindle, resulting in the ingression of a cleavage furrow. This is initiated by activation of the small GTPase RhoA at the equatorial cell cortex, which induces polymerization of unbranched actin filaments and activation of non-muscle myosin II (Piekny et al., 2005; Bement et al., 2006). The equatorial zone of actin and myosin enrichment, termed the actomyosin ring, was discovered more than four decades ago (Schroeder, 1968; Schroeder, 1972), yet how its filaments organize to generate contractile force remains poorly understood (Eggert et al., 2006; Green et al., 2012; Fededa and Gerlich, 2012; Cheffings et al., 2016; Wang, 2005).

Electron microscopy revealed that many actin filaments orient along the edge of the cytokinetic cleavage furrow in marine embryos (Schroeder, 1972; Henson et al., 2017) and vertebrate cells (Maupin and Pollard, 1986). This led to the suggestion that the actomyosin ring might contract by anti-parallel filament sliding similar to muscle sarcomeres (Schroeder, 1972). The actin filament alignment during the initiation of furrow ingression, however, appears less prominent (Mabuchi, 1994; Fishkind and Wang, 1993; Noguchi and Mabuchi, 2001; DeBiasio et al., 1996; Fenix et al., 2016) and whether the filament sliding model appropriately describes animal cell cytokinesis has remained under debate (Eggert et al., 2006; Green et al., 2012; Fededa and Gerlich, 2012; Cheffings et al., 2016; Wang, 2005).

In vitro experiments showed that disorganized actomyosin networks can also generate contractile force (Pollard, 1976; Janson et al., 1991; Murrell et al., 2015; Linsmeier et al., 2016; Ennomani et al., 2016), which is explained by the imbalance of tensile over compressive forces that can be transduced by actin filaments (Murrell et al., 2015; Linsmeier et al., 2016; Murrell and Gardel, 2012; Vogel et al., 2013; Lenz et al., 2012; Lenz, 2014). It is therefore possible that the actomyosin ring ingresses by network contraction rather than sliding of anti-parallel filament bundles.

Theoretical models suggest that actin filament alignment during cytokinesis might be a consequence rather than cause of actomyosin contractility (Greenspan, 1977; White and Borisy, 1983; Bray and White, 1988; Zinemanas and Nir, 1988; Verkhovsky et al., 1999; Salbreux et al., 2009; Stachowiak et al., 2014; Dorn et al., 2016; Reymann et al., 2016). In large cells of Caenorhabditis elegans early embryos, actin filament alignment is driven by a myosin-dependent long-range cortical flow that precedes furrow ingression (Reymann et al., 2016). In fission yeast, actin filaments nucleate at discrete loci that interact and contract to align filaments at the cell equator (Stachowiak et al., 2014; Wu et al., 2006; Vavylonis et al., 2008; Kamasaki et al., 2007; Laplante et al., 2016). Dividing vertebrate cells do not have prominent actin nucleation foci and they have less pronounced cortical flow compared to large embryo cells (Cao and Wang, 1990; Murthy and Wadsworth, 2005; Zhou and Wang, 2008). It has thus remained unclear how myosin-mediated contractility contributes to filament organization within the actomyosin ring of vertebrate cells.

The direct visualization of filament orientation within the actomyosin ring is difficult owing to the resolution limit of light microscopes and potential fixation and staining artifacts in electron microscopy. Fluorescence polarization microscopy, however, provides an alternative approach to quantify filament orientation independently of the resolution limit of the microscope, by reporting the net orientation of fluorophore dipoles bound to filaments (DeMay et al., 2011a; McQuilken et al., 2015; Mehta et al., 2016). Fluorescence polarization microscopy indeed revealed septin filament reorientations in the bud neck of Saccharomyces cerevisiae (DeMay et al., 2011b; Vrabioiu and Mitchison, 2006), actin filament anisotropy during cytokinesis of vertebrate cells (Fishkind and Wang, 1993) and Drosophila embryos, (Mavrakis et al., 2014) and dynamic orientation of actin filaments within the lamellipodium of migrating cells (Mehta et al., 2016). While prior fluorescence polarization microscopy analysis showed an increase of actin filament alignment at late stages of cytokinesis in mammalian cells (Fishkind and Wang, 1993), the precise timing and absolute degree of actomyosin network order during cytokinesis, the distribution of forces during cytokinesis progression, and the mechanisms underlying actin filament alignment have remained unclear.

Here, we studied the kinetics of actin filament reorganization during cytokinesis in human cells based on calibrated fluorescence polarization microscopy, using fixed- and live-cell probes. We further measured the cortical tension generated by the actomyosin cortex during different stages of cytokinesis, using laser microsurgery. Our data indicate that cytokinetic cleavage furrow ingression initiates by contraction of a equatorial actomyosin network composed of randomly oriented filaments. The network then partially aligns its filaments by myosin-driven contraction toward the equator, thereby further increasing tension along the cleavage furrow.

Results

Contraction of a randomly oriented actin network initiates cleavage furrow ingression

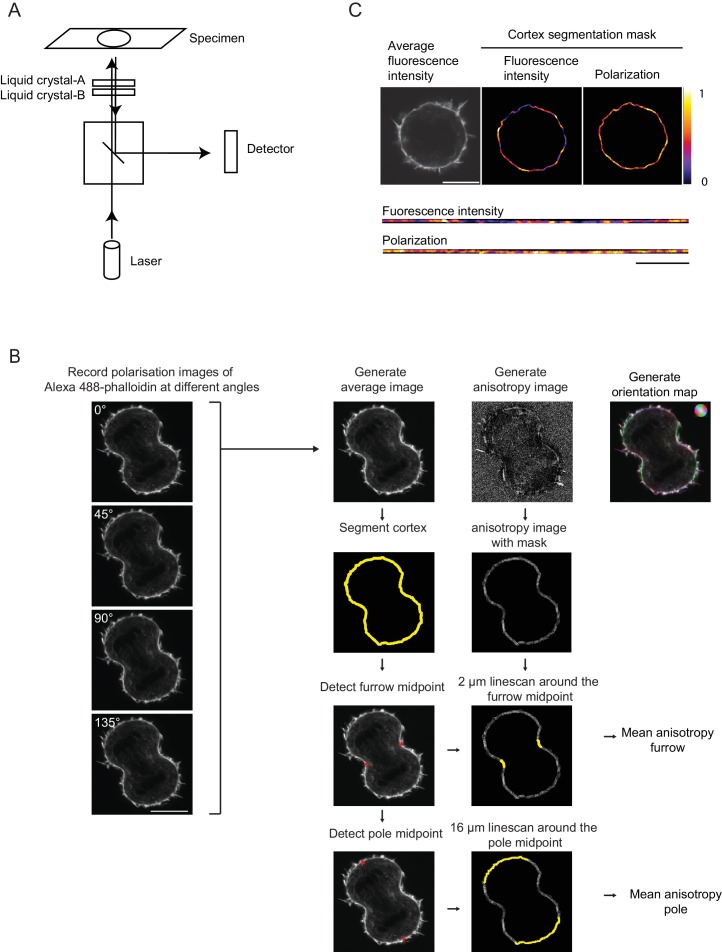
Actin filaments are known to align with the cleavage furrow during late stages of cytokinesis. Yet, it has remained unclear whether actin filament alignment is required for initiation of furrow ingression, as proposed by the canonical ‘purse-string’ model of contractility. To determine the degree of actin filament order in the cortex of dividing cells, we visualized actin filament orientation with phalloidin staining and a custom fluorescence polarization confocal microscopy setup based on a liquid crystal universal compensator (DeMay et al., 2011a) (LC-PolScope). Alexa488-phalloidin was previously shown to bind to F-actin filaments with defined orientation of the fluorophore dipoles (Mehta et al., 2016). The LC-PolScope enables to analyze the orientation of these fluorophores and therefore the orientation of the actin filaments. To this end, the liquid crystal modulates the linear polarization direction of the excitation laser into four different angles (Figure 1—figure supplement 1A). We calibrated the imaging set-up by using samples showing maximal and minimal fluorophore anisotropy and used these calibration measurements to calculate a ‘normalized polarization factor’.

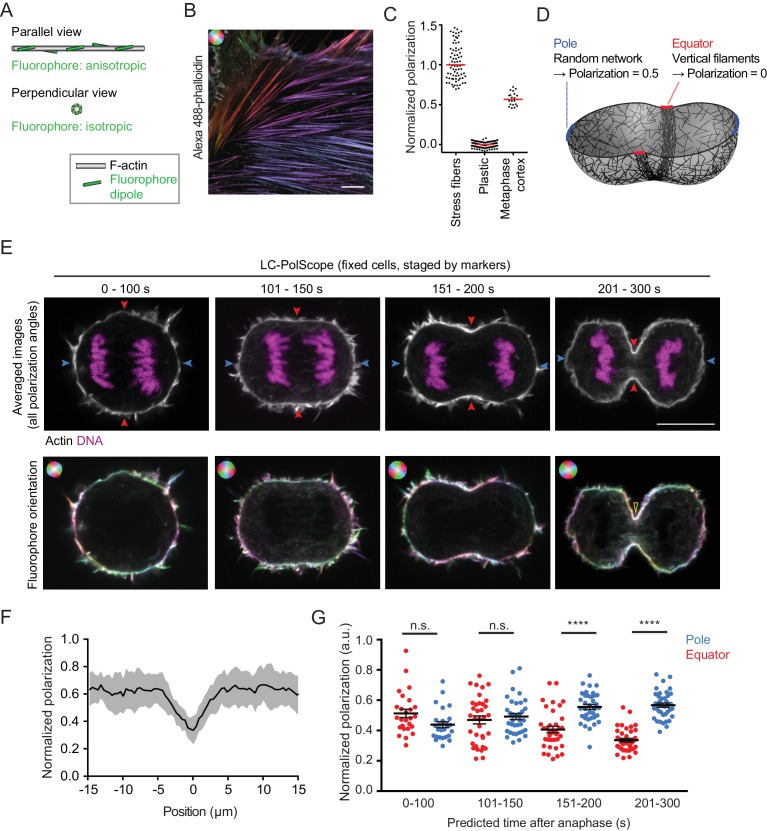
Maximally anisotropic fluorophore orientation is expected for parallel filaments that are aligned with the optical section (Figure 1A ‘parallel view’). We therefore imaged bundles of aligned actin filaments in stress fibers at the bottom surface of interphase human diploid Retinal Pigment Epithelium (hTERT-RPE-1) cells using the confocal LC-PolScope (Figure 1B). As a sample with isotropic fluorescence dipole distribution, we imaged fluorescent plastic (Figure 1C). We then normalized the polarization factor to be in a range between 1 and 0 for maximally aligned fluorophores in stress fibers and randomly oriented fluorophores in plastic, respectively. Together, these data provide a reference scale to quantify fluorophore polarization (Figure 1C) and therefore actin filament orientation.

Figure 1. Cleavage furrow ingression initiates by contraction of a randomly oriented actin filament network, which subsequently gradually aligns at the cell equator.

(A) Schematics of actin filament (grey) and fluorescent dipole orientation (green) relative to the optical section of the microscope. Upper panel shows actin filament parallel to the focal plane of the microscope, lower panel shows an actin filament that is perpendicularly oriented to the focal plane of the microscope. On perpendicularly oriented actin filaments, fluorescent dipoles are oriented point symmetrically in every direction and the ensemble of molecules therefore does not yield a fluorescence anisotropy signal. (B) Fluorescence polarization microscopy of stress fibers in fixed interphase hTERT-RPE-1 cells labeled with Alexa Fluor 488-phalloidin using the LC-PolScope. Color saturation indicates degree of fluorophore alignment (anisotropy), hue indicates mean orientation of fluorescence dipoles as shown in upper left corner. (C) Quantification of polarization normalized to calibration samples: stress fibers as in (B) and fluorescent plastic with random fluorescence dipole orientation. Dots indicate individual measurements, bars indicate median. (D) Geometry and normalized polarization predicted by canonical purse-string model of cytokinesis at the equator (red) or cell poles (blue). (E) Images of Alexa Fluor 488-phalloidin-stained hTERT-RPE-1 cells at representative stages during cytokinesis. Blue and red arrows indicate polar and equatorial positions of quantification regions, respectively (upper panel). Lower panel shows the orientation map of the fluorescent dipole as calculated by the different orientations. Color saturation indicates degree of fluorophore alignment (anisotropy), hue indicates mean orientation of fluorescence dipoles as shown in upper left corner. Yellow arrowhead indicates edge of cleavage furrow. (F) Lateral distribution of polarization factor measured along the cell cortex in central sections of late furrow ingression-stage cells, aligned for the cleavage furrow edge as in (E). Line indicates median, shaded area indicates s.d. of 22 cells. (G) Quantification of normalized polarization as indicated in (E). Dots indicate individual cells (n = 136, mean + s.e.m. of both measurements at opposing cortical cell regions; ****p<0.0001 by Kolmogorov-Smirnov test). Scale bars = 10 µm.

Figure 1.

Figure 1—figure supplement 1. LC-PolScope fluorescence polarization microscopy and analysis pipeline.

Figure 1—figure supplement 1.

(A) Confocal LC-PolScope employs liquid crystal-based universal compensator for modifying the linear polarization state of the excitation laser. This setup allows exciting the fluorophores in the sample with polarized laser light in four different angles. Schematic of the beam path of LSM780, the position of the liquid crystal is indicated. (B) Acquisition and analysis pipeline of LC-PolScope data. Four images were sequentially recorded whereby the linearly polarized excitation laser light was reoriented into four different angles as indicated. These images enable to calculate an ‘average image’ of the fluorophore localization and an ‘anisotropy image’ that contains information about the net fluorophore orientation in each pixel. These information can be visualized in a merged image, in which the brightness indicates overall fluorescence intensity, color saturation indicates the degree of fluorophore alignment (anisotropy), and hue indicates mean orientation of fluorescence dipoles as shown in upper left corner. The cell cortex was then segmented based on the ‘average image’ and the furrow midpoints and pole midpoints were determined. The cortex segmentation was then transferred to the ‘anisotropy image’ and analysis regions along the cortex were determined based on the furrow midpoints and the pole midpoints, respectively. Only these indicated sub-region of the entire segmentation mask (yellow regions overlaying ‘anisotropy image’) were used for quantification. (C) Distribution of average fluorescence intensity and normalized polarization factor along the contour of the segmented cell cortex of an early anaphase cell (same cell as shown for 0–100 s in Figure 1E). Upper panels indicate original images and segmented cortex regions, lower panels indicate the straightened cortex contours from the same images. Scale bar = 10 µm.
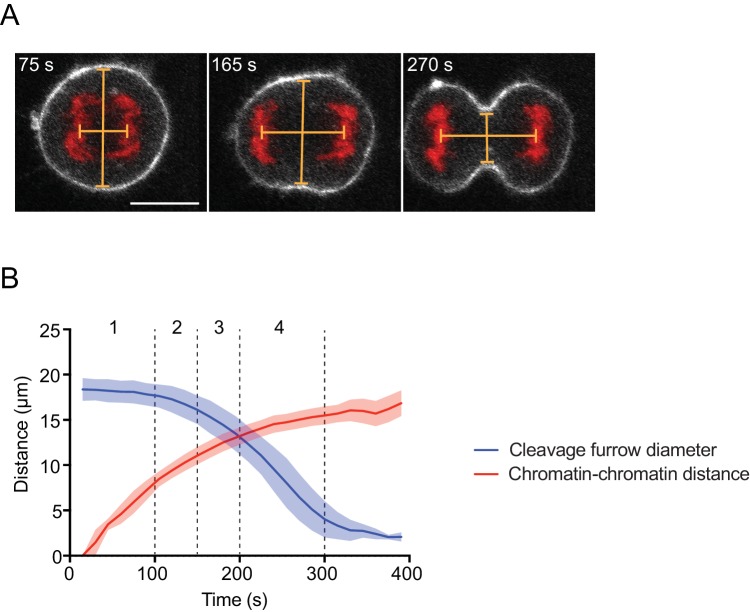
Figure 1—figure supplement 2. Regression model to determine cytokinesis timing in fixed cells.

Figure 1—figure supplement 2.

(A) Cytokinesis staging by measurement of the distance between center points of segregating chromosome masses and cleavage furrow diameter. Lines indicate measured distances. Live hTERT-RPE-1 cells stably expressing H2B-mRFP and stained with SiR-actin were recorded as time-lapse movies, (B) quantified and binned into four bins. Line indicates mean and shaded area indicates s.d. of n = 14 cells. Scale bar = 10 µm.

We next investigated actin filament organization in mitotic cells. The actin cortex underlying the plasma membrane of mitotic cells is relatively thin (Chugh et al., 2017), which might confine actin filaments into a flat network. If actin filaments in the mitotic cell cortex were oriented randomly in the plane along the cell surface, then a confocal optical section of the LC-PolScope through the center of a metaphase cell should capture a mixed population of actin filaments with angles ranging in between parallel to the cell surface and optical plane (Figure 1A ‘parallel view’) and perpendicular to the optical plane (Figure 1A ‘perpendicular view’). As each camera image pixel records signal from many fluorophores, this should yield a normalized polarization factor close to 0.5 along the metaphase cell cortex. To test this, we recorded central optical sections of Alexa488-phalloidin-stained metaphase cells, segmented the cortex by using an image contour that excluded filopodia (Figure 1—figure supplement 1B,C), measured the fluorophore anisotropy and normalized it to the reference scale described above. The detected normalized polarization factor of 0.57 ± 0.09 (Figure 1C; median ±s.d., as for all following measurements) was indeed close to the value expected for a thin isotropic actin network in metaphase cells, indicating that the confocal LC-PolScope is suitable for quantitative analysis of degree of filament order within actin networks.

We then investigated how the cortical actin network reorganizes when cells proceed from metaphase to anaphase. The canonical ‘purse-string’ model of cytokinesis (Schroeder, 1972) proposes that actin filaments align along the cell equator to drive furrow ingression by anti-parallel sliding (Figure 1D). As these filaments would orient perpendicular to the confocal optical section, this should result in a decrease of the normalized polarization factor at the equator, while the randomly oriented network at the poles should maintain values similar to metaphase cells (Figure 1D). To test this, we quantified the orientation of cortical actin filaments during progression from metaphase into anaphase and furrow ingression. We recorded polarized fluorescence images of fixed hTERT-RPE-1 cells stained with Alexa488-phalloidin and 4′,6-Diamidin-2-phenylindol (DAPI) as a reference DNA dye, and binned cells according to cell cycle progression based on cleavage furrow diameter and chromosome-chromosome distance (Figure 1E and Figure 1—figure supplement 2A and B). At late stages of cytokinesis, we indeed observed a pronounced reduction of the normalized polarization factor at the cell equator (Figures 1E, 201–300 s, cortex area with low-color saturation; quantification in 1F), consistent with preferential orientation of actin filaments along the cell equator. The reduction of the normalized polarization factor at the cell equator cannot be attributed to the higher levels of mean Alexa488-phalloidin fluorescence, as fluctuations of mean fluorescence along the cell cortex did not correlate with the degree of polarization at early cytokinesis (Figure 1—figure supplement 1C). Our setup can therefore detect the equatorial actin network reorganization that was previously described during late stages of cytokinesis (Fishkind and Wang, 1993).

We then asked how cortical actin network orientation correlates with changes of cell geometry during anaphase. Following the onset of chromosome segregation in an almost spherical cell, anaphase cells start to ingress a cleavage furrow after 101–150 s, visible as a curvature reduction at the equator (Figure 1E). At these early furrow ingression states, the normalized polarization factor was indistinguishable between equator and pole (Figure 1G). Only at later furrow ingression states (151–300 s), the normalized polarization factor at the cleavage furrow decreased significantly compared to the pole and the initial metaphase values (Figure 1G). We also noticed a small increase of normalized polarization factor at the poles during late stages of cytokinesis, which might reflect cortical reorganization when cells reattach to the glass substratum during mitotic exit. The polarization measurements varied quite substantially between individual cells, yet owing to the relatively large sample sizes, we obtained accurate estimates of the mean for each of the respective stages and cellular positions (s.e.m. ranging between 0.01 and 0.03, Figure 1G). Overall, these observations indicate that the orientation of actin filaments in the equatorial network driving initial stages of constriction is indistinguishable from the random orientation observed in the cortex of metaphase cells.

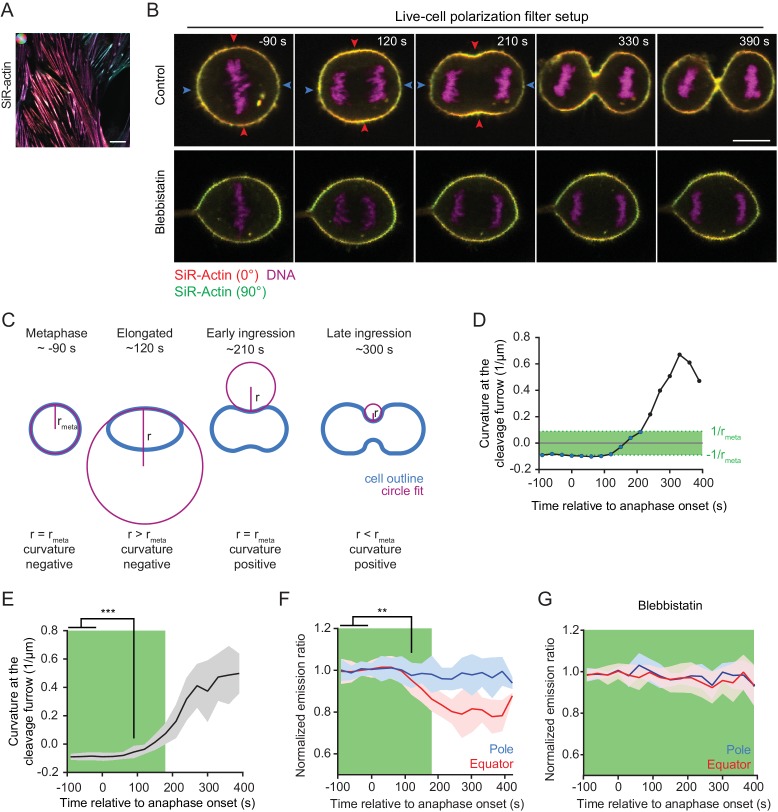
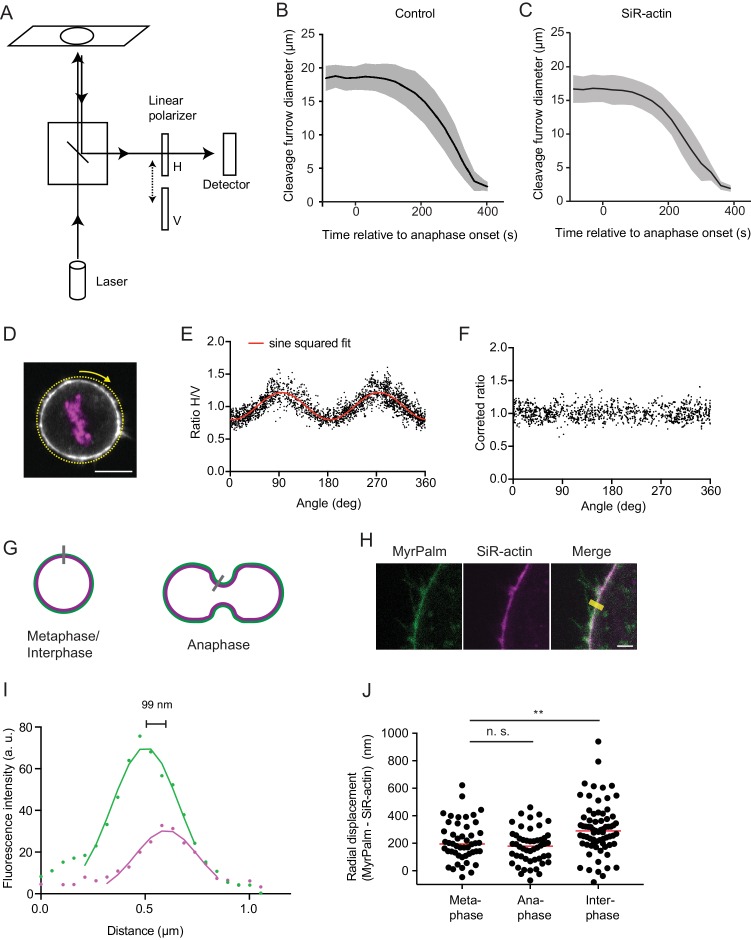
We next aimed to resolve the dynamics of actin network reorganization during cytokinesis with higher temporal resolution in living cells. Fluorescent phalloidin cannot be used for this purpose, as it does not passage the plasma membrane and is known to be highly toxic. We thus tested a silicone rhodamine-coupled jasplakinolide derivate, SiR-actin, which is a plasma membrane-permeant, fluorogenic actin marker that has low toxicity (Lukinavičius et al., 2014). SiR-actin indeed generated a strong polarization-dependent signal on stress fibers of live hTERT-RPE-1 cells (Figure 2A), and it did not impair the efficiency and rate of cleavage furrow ingression at the concentration used for imaging (Figure 2—figure supplement 2B and C). We therefore used SiR-actin to probe actin filament orientations in live cells progressing through cytokinesis.

Figure 2. Quantification of actin reorganization by live-cell confocal polarization microscopy.

(A) Fluorescence polarization microscopy of stress fibers in live interphase hTERT-RPE-1 cells labeled with SiR-actin using the LC-PolScope. Color saturation indicates degree of fluorophore alignment (anisotropy), hue indicates mean orientation of fluorescence dipoles as shown in upper left corner. (B) Fluorescence polarization microscopy of live hTERT-RPE-1 cells stably expressing H2B-mRFP (magenta), stained with SiR-actin (overlay of red and green) at representative stages during cytokinesis. Images were acquired with horizontal (red) and vertical (green) linear polarizers in the emission beam path. Untreated cells (upper panel) and cells treated with 50 µm para-nitroblebbistatin (lower panel) are shown. (C) Schematic drawing of the circular fit procedure during cell division. Circles (magenta) were fitted to the center of the equator (blue). (D) Curvature of the equatorial cell cortex in a representative cell. Dots indicate individual time points. Time = 0 s at anaphase onset. (E) Quantification of equatorial cortex curvature in 18 dividing cells. Line indicates mean, gray area s.d.. The first time point with significantly changed curvature was detected at 90 s after anaphase onset by two-tailed t-test; ***p<0.001. (F) Quantification of SiR-actin normalized emission ratio in the 18 dividing cells used for the analysis in (E) (line indicates mean, blue and red areas s.d. **p<0.01 by two-tailed t-test (G) Quantification of SiR-actin normalized emission ratio in dividing cells treated with 50 µm para-nitroblebbistatin. Time = 0 s at anaphase onset (lines indicate median, shaded areas indicate s.d.; equatorial measurement: n = 15 cells, polar: n = 11 cells). (D-G) The green area indicates time points where the absolute value of cortical curvature was equal or below that of the metaphase cell. Only these time points were used for further interpretation of fluorescence anisotropy measurements, to avoid potential artifacts by geometry effects. Scale bars = 10 µm.

Figure 2.

Figure 2—figure supplement 1. Polarization microscopy with linear polarizers in the emission beam path.

Figure 2—figure supplement 1.

(A) Confocal fluorescence polarization microscope setup used for live-cell imaging. A linearly polarized excitation laser that was aligned with the X-axis of the optical table, and two perpendicularly oriented polarization filters, horizontal (H) and vertical (V) relative to the optical table, respectively, were used. (B) Cleavage furrow ingression measured in hTERT-RPE-1 cells expressing MyrPalm-mEGFP to visualize the plasma membrane (in absence of SiR-actin), line indicates mean, shaded area indicates s.d. of 8 cells. Anaphase onset = 0 s. (C) Cleavage furrow ingression measured in hTERT-RPE-1 cells stained with SiR-actin, line indicates mean, shaded area indicates s.d. of 18 cells. Anaphase onset = 0 s. (D–F) Analysis of geometry effect caused by linear polarized excitation light (see Materials and methods) on the ratio image. (D) Confocal image of a live metaphase hTERT-RPE-1 cell stained with SiR-actin, stably expressing H2B-mRFP. Yellow dashed line indicates line scan measurement region and arrow indicates measurement direction. (E) Quantification of (D), ratio between horizontal (H) and vertical (V) linear emission polarization filter was calculated for each pixel and plotted against the respective tangential angle. Because fluorescent dipoles are excited with linear polarized laser light, the ratio between horizontal and vertical emission channels of a randomly oriented network (as a metaphase cell cortex) depends on the angle relative to the excitation light. This effect can be described by a squared sine regression model (indicated by red curve). (F) Each pixel of the ratio image of the metaphase cortex was divided by the respective value derived from evaluating the regression model developed in (E) using the tangential angle for a given pixel as input parameter. (G) Schematic showing cortex thickness measurement assay. Membrane marker (green), actin marker (magenta), and measurement region (grey line). (H) Representative images of live hTERT-RPE-1 metaphase cell stably expressing MyrPalm-EGFP, actin was stained with SiR-actin. Solid yellow line indicates measurement area. (I) Quantification of (H) by fitting Gaussian functions to the line scans of each color channel as shown in (H), drawn in the direction from the cell interior to the extracellular space. The displacement between the Gaussian maximum positions was used to calculate the half-width of cortical thickness. (J) Quantification of cortex thickness based on the displacement of MyrPalm-EGFP and SiR-actin as shown in (H, I), for metaphase, anaphase and interphase cells. Each dot represents a single cell (metaphase: n = 48, anaphase: n = 50, interphase: n = 71), line indicates median. (**p<0.026 by Mann-Whitney test). Scale bar for (D) is 10 µm and for (H) is 2 µm.
Figure 2—figure supplement 2. Analysis pipeline of live-cell polarization microscopy.

Figure 2—figure supplement 2.

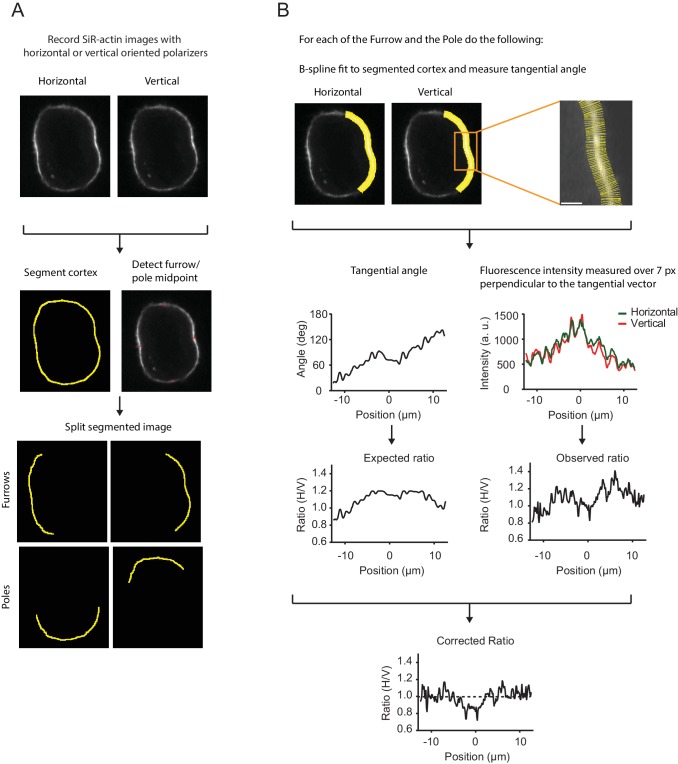
(A) Analysis pipeline for a representative live hTERT-RPE-1 cell stained with SiR-actin recorded with the confocal fluorescence polarization microscope setup. Cells were recorded with horizontal and vertical polarization emission filters. The cell cortex was segmented and furrow and pole midpoints were determined to generate separate measurement regions of each point. (B) To correct for the geometry effects caused by polarized excitation light, the pixel orientation of every pixel along the segmented contour was measured. Pixel orientation along the cortex was inferred by fitting a B-spline to the segmented contour. We then averaged a seven-pixel region perpendicular to the central pixel to capture both channel with a single mask. Yellow rods mark the averaged area, a seven-pixel region perpendicular to the tangential vector of the central pixel of the spline using the segmented cortex as the central pixel (red dot). The angle for each pixel was used to evaluate the squared sine regression model as described in Figure 2—figure supplement 1D–F. The regression model was developed for each cell independently and based on multiple pre-anaphase frames. Evaluation of the regression model using actual pixel orientation as input parameters resulted in the expected fluorescence ratio and is shown together with the actual fluorescence ratio measured for each pixel. The observed ratio for every pixel for every furrow/pole measurement region was divided by the expected ratio resulting in the corrected ratio. Dashed line indicates ratio of 1 indicating an isotropic dipole orientation and a random oriented network. Scale bars = 10 µm (A) and 2 µm (B).
Figure 2—figure supplement 3. Cortex organization in para-nitroblebbistatin-treated anaphase cells and lateral distribution of actin and myosin in untreated cells.

Figure 2—figure supplement 3.

(A) Diameter at equatorial position measured in hTERT-RPE-1 cells expressing H2B-mRFP 
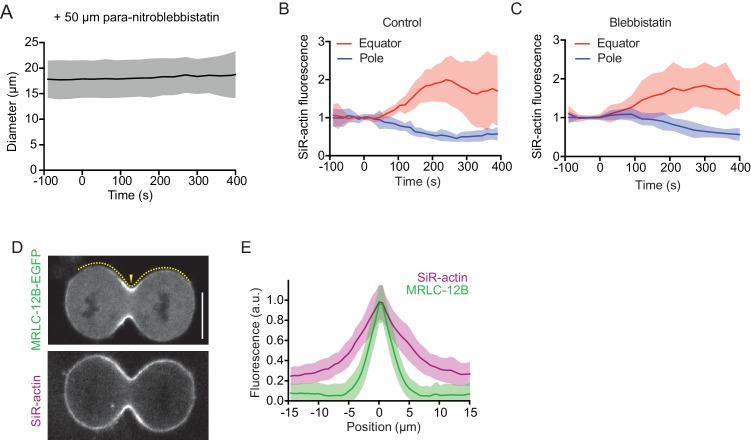
and stained with SiR-actin, in presence of 50 µM para-nitroblebbistatin, an inhibitor of myosin II. Line indicates mean, shaded area indicates s.d. of 10 cells. Anaphase onset = 0 s. (B, C) Quantification of SiR-actin fluorescence at cell poles and equator as illustrated for untreated and para-nitroblebbistatin treated cell in Figure 2B. Anaphase onset = 0 s (D) Confocal image of live hTERT-RPE-1 cell expressing non-muscle myosin IIc-EGFP (MLC-12B-EGFP), stained with SiR-actin. Dashed line indicates measurement region for line profiles, arrowhead indicates cell equator position. (E) Quantification of lateral distribution of MLC-12B-EGFP and actin filaments at late furrow ingression stage as in (D); lines represent mean fluorescence in cortical line profiles centred to the cell equator (position = 0 μm), shaded areas represent s.d.; n = 37 cells. Scale bars = 10 µm.

The relatively slow image acquisition rate with the LC-PolScope (~20 s per frame) leads to motion artifacts when imaging fast-moving structures like the cytokinetic cleavage furrow. We hence used a complementary microscopy setup for live-cell analysis of cytokinesis, with two perpendicularly oriented linear polarization filters positioned in the fluorescence emission light path (Figure 2—figure supplement 1AFigure 2B). This live-cell setup yields a fluorophore emission ratio image that reports on relative changes of fluorophore anisotropy over time. We normalized the fluorophore emission ratio to metaphase as a reference time point (normalized emission ratio) and then studied relative changes during anaphase progression.

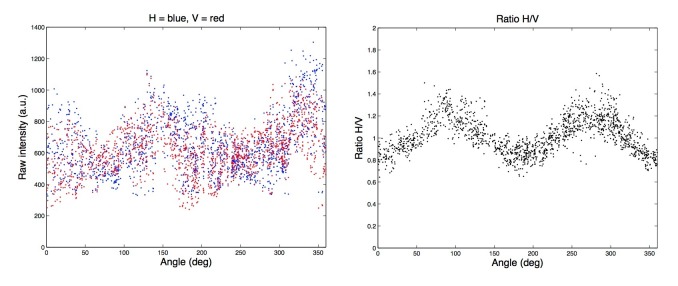
The live-cell setup uses only two perpendicular polarization filter angles to calculate the fluorescence emission ratio, which precludes the detection of anisotropy at angles close to 45° and 135° relative to the axes of the polarization filters. Furthermore, fluorescence emission ratio measurements are affected by cell geometry. This is illustrated by images of metaphase cortices, which show that the fluorophore emission ratio along the cell cortex follows a sine squared function (Figure 2—figure supplements 1D,E). We implemented a procedure to correct for such geometry effects (Figure 2—figure supplement 1F, see Materials and methods). To minimize the effect of cell geometries, we imaged cells that had their spindle axis aligned with the optical table (90°±20° relative to the X-axis of the optical table) and considered only time points in which the absolute furrow cortex curvature did not exceed that of metaphase cells. For this, we measured cortex curvature by fitting circles to the equatorial cell cortex (Figure 2C). We then determined the time window in which the absolute value of inward curvature was not higher than the absolute value of outward curvature at metaphase (Figure 2C ‘metaphase’ – ‘early ingression’ and Figure 2D–F, green areas). We selected only these time points for further analysis of fluorescence anisotropy, thereby comparing states with matching cortex orientations.

We then asked whether actin filament alignment with the cleavage furrow precedes cleavage furrow ingression, or whether it occurs only after ingression onset in living cells. To determine the onset of cleavage furrow ingression, we compared the equatorial cortex curvatures at different time points of anaphase with the curvatures of the equatorial metaphase cortex. We detected significant inward-directed curvature changes at 90 s post anaphase onset (Figure 2E; n = 18 movies). Quantification of the equatorial emission ratio of SiR-actin in the same data set revealed significant changes only at 120 s after anaphase onset (Figure 2F and Figure 2—figure supplement 2A and B). Thus, furrow initiation precedes detectable changes in equatorial actin network orientation in vertebrate cells.

Our normalized emission ratio measurements during cytokinesis progression might be affected by changing thickness of the actin cortex. We therefore measured the thickness of the SiR-actin-labeled cell cortex, using a plasma membrane marker as reference (Figure 2—figure supplement 1G–J). We found that the actin cortex in metaphase cells is thinner than in interphase cells, consistent with prior findings (Chugh et al., 2017). Importantly, however, we did not detect a significant difference between the thickness of the equatorial cortex of metaphase and anaphase cells (Figure 2—figure supplement 1J), indicating that equatorial actin accumulations in anaphase cells must be due to increased local filament density. The equatorial fluorescence anisotropy changes detected during cytokinesis progression hence cannot be attributed to cortical thickening.

Equatorial actin filament reorientation depends on myosin II activity

Actin filament alignment at the cell equator might result from spatially confined polymerization or from motor-driven filament reorientation. To investigate this, we tested whether myosin activity is required to reorient equatorial actin filaments during anaphase. Blebbistatin is a specific inhibitor of non-muscle myosin II that suppresses cleavage furrow ingression but does not prevent accumulation of actin and myosin II at the equatorial cell cortex (Zhou and Wang, 2008; Straight et al., 2003). Para-nitroblebbistatin is a more photostable version of this inhibitor (Képiró et al., 2014), and it completely suppressed cleavage furrow ingression in hTERT-RPE-1 cells (Figure 2B, ‘Blebbistatin’ and Figure 2—figure supplement 3A). Actin filament accumulation at the cell equator was not affected in blebbistatin-treated cells (Figure 2—figure supplement 3B and C), yet emission ratio changes of SiR-actin at the equator were completely suppressed. (Figure 2G). Thus, myosin II activity is not required for equatorial actin filament accumulation but is essential for filament reorientation along the cell circumference.

Given that equatorial actin network reorientation depended on myosin II activity, we investigated whether the local concentration of myosin II correlates with the degree of actin filament alignment. To test this, we imaged live hTERT-RPE-1 cells stably expressing regulatory myosin light chain 12B tagged with EGFP (MLC-12B-EGFP), counterstained with SiR-actin. Myosin II enriched at the cell cortex along a gradient that peaked at the cleavage furrow, with a full width at half maximum of 4.3 ± 0.9 µm (Figure 2—figure supplement 3D and E). This distribution closely matched the lateral distribution of anisotropy within the actin network (4.4 ± 1.5 μm, see Figure 1F). The peak of SiR-actin fluorescence also localized to the cell equator, but the distribution was substantially broader, with a full width at half maximum of 8.4 ± 1.8 μm (Figure 2—figure supplement 3D and E). This is consistent with small-scale organization within the actomyosin ring, where pronounced myosin II clusters also do not locally enrich actin to the same extent (Wollrab et al., 2016). Together, our data indicate that equatorial accumulation and reorientation of actin filaments within the cortex are distinctly regulated, supporting a model of myosin-mediated actin network reorganization.

Equatorial actin filaments reorient on planar cortex regions

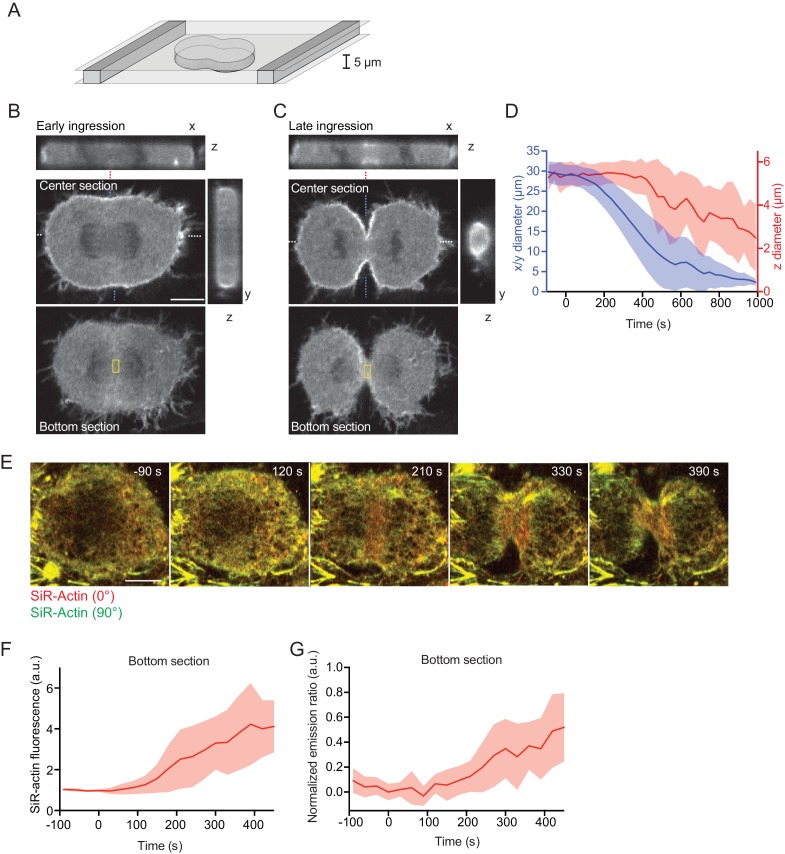
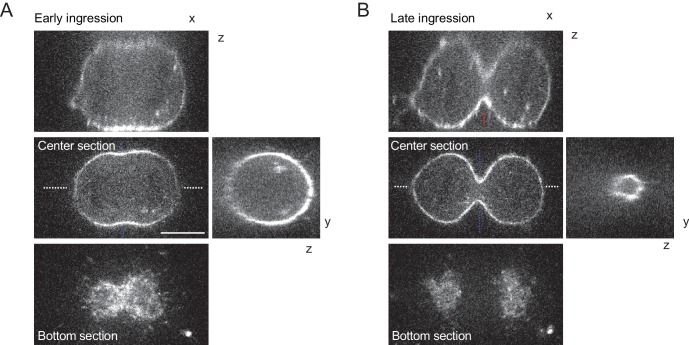
To study the mechanism underlying initial cleavage furrow ingression in more detail, we aimed to visualize the rearranging actin network in a single, high-resolution optical plane. A key limitation is the curved geometry of the cleavage furrow, which leads to detachment of the cell cortex from the supporting coverslip (Figure 3—figure supplement 1A and B). Owing to the relatively fast furrow ingression and the inherently low optical resolution of confocal microscopes along the z-axis, it is difficult to reconstruct the network rearrangements from 3-D time-lapse microscopy data. We therefore confined cells in microchambers (Liu et al., 2015) to locally suppress cortex detachment during anaphase (Figure 3A). Confined cells formed a cleavage furrow in the x-y optical plane (Figure 3B–D) but were substantially delayed toward ingression along the z-axis (Figure 3D). We next imaged live cells in confinement microchambers stained with SiR-actin and measured network reorganization. Actin filaments accumulated at the cell equator at about 90 s after anaphase onset (Figure 3E and F), and SiR-actin normalized emission ratio measurements began to increase at about 120 s after anaphase onset (Figure 3E and G). Note that in this imaging setup that analyzes actin filaments parallel to the optical plane, filament alignment leads to an increase of the normalized emission ratio (see also Figure 1A). Our confinement setup therefore enables to analyze actin network reorganization with higher spatial resolution.

Figure 3. Equatorial actin filaments align on planar surfaces of confined cells.

(A) Schematics of cell confinement chamber used to enforce flat geometry of top- and bottom cell cortex during cytokinesis. (B, C) Confocal 3-D images of live hTERT-RPE-1 cells stably expressing LifeAct-mCherry at (B) early or (C) late furrow ingression stages. The x/z and y/z sections are at positions as indicated by blue or white dashed lines, respectively. Dashed red lines indicate measurement region for furrow ingression along z. Yellow boxes indicate measurement regions for (F, G). (D) Quantification of cleavage furrow ingression in confined cells as in (A–C) along x/y and z directions. Lines indicate median, shaded areas s.d. of n = 14 cells. (E) Fluorescence polarization microscopy of the bottom section of live hTERT-RPE-1 cell stably expressing H2B-mRFP, stained with SiR-actin under confinement. Images were acquired with horizontal (red) and vertical (green) linear polarizers in the emission beam path. (F) Quantification of SiR-actin fluorescence intensity at the cell equator at the bottom surface of confined cells. (G) Quantification of SiR-actin normalized emission ratio at the cell equator at the bottom surface of confined cells. Lines indicate median, shaded areas s.d. of n = 10 cells. Scale bars = 10 µm.

Figure 3.

Figure 3—figure supplement 1. 3D-imaging of cleavage furrow ingression in unconfined cells.

Figure 3—figure supplement 1.

(A, B) Confocal 3-D images of live hTERT-RPE-1 cells stained with SiR-actin at early (A) and late (B) furrow ingression stages. The x/z and y/z sections are at positions as indicated by blue or white dashed lines, respectively. Dashed red lines indicate measurement region for furrow ingression along z. Scale bar = 10 µm.

Cortical tension is highly directional at the cell equator

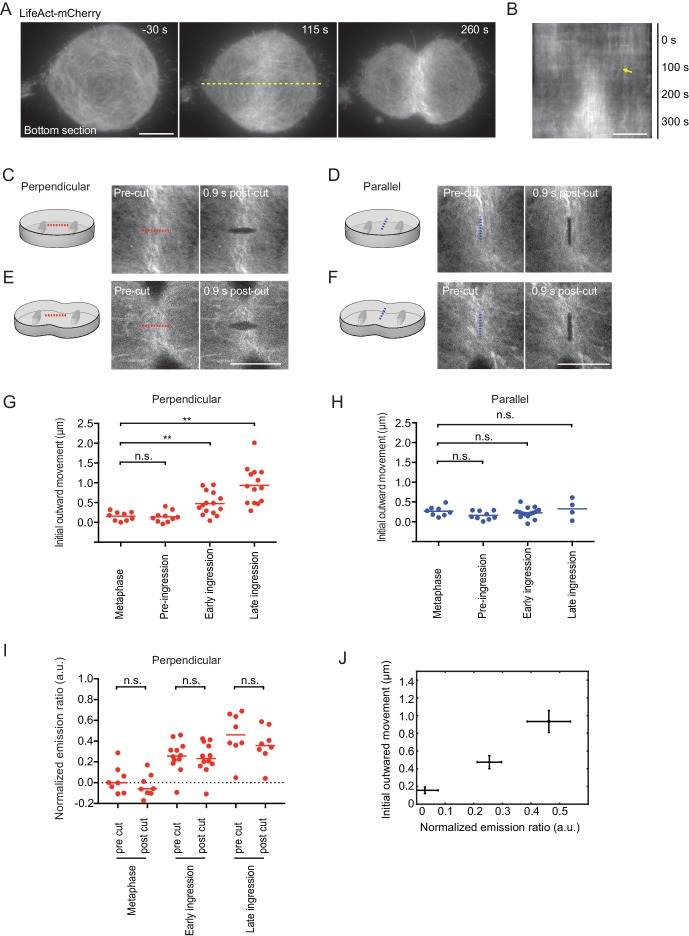
We then aimed to visualize and locally manipulate the equatorial actin filaments with high spatio-temporal resolution during cytokinesis. We imaged dividing cells stably expressing LifeAct-mCherry in confinement microchambers using a total internal reflection fluorescence microscope. LifeAct-mCherry accumulated at the cell equator and formed thick actin bundles that progressively aligned with the cleavage furrow during cytokinesis progression (Figure 4A and Video 1). Concomitant with the equatorial accumulation of LifeAct-mCherry, we observed a minimal lateral displacement of cortical actin filaments toward the equator (Figure 4B). This argues against a strong contribution of ‘cortical flow’ of actin filaments in the equatorial actin enrichment and rather indicates that most actin filaments polymerize locally at the equator of somatic human cells.

Figure 4. Laser microsurgery reveals cortical tension orientation during cytokinesis.

(A) Total internal reflection fluorescence (TIRF) microscopy of hTERT-RPE-1 under confinement stably expressing LifeAct-mCherry. Representative images of n = 11 cells. Time = 0 s at anaphase onset, as determined in phase contrast images of the same cell. Dashed yellow line indicates position of kymograph shown in (B), whereby yellow arrow indicates onset of lateral cortex displacement toward equator. (C-F) Laser microsurgery in live hTERT-RPE-1 cells grown in confinement microchambers, at different stages and orientations as illustrated in the schematics. Cells stably expressing LifeAct-mCherry were cut at their bottom actin cortex along a 5 μm linear path using a pulsed 915 nm laser as indicated by the dashed lines. Red indicates cutting perpendicular to the cell equator circumference, blue indicates parallel cutting orientation. (G) Quantification of cortex tension based on the initial cortical outward movement within 0.9 s after laser cutting perpendicular to the cell equator, for different mitotic stages as indicated. Dots represent individual cells, bars indicate median (metaphase: n = 9, pre-ingression: n = 10, early ingression: n = 15, late ingression: n = 14). (H) Cortical tension quantification for laser cutting parallel to the cell equator (metaphase: n = 8, pre-ingression: n = 9, early ingression: n = 15, late ingression: n = 4). (I) Laser microsurgery as in (C-F), but combined with fluorescence polarization microscopy. Dots represent mean normalized emission ratio values in individual cells measured adjacent to the cutting region before and after laser cutting (metaphase: n = 8, early-ingression: n = 12, late ingression: n = 8; **p<0.0021, n.s. >0.05 by MannWhitney-U test). (J) The increase in initial outward movement in perpendicular cutting experiments (G) correlates with an increase in normalized emission ratio (I). Dots represent mean, bars represent s.e.m. (normalized emission ratio, metaphase = 8, early ingression = 12, late ingression = 8; Initial outward movement, metaphase = 9, early ingression = 15, late ingression = 14). Scale bars = 10 µm.

Figure 4.

Figure 4—figure supplement 1. Analysis of laser cutting experiments.

Figure 4—figure supplement 1.

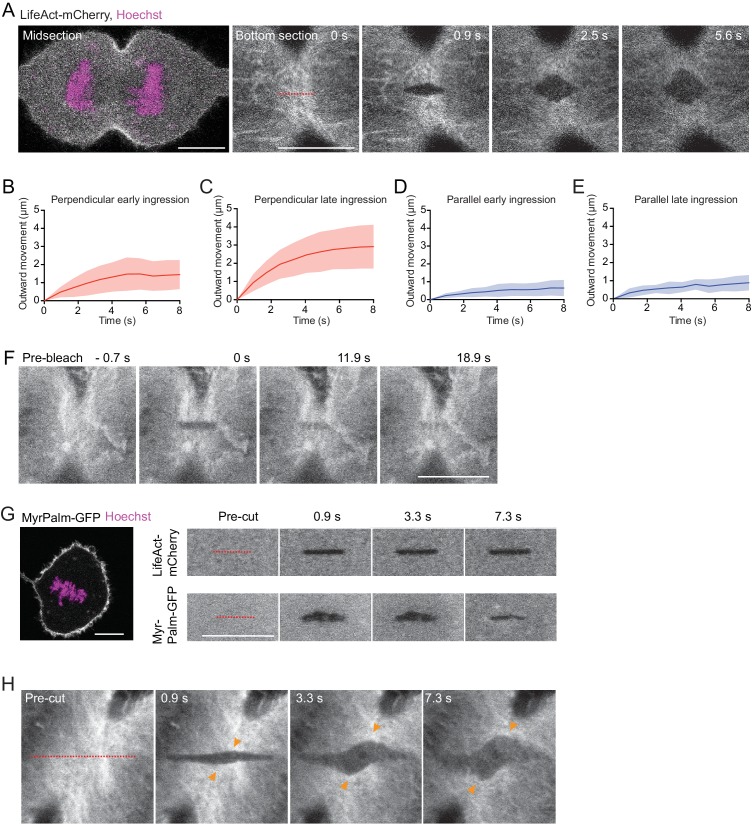
(A) Laser cutting of an hTERT-RPE-1 cell stably expressing LifeAct-mCherry (grey) stained with Hoechst (magenta), cultured in a confinement chamber. Dashed line indicates site of cutting with a pulsed 915 nm laser, which was performed at bottom sections. (B–D) Quantification of cortical outward movement after laser cutting perpendicular (B, C) and parallel (D, E) to cell equator for cytokinesis stages as indicated. Lines indicate mean and shaded areas indicate s.d. Early ingression perpendicular: n = 15, late ingression perpendicular: n = 14, early ingression parallel: n = 15, late ingression parallel: n = 4. (F) Photobleaching with a 488 nm excitation laser on actin-EGFP in an anaphase hTERT-RPE1 cell shows homogeneous recovery in the bleached area without lateral cortical displacement. n = 12 cells. (G) Laser cutting of a metaphase hTERT-RPE-1 cell expressing LifeAct-mCherry and Myr-Palm-GFP. Left shows overview image at a central optical section. Right shows laser microsurgery at the bottom surface, indicating that both actin cortex and plasma membrane are cut. n = 8. (H) Laser cutting as in (A), but with a longer cutting path (dashed red line) oriented at approximately 45° relative to the cleavage furrow. n = 11 cells, of which 10 showed diagonal cortex displacement. Scale bars, 10 µm.

Video 1. TIRF microscopy of hTERT-RPE-1 expressing LifeAct-mCherry under confinement stably.

Download video file (591.3KB, mp4)
DOI: 10.7554/eLife.30867.013

Time = 0 s at anaphase onset, as determined in phase contrast images of the same cell. Video shows same cell as Figure 4A,B.

We next investigated the mechanical tension generated by the actomyosin ring by local cortical laser microsurgery (Mayer et al., 2010). We used a pulsed high-energy laser to cut the equatorial cell cortex along a linear path of 5 μm (Figure 4C–F). The cortex regions adjacent to the laser cut subsequently rapidly moved outwards (Figure 4—figure supplement 1A–E), whereby the cortical displacement speed followed an exponential function that is characteristic for a viscoelastic response (Wottawah et al., 2005). Under this regime, the initial outward movement of the displaced cortex is proportional to cortical tension (Mayer et al., 2010). To test whether the pulsed laser indeed cut the cortex, we performed control photobleaching experiments using a conventional excitation laser. Photobleached Actin-EGFP homogeneously recovered in the bleached cortex area without lateral outward movement (Figure 4—figure supplement 1F), validating that the pulsed laser indeed specifically cut the actin cortex. Imaging the plasma membrane marker Myr-Palm-GFP further showed that the pulsed laser cut both the actin cortex as well the plasma membrane (Figure 4—figure supplement 1G). Time-lapse microscopy showed that following the rapid cortical displacement after laser cutting, most cells repaired the cell cortex and resumed furrow ingression to completion (8 out of 12 cells within 10 min; 2 cells stopped furrow ingression and 2 cells died). Overall, these experiments validate the use of intracellular laser microsurgery to measure cortical tension in mitotic hTERT-RPE1 cells.

We then analyzed cortical tension at the cell equator at different stages of cytokinesis. In metaphase cells, the initial outward movement, and therefore the cortical tension along the direction of the cell equator, was approximately equal to the tension along the pole-to-pole axis (Figure 4G and H). During early anaphase at pre-furrow ingression stages, cortical tension was similar as in metaphase, but it increased significantly along the direction of the cell equator once the cleavage furrow had begun to ingress (Figure 4G and H). During late furrow ingression stages, cortical tension further increased along the direction of the cell equator. Along the pole-to-pole axis, however, cortical tension remained as low as in metaphase during all stages of cytokinesis (Figure 4G and H). Cutting along a path oriented 45° relative to the cell equator resulted in a diagonal displacement of the cortex with most pronounced movement along direction of the cell equator (Figure 4—figure supplement 1H). Together, these data show that the contractility of the actomyosin ring generates cortical tension predominantly along the direction of the cell equator.

Finally, we investigated whether maintenance of the equatorial actin filament alignment requires persistent mechanical tension. We therefore quantified equatorial actin filament alignment before and after cortical laser cutting by fluorescence polarization microscopy. We detected a randomly organized actin network at the bottom surface of confined metaphase cells that became increasingly more aligned at later stages of cytokinesis (Figure 4I), correlating with an increase in cortical tension along the cell equator (Figure 4J). We then laser-cut the actin network perpendicular to the cell equator and measured fluorescence polarization adjacent to the cut region. Importantly, we did not detect significant fluorescence polarization changes induced by laser-cutting at any of the measured cell cycle stages (Figure 4I). Thus, maintenance of equatorial actin filament alignment does not require persistent tension.

Discussion

Prior fluorescence polarization microscopy had shown preferential orientation of actin filaments along the cytokinetic cleavage furrow of vertebrate cells (Fishkind and Wang, 1993). However, the absolute degree of filament alignment had not been determined and whether alignment precedes furrow formation, as posited by the canonical anti-parallel filament sliding model, had remained unclear. Our study shows that the initial phase of cleavage furrow ingression is mediated by equatorial contraction of a disordered actomyosin network and that the degree of actin filament alignment within the equatorial cell cortex remains relatively low throughout all stages of furrow ingression, compared to structures like stress fibers or muscle sarcomeres. The late onset and low degree of actin filament alignment within the equatorial cortex suggests a network contraction mechanism underlying cytokinetic cleavage furrow ingression in vertebrate cells, yet our data cannot rule out the possibility that at late cytokinesis stages some actin filaments form antiparallel arrays underneath a randomly oriented actin network.

The quantification of actin filament order at defined time points of cytokinesis has been established through several technical innovations. Previous studies of actin filament order in mitotic cells relied on conventional widefield epifluorescence polarization microscopy, which yields high out-of-focus signal in rounded mitotic cells, restricting accurate quantifications to the flat bottom surface of a cell strain that strongly adheres to the coverslip (Fishkind and Wang, 1993). In this prior study, mitotic stages were classified based on visual inspection of the chromosome morphologies, and it has remained unclear how the observed increase in actin filament alignment relates to the ingression state of the cleavage furrow. Our implementation of fluorescence polarization imaging on confocal microscopes strongly reduces out-of-focus signal, enabling to study actin network polarization in the native geometry of rounded mitotic cells. Furthermore, by calibrating the fluorescence anisotropy signal to reference standards with known polarization state, our study informs on the absolute degree of actin filament alignment within the cortical network. A mathematical model for cell geometries established accurate automated quantification of mitotic timing in fixed cells, thereby providing a reference for accurate quantifications of actin network order during cytokinesis progression. Imaging SiR-actin as a live-cell probe for actin filament orientation has further enabled to follow actin network reorganization over time in individual cells. Owing to the relatively slow image acquisition rates on the current confocal polscope implementation, the live-cell set-up can only report on relative changes of actin filament order based on direct ratiometric imaging. Yet, in combination with the fixed cell data, these experiments establish a detailed kinetic profile of actin network organization during cytokinesis progression.

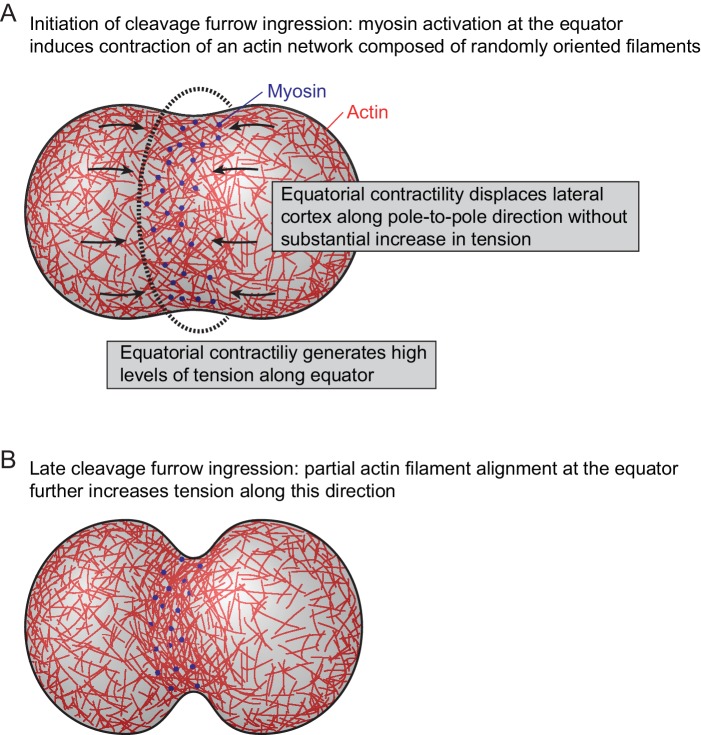
Following cytokinetic cleavage furrow initiation, actin filaments progressively align with the cell equator. This strictly depends on myosin II activity and the degree of actin filament alignment correlates with the local concentration of myosin. This supports a model of actin network reorganization by asymmetric mechanical tension distribution (Figure 5). In this model, the activation of myosin II at the cell equator would induce local contractility in a cortical network of randomly oriented actin filaments. Along the cell equator, each given point experiences counteracting contractile forces from neighboring regions, which would build up high levels of mechanical tension along the circumference of the cell. In the direction perpendicular to the cell equator, highly contractile equatorial cortex regions connect to neighboring regions of lower contractility, which would move toward the equator without building high levels of tension. The resulting asymmetric network deformation could explain the filament reorientation toward the direction of the cell equator, which might in turn further increase the contractile forces oriented along this direction.

Figure 5. Model for actomyosin network reorganization during cytokinesis of vertebrate cells.

Figure 5.

For details see main text.

In C. elegans embryos at the one-cell stage, peaks of myosin contractility and cortical actin filament alignment occur at spatially separate locations, whereby long-range cortical flows transduce forces to locally compress the actin filaments before furrowing (Reymann et al., 2016). Our data show that in human cells, peaks of myosin contractility and actin filament alignment co-localize and lateral cortical movement toward the equator does not precede network reorientation. This suggests that during human cell cytokinesis, the actomyosin network aligns directly at the site of highest contractility, whereby lateral cortical movements adjacent to the cell equator (Cao and Wang, 1990; Murthy and Wadsworth, 2005; Zhou and Wang, 2008) might reflect drag imposed by highest network contractility at the equator. In contrast to animal cells, fission yeast cells align actin filaments before contraction of the actomyosin ring (Stachowiak et al., 2014; Wu et al., 2006; Vavylonis et al., 2008; Laplante et al., 2016). This might be due to the high mechanical resistance of the cell wall, requiring a higher degree of actin filament reorientation to generate sufficient tension to ingress the plasma membrane.

Fluorescence polarization microscopy previously showed that septin filaments align with the cell equator during late stages of cytokinesis in budding yeast (DeMay et al., 2011b; Vrabioiu and Mitchison, 2006), but the underlying mechanism has remained unclear. Septins bind actin filaments and are required for proper function of the actomyosin ring in Drosophila melanogaster embryos (Mavrakis et al., 2014). Based on our observations, it is tempting to speculate that asymmetric distributions of mechanical tension might guide both actin and septin filament systems to self-assemble into polarized networks during cytokinesis.

Mechanical forces have has been suggested to shape other actin-based structures (Fletcher and Mullins, 2010). For example, dendritic actin networks respond to external pushing forces by branching actin preferentially on the convex edge of curved filaments, which orients network growth toward the mechanical force (Risca et al., 2012; Bieling et al., 2016). While these feedback mechanisms rely on external forces, our data suggest that the actomyosin ring of vertebrate cells responds to intrinsically generated forces. Given that actomyosin rings mediate various other biological processes, including cellular wound healing and developmental morphogenesis (Schwayer et al., 2016), it will be interesting to further investigate the intricate relationship between contractile forces and actin network organization.

Materials and methods

Cell lines and cell culture

All cells used in this study were derived from immortalized human retinal pigment epithelial cells (hTERT-RPE-1, ATCC, CRL-4000). This cell line was authenticated by a Multiplex human Cell line Authentication test (MCA). All cell lines used in this study have been regularly tested for mycoplasm contamination with negative results. The following monoclonal hTERT-RPE-1 cell lines expressing fluorescent proteins were generated: H2B-mRFP-hTERT-RPE1, LifeAct-mCherry-hTERT-RPE1, MRL2B-EGFP-hTERT-RPE1, Actin-GFP-hTERT-RPE1, MyrPalm-mEGFP-hTERT-RPE1. Cell lines were cultured in Dulbecco’s modified Eagle medium (DMEM; Gibco, Carlsbad, CA) supplemented with 10% (v/v) fetal bovine serum (FBS; Gibco), 1% (v/v) penicillin-streptomycin (Sigma-Aldrich, St. Louis, MO, USA), 500 µg ml−1 G418 (Gibco) and 0,5 µg ml−1 puromycin (Calbiochem, San Diego, CA). For live-cell imaging cells were grown on LabTek II (Thermo Fischer Scientific, Boston, MA) chambered coverglass or on 50-mm glass-bottom dishes cell culture dishes (MatTek Corporation, Ashland, MA). Live-cell imaging was carried out in DMEM containing 10% (v/v) FBS and 1% (v/v) penicillin/streptomycin, without phenol red and riboflavin to reduce autofluorescence.

Cell confinement microchambers

Cell confinement microchamber was fabricated as described in Le Berre et al. (2014). Briefly, hard micropillars made of PolyDiMethylSiloxane (PDMS, Sylgard 184 Silicone Elastomer Kit, Dow Corning, Midland, MI) with a ratio of 8:1 of elastomer:curing agent were disposed onto a 5-µm-height micropillar mold produced by photolithography (IST Austria, Jack Merrin). Subsequently plasma-cleaned coverslips (Menzel-Gläser, VWR, Radnor, PA) were placed onto the mold, pressed, and backed onto a 95°C heating plate for 15 min to generate micropillar-coated coverslips. Cell confinement was performed in 50-mm glass-bottom dishes (MatTek Corporation, Ashland, MA), which were plasma cleaned for 90 s and coated with 20 µg/ml fibronectin diluted in PBS overnight prior to seeding cells. Soft PDMS pillars (30:1 elastomer:curing agent) were attached to micropillar coated coverslips, inverted and mounted on top of the 50-mm glass-bottom cell culture dish. A home-made magnetic lid was used to apply homogeneous pressure on the micropillar coated coverslip to ensure homogeneous and reproducible cell confinement.

Plasmid transfection

Plasmids were transfected into hTERT-RPE-1 cells using X-tremeGENE9 DNA transfection reagent (Roche, Basel, Switzerland) according to the manufacturer’s instructions. Imaging was performed 48 hr post-transfection.

Inhibitors and stains

Para-nitroblebbistatin (Optopharma, Budapest, Hungary) was added 15 min prior to cell imaging to a final concentration of 50 µM (Figure 2B,G, Figure 3—figure supplement 1A,C). SiR-actin (Spirochrome, Stein am Rhein, Switzerland) was used at a final concentration of 0.1 µM (Figure 2A,B,D–G, Figure 2—figure supplement 1C–F,H, Figure 2—figure supplement 2, Figure 3—figure supplement 1, Figure 2—figure supplement 3) or 0.2 µM (Figure 1—figure supplement 1H–J), 0.3 µM (Figure 3E–G, Figure 4I,J). Hoechst 33342 (Sigma-Aldrich, St. Louis, MO) was used at a final concentration of 0.2 µg ml−1 (Figure 4A–F, Figure 4—figure supplement 1A,G).

Indirect immunofluorescence staining of cells synchronized to cytokinesis

Wild-type hTERT-RPE-1 cells were grown in T75 flasks (Thermo Fischer Scientific, Boston, MA) to 80% confluency. Then, dead cells were removed by shake-off and replacement of the culture medium. Mitotic cells were collected 2 hr later by shake-off and seeded on coverslips (Carl Roth, Karlsruhe, Germany) coated with 0.01% poly-L-lysine (Sigma-Aldrich, St. Louis, MO) in DMEM medium. 15 min after mitotic shake-off, cells were fixed by 4% (w/v) formaldehyde solution (methanol-free, Thermo Fischer Scientific, Boston, MA) in cytoskeleton buffer (20 mM Pipes, 2 mM MgCl2, 10 mM EGTA pH 6.8). Cells were permeabilized by 0.1% Triton X-100 in cytoskeleton buffer for 2 min and subsequently blocked for 30 min using BlockAid (Thermo Fischer Scientific). Actin was stained with AlexaFluor 488 phalloidin (Thermo Fischer Scientific) at a final concentration of 0.25 µM for 30 min in BlockAid and DNA was labeled with DAPI (Thermo Fischer Scientific) at a final concentration of 0.1 µg ml−1 for 10 min. Stained coverslips were washed with PBS and mounted using Vectashield antifade mounting medium (Vector Laboratories, Burlingame, CA).

Microscopy

Confocal microscopy

Confocal laser scanning microscopy was performed on a Zeiss LSM780 microscope using a 40 × 1.4 NA Oil DIC Plan-Apochromat objective (Carl Zeiss, Jena, Germany) or a Zeiss LSM710 microscope, using 63 × 1.4 NA Oil DIC Plan-Apochromat objective (Carl Zeiss), both controlled by ZEN 2011 software. Fast time-lapse imaging was performed on a spinning-disk confocal microscope (UltraView VoX, Pelkin Elmer, Waltham, MA) with a 100 × 1.45 NA alpha Plan-Fluar objective (Carl Zeiss), controlled by Volocity 6.3 software (Perkin Elmer, Waltham, MA). All three microscopes were equipped with an incubation chamber (European Molecular Biology Laboratory (EMBL), Heidelberg, Germany), providing a humidified atmosphere at 37°C with 5% CO2.

Confocal fluorescence anisotropy microscope

Fluorescence polarization microscopy in live cells was performed on a Zeiss LSM780 using a x40, 1.4 NA. Oil DIC Plan-Apochromat objective (Carl Zeiss, Jena, Germany) or on a Zeiss LSM710 using 63 × 1.4 N.A Oil DIC Plan-Apochromat objective (Carl Zeiss). Both systems were controlled by ZEN 2011 software and were equipped with an incubation chamber (EMBL, Heidelberg, Germany), providing a humidified atmosphere at 37°C with 5% CO2. For fluorescence anisotropy measurements, specimen was excited with 90 degree polarized laser light (relative to the X-axis of the optical table) two images were sequentially recorded with linear polarizers in the emission light path oriented 0° or 90° relative to the X-axis of the optical table, respectively.

Confocal liquid crystal-based fluorescence polarization microscope (LC-PolScope)

Confocal fluorescence polarization microscopy of fixed cells was performed on a Zeiss LSM780 microscope equipped with a LC universal compensator (OpenPolScope, Woods Hole, MA) used as a variable linear polarizer, introduced into the illumination path using the analyzer slider slot. The LC universal compensator was controlled by the OpenPolscope software package (Micro-Manager 1.4.15, OpenPolScope 2.0). The LC universal compensator was synchronized to image acquisition with ZEN 2011 using the OpenPolScope software package. 3-D-image stacks were recorded with 5–15 z-sections.

Laser microsurgery

Laser microsurgery was performed on a Zeiss LSM710 confocal microscope equipped with two linear polarization filters in the emission light path and a tuneable Chameleon Ti:Sapphire laser for multi-photon excitation using a 63 × 1.4 N.A Oil DIC Plan-Apochromat objective (Carl Zeiss, Jena, Germany), controlled by a ZEN 2011 software. The microscope was equipped with an incubation chamber (EMBL, Heidelberg, Germany) providing a humidified atmosphere at 37°C with 5% CO2. The cell cortex was cut using a tuneable Ti:Sapphire laser set to 915 nm and 100% power with 25 µs dwell time along a 5 µm linear path. To achieve reproducible cutting conditions, the laser was always moved along a horizontal path, using only cells that had a spindle axis of 90° ± 20° and 0° ± 20° relative to the X-axis of the optical table.

Fluorescence recovery after photobleaching (FRAP)

Fluorescence after photobleaching was performed on a Zeiss LSM 780 microscope using 63 × 1.4 NA Oil DIC Plan-Apochromat objective (Carl Zeiss, Jena, Germany). hTERT-RPE1 cells stably expressing Actin-GFP were grown in 5 µm confinement chambers and fluorescent signal was photobleached by moving a 488 nm laser on a 5 µm linear path with 50 µs dwell time per pixel along the cell cortex. Fluorescence recovery was monitored by acquiring time lapse movies after photobleaching.

Total internal reflection fluorescence microscopy

Total internal reflection fluorescence microscopy (TIRF) was performed on a customized iMIC stand (TILL Photonics, FEI, Hillsboro, OR) equipped with a multipoint 360° TIRF and an Olympus 100 × 1.49 NA high-performance TIRF objective. For LifeAct-mCherry excitation, an acousto-optical tunable filter (AOTF)-modulated 561 diode-pumped solid-state lasers laser (DPSS) line was used. The incidence angle was adjusted using a two-axis scan head that was rotated around 360°. Images were collected with an Andor iXON DU-897 EMCCD camera (Andor Technology Ltd. Belfast, UK) controlled by the Live Acquisition software (TILL Photonics, FEI, Hillsboro, OR). The microscope was equipped with a homemade heating stage and objective heating collar (IST-A machine and e-machine shop) to incubate cells at 37°C and with a humidified atmosphere with 5% CO2 (ibidi GmbH, Martinsried, Germany).

Image analysis

Staging of fixed cells relative to anaphase onset by cell geometry-based model

To estimate the time that cells were chemically fixed relative to anaphase onset, a regression model based on chromatin-chromatin distance and cleavage furrow diameter was developed. hTERT-RPE-1 cells stably expressing H2B-mRFP were stained with SiR-actin and imaged live every 15 s from metaphase until full ingression of the cytokinetic cleavage furrow. In these cells, the distance between the centers of the two segregating chromatin masses and the cleavage furrow diameter was measured at each time point (Figure 1—figure supplement 2A,B). A polynomial function with degree d = 4 was fitted to cleavage furrow diameter and chromatin-chromatin distance. The fitted regression model was used to infer the time after anaphase onset for experiments with fixed cells. Cells were classified to four stages (Figure 1E): metaphase, pre-ingression (<100 s), early ingression (101–150 s), mid ingression (151–200 s) and late ingression (201–301 s) relative to anaphase onset.

Quantification of fluorophore alignment with confocal LC-PolScope

Images acquired with the confocal LC-PolScope were analyzed using Fiji (version 1.47 s) in combination with a semi-automated pipeline developed in Matlab (MATLAB Release 2013b, The MathWorks, Inc, Natick, MA). Fluorescence anisotropy was calculated for image stacks of four frames that were sequentially recorded with linearly polarized light oriented at 0°, 45°, 90°, and 135°. A fifth image with 0 degree was recorded at the end to enable correction for acquisition photobleaching, as described in DeMay et al. (2011a). To obtain the ‘anisotropy image’, we calculated the polarization factor (p) for each camera pixel based on the intensities in the images measured at four different linear polarization states as following:

Polarization at the polar and equatorial cell cortex was determined using a custom developed Matlab analysis pipeline (Supplemental source code 1) as follows: we segmented the cell by a seeded watershed algorithm using the average image of all four different angle images as input. We next determined the equatorial and polar center positions by fitting an ellipse to the segmented contour and using the intersection between the segmented contour and long/short axis of the ellipse as the equatorial and polar regions. All identified regions were visually inspected and corrected if required. Using the intersecting pixel as the center we divided the segmented cortex outline with a width of 640 nm into 2 µm regions at the equator and 16 µm regions at the poles. This region was then transferred to the anisotropy image and intensities within this region were averaged (Figure 1—figure supplement 1B). These values were subsequently normalized between reference values separately measured for fluorescent plastic and AlexaFluor 488-phalloidin-stained stress fibers (Figure 1C,G) to calculate the normalized polarization factor pnorm:

a=I0-I90,b=I45-I135,c=I0+I45+I90+I135
p=a2+b20.5c
pnorm=p-pplasticpstressfibers-pplastic

The width of the anisotropic zone at the cell equator (Figure 1F) was determined by fitting a Gaussian function to the polarization factor line profiles in late-stage furrow ingression cells.

Quantification of fluorescence anisotropy in images recorded with linear polarizers in emission light path

Fluorescence polarization microscopy of live mitotic cells was performed using two linear polarizers in the emission light path of the confocal microscope. The use of a polarized laser excitation beam to excite fluorescent dipoles is incompatible with analysis using standard procedures as previously reported (Fishkind and Wang, 1993). We therefore measured relative changes of actin filament orientation over time based on a simple ratio between the images acquired with the horizontal and the vertical emission polarizers. The analysis pipeline for calculating the fluorescence emission ratio between the two images was then adapted to the respective cellular context (bottom section of a confined cell or central section of an unconfined cell) as detailed below.

In general, images were then analyzed using Fiji and a semi-automated analysis pipeline in Matlab. Global differences in transmission through the two linear polarizers were determined by imaging fluorescent plastic slides using both linear emission polarizers (isotropic fluorophore dipole sample that should be identical under both conditions). The channel transmission factor (CTF) was calculated by dividing the image acquired by using the horizontal linear polarizer by the image acquired with the vertical linear polarizer. This correction factor was multiplied with the image acquired with the vertical linear emission polarizer prior to downstream analysis.

For quantification of emission ratio at the bottom surface of cells (Figure 3E, Figure 4I), the mean fluorescence intensity in a region outside the cell was measured and subtracted from each frame of the respective image prior to analysis (background correction). We then calculated the ratio between images acquired with 0° and 90° linear emission polarizers in a rectangle region (1 µm x 4 µm) centered at the cell equator (Figure 3E). For emission ratio measurements after laser cutting, we calculated the ratio between images acquired with 0° and 90° linear emission polarizers in squared regions (2 µm x 2 µm) perpendicular and adjacent to each cut border. The emission ratio obtained from the four regions two on each side of the cut was averaged (Figure 4I) and subsequently normalized to a reference scale between emission ratio values derived from metaphase cortices (representing a random actin network, see Figure 1C), and stress fibers (representing aligned actin filaments). Stress fiber values were measured by manually drawing a 120 pixel long and 5 pixel wide line along a stress fiber using Fiji. Final values were derived by calculating the median from all measured values.

Unlike for emission ratios derived from planar surfaces at the bottom section, we must consider the cell cortex orientation for emission ratios measured at central z-sections. This is because the emission ratio is determined not only by the fluorescent dipole orientation relative to the linear polarizers, but also by the fluorescent dipole orientation relative to the polarization of the exciting laser light. Only cells with a spindle axis of 90° ± 20° (relative to the X-axis of the optical table) were used for the measurements. To correct for the contribution of emission ratio changes caused by the polarized excitation light, we recorded reference images of metaphase cells stained with SiR-actin and measured the fluorescence ratio along the cortex (Figure 2—figure supplement 1D). Because the actin network of metaphase cortices is randomly oriented, changes in emission ratio are only caused by the fluorescence dipole orientation relative to the excitation beam. We developed a regression model for excitation light dependent emission ratio changes by fitting a sine squared function with a wavelength to 180° to the emission ratio along the metaphase cortex (Figure 2—figure supplement 1E). To correct for excitation light contribution, we divided the observed ratio by the regression model and obtained a ratio of 1 along the entire metaphase cortex (Figure 2—figure supplement 1F). We then applied this regression model to the dividing cells by integrating it into the following workflow: we first segmented the cell cortex by using a seeded watershed algorithm (position 0 µm marks the furrow midpoint in all subsequent plots). We then divided the segmented cortex in four sub-regions of 300 pixels length using the furrow or pole position as the center of the segment (Figure 2—figure supplement 2A). The cortex orientations at individual pixel positions was inferred by fitting a B-spline to the segmented outline of each cell for every time frame (Figure 2—figure supplement 2B). This segmentation contour line had a width that completely contained the cortex signal even when the two image channels were slightly shifted owing to cleave furrow ingression during their sequential acquisition (e.g. Figure 2B, control, 330 s). We next averaged the fluorescence intensity over seven pixels perpendicular to the tangential vector using the segmented pixel as the central pixel (Figure 2—figure supplement 2B). Averaged intensity values for each central pixel were used to calculate the ratio between linear emission polarizers of 0° and 90° to obtain the observed ratio (Figure 2—figure supplement 2B). By evaluating the regression model for the pixel orientation along the segmented contour, we obtained the expected ratio that is purely based on the cortex geometry (see also Figure 2—figure supplement 1D–F). We next divided the ‘observed ratio’ for each averaged pixel of the contour by the ‘expected ratio’ to correct for cell geometry effects (Figure 2—figure supplement 2B) and calculate a ‘corrected ratio’. Regions far away from the furrow midpoint at 0 µm in this ‘corrected ratio’ plot show emission ratio values close to one as expected for a randomly organized actin filament network, while emission values at the cleavage furrow show lower values indicating actin filament alignment (Figure 2—figure supplement 2B). To reduce noise, the emission ratio was averaged within a 1 µm window centered at the cell equator and at the cell poles. The final ‘normalized’ emission ratio was calculated by dividing the ‘corrected emission ratio’ by the average of the emission ratio of three metaphase frames to obtain changes relative to anaphase onset.

For display of normalized emission ratio values on straight contours (Figure 1—figure supplement 1C), we used a custom-developed Matlab script to extract pixel intensity values along the segmentation mask. Pixel intensity values were then normalized between 1 and 0 by first subtracting the lowest pixel value from the image and then by dividing the image by the brightest pixel value. The Fiji plugin ‘straighten’ was then used to generate linescan images.

The following section further details the calculations described above:

Outline of a mitotic cell was segmented using a seeded watershed algorithm (Equation 1)

OMitotic Segmented outline mitotic cell (1)

B-spline (BS) fit was used to determine the tangential angle (α) of each pixel of the cortical outline (Equation 2)

α(x)= BS (x), xOMitotic (2)

Pixel intensities acquired with horizontal linear emission polarizer were divided by pixel intensities acquired with vertical linear emission polarizer, leading to a measure of fluorescence ratio (r). To avoid bias in the fluorescence ratio, the transmission differences between the two channels needs to be corrected. We therefore measured channel transmission factor (CTF) using a specimen with randomly oriented fluorescent dipoles. Because of the polarized nature of both the excitation light and the emission light, the resulting fluorescence ratio is influenced by the dipole orientation relative to angle of the excitation light. To correct for this, we measured the fluorescence ratio along the cortex of a metaphase cells.

rMitotic(x,α)= IMitotic(x,α)IMitotic(x,α)CTF (3)

Similar quantities were defined for metaphase cells.

OMetaphaseSegmentedoutlinemetaphaseframes (4)
α(x)= BS (x), xOMetaphase (5)
rMetaphasex,α=IMetaphase(x,α)IMetaphasex,αCTF (6)

Next, we built a regression model of angle-dependent emission ratio (R) based on segmented metaphase cortices

RMetaphase(α)=a0+a1sin2rMetaphasex,απ180 (7)

Above experimentally determined regression was then used to correct the angle dependence in data.

rcorrectedx,α=rMitotic/Metaphasex,αRMetaphase(α) (8)

Finally, the corrected normalized emission ratio values were divided by pre-anaphase values.

rNorm=rcorrectedrpre-anaphse (9)

Cell geometry quantification

Cleavage furrow diameter and pole-pole distance was measured manually in the central section of a Z-stack. In cell confiner experiments, the cleavage furrow diameter along the optical axis was measured by sectioning the Z-stack in the axial dimension along a line centered at the midpoint of a cell. The distance between top and bottom surfaces was measured manually at the cell equator.

The distance between the segregating chromosome masses during anaphase was measured based on the H2B-mRFP label. The H2B-mRFP images were segmented using a custom-developed MATLAB script and the weighted center of mass was calculated for each segregating mass of chromosomes. Prior to sister chromatid separation, only a single chromatin center position was determined.

Cell cortex curvature was calculated by fitting a circle to the center position of the cell equator of the segmented outline of a cell. Curvature was calculated as the reciprocal of the radius of the circle. When the midpoint of the circle was located inside the cell the curvature was defined as negative, and if the midpoint of the circle was located outside the cell it was positive.

Quantification of actin and myosin fluorescence at the cell cortex

SiR-actin and myosin regulatory light chain 12-B-EGFP (gift from Roland Wedlich-Soeldner, University of Muenster, Germany) fluorescence intensities were measured on cortices segmented using a seeded watershed algorithm. Line profiles along the entire cell cortex were generated based on the segmented cortex contour. The average of cytoplasmic and extracellular fluorescence was subtracted from each image prior to analysis of cortical fluorescence. Cortical fluorescence intensities were averaged within a 4 µm region centered at the cell equator or at the cell poles, respectively. These values were normalized to anaphase onset (the last time frame in which chromosomes were not separated) by dividing by the average value determined in three time frames prior to anaphase onset. For each individual cell, an average line profile was calculated based on time points from 180 s after anaphase onset until full ingression, normalized to the maximum value. Line profiles from 14 cells were subsequently averaged (Figure 2—figure supplement 3D,E).

Cortex thickness measurement

RPE1 cells expressing MyrPalm were stained for 2 hr with 200 nm SiR-actin. Interphase cells were trypsinized for 1 min and quenched with DMEM immediately before imaging to obtain rounded cells while metaphase cells and late anaphase cells were obtained from asynchronously growing cells. Two-colour images (green and far-red) were recorded on an LSM780 using a 63 x (1.4 NA (numerical aperture)) objective. For chromatic correction 500 nm diameter multicolor TetraSpeck fluorescent beads (Invitrogen T14792) were imaged using the same settings. After correction for the chromatic shift in x and y (73.5 nm and 39.8 nm, respectively) linescans were performed in Fiji. For this, we measured a 10 px wide line perpendicular to the cell cortex in a region devoid of filopodia. For measurements in anaphase cells, only cells with substantial furrow ingression were used and the line was positioned in the furrow (see Figure 2—figure supplement 1G). After background substraction a Gaussian function was fitted to the linescans using a custom developed Matlab script. The fit area was restricted to a 11 pixel wide region, using the central pixel as the maximum value of the linescan. The distance between the Gaussian center positions for MyrPalm and Sir-Actin fluorescence channels determined (XMyrPalm – XSir-actin). The cortex thickness is obtained by multiplying this value by two (see Clark et al., 2013).

Kymograph measurement

Kymographs were generated in Fiji, by using the KymoResliceWide plugin after drawing a straight 25 px wide linear line from cell pole to cell pole.

Quantification of cortical tension in laser microsurgery experiments

The initial outward movement of the cell cortex after laser cutting was determined by measuring the distance between the edges adjacent to the cut in the first frame after cutting. Outward movement is composed mainly of myosin-induced contractility (Fischer-Friedrich et al., 2016), but also of laser-induced damage. To estimate the contribution of laser induced damage to the initial outward movement, we measured the position of landmark structures before and after cutting in cells in which non-muscle myosin-II activity was inhibited by addition of 50 µM para-nitroblebbistatin. The average value for landmark displacement pairs was used as a baseline that was subtracted from the measured distance between the edge of displaced cortex after cutting. hTERT-RPE-1 cells were classified into four cell division stages based on the ratio of the cleavage furrow diameter and the cell diameter at the position of the chromosome masses: metaphase (pre-chromosome segregation), pre-ingression (ratio >1), early ingression (ratio <1 and>0.8), late ingression (ratio <0.8).

Acknowledgements

The authors thank Hervé Turlier for comments on the manuscript, the IMBA/IMP/GMI BioOptics core facility for technical support, and Life Science Editors for editorial support. DWG has received funding from the European Community’s Seventh Framework Programme FP7/2007-2013 under grant agreement no. 241548 (MitoSys) and no. 258068 (Systems Microscopy), an ERC Starting Grant under agreement no. 281198 (DIVIMAGE), and from the Austrian Science Fund (FWF) project no. SFB F34-06 (Chromosome Dynamics). FS has received funding from an EMBO long-term fellowship (ALTF 1447–2012). SM has received funding from Human Frontier Science Program cross-disciplinary fellowship (LT000096/2011).

Funding Statement

The funders had no role in study design, data collection and interpretation, or the decision to submit the work for publication.

Contributor Information

Daniel W Gerlich, Email: Daniel.Gerlich@imba.oeaw.ac.at.

Mohan K Balasubramanian, University of Warwick, United Kingdom.

Funding Information

This paper was supported by the following grants:

  • European Commission 241548 to Daniel W Gerlich.

  • Austrian Science Fund SFB F34-06 to Daniel W Gerlich.

  • European Research Council 281198 to Daniel W Gerlich.

  • European Commission 258068 to Daniel W Gerlich.

  • European Molecular Biology Organization ALTF 1447-2012 to Felix Spira.

  • Human Frontier Science Program LT000096/2011 to Shalin Mehta.

Additional information

Competing interests

No competing interests declared.

Author contributions

Conceptualization, Software, Formal analysis, Validation, Investigation, Visualization, Methodology, Writing—review and editing, Conception and design, acquisition of data, analysis and interpretation of data, drafting or revising the article.

Formal analysis, Validation, Investigation, Visualization, Methodology, Acquisition of data and analysis and interpretation of data.

Software, Formal analysis, Investigation, Methodology, Writing—review and editing, Acquisition of data, analysis and interpretation of data, drafting or revising the article.

Formal analysis, Investigation, Visualization, Writing—review and editing, Acquisition of data, drafting or revising the article.

Resources, Methodology, Acquisition of data, contributed unpublished essential data, analytical tools, or reagents.

Resources, Contributed unpublished essential data, analytical tools, or reagents.

Resources, Supervision, Contributed unpublished essential data, analytical tools, or reagents.

Resources, Supervision, Contributed unpublished essential data, analytical tools, or reagents.

Conceptualization, Formal analysis, Supervision, Funding acquisition, Validation, Methodology, Writing—original draft, Project administration, Writing—review and editing, Conception and design, analysis and interpretation of data, drafting or revising the article.

Additional files

Source code 1.
elife-30867-code1.zip (32.5KB, zip)
DOI: 10.7554/eLife.30867.015
Transparent reporting form
DOI: 10.7554/eLife.30867.016

References

  1. Bement WM, Miller AL, von Dassow G. Rho GTPase activity zones and transient contractile arrays. BioEssays. 2006;28:983–993. doi: 10.1002/bies.20477. [DOI] [PMC free article] [PubMed] [Google Scholar]
  2. Bieling P, Li TD, Weichsel J, McGorty R, Jreij P, Huang B, Fletcher DA, Mullins RD. Force feedback controls motor activity and mechanical properties of self-assembling branched actin networks. Cell. 2016;164:115–127. doi: 10.1016/j.cell.2015.11.057. [DOI] [PMC free article] [PubMed] [Google Scholar]
  3. Bray D, White JG. Cortical flow in animal cells. Science. 1988;239:883–888. doi: 10.1126/science.3277283. [DOI] [PubMed] [Google Scholar]
  4. Cao LG, Wang YL. Mechanism of the formation of contractile ring in dividing cultured animal cells. II. Cortical movement of microinjected actin filaments. The Journal of Cell Biology. 1990;111:1905–1911. doi: 10.1083/jcb.111.5.1905. [DOI] [PMC free article] [PubMed] [Google Scholar]
  5. Cheffings TH, Burroughs NJ, Balasubramanian MK. Actomyosin ring formation and tension generation in eukaryotic cytokinesis. Current Biology. 2016;26:R719–R737. doi: 10.1016/j.cub.2016.06.071. [DOI] [PubMed] [Google Scholar]
  6. Chugh P, Clark AG, Smith MB, Cassani DAD, Dierkes K, Ragab A, Roux PP, Charras G, Salbreux G, Paluch EK. Actin cortex architecture regulates cell surface tension. Nature Cell Biology. 2017;19:689–697. doi: 10.1038/ncb3525. [DOI] [PMC free article] [PubMed] [Google Scholar]
  7. Clark AG, Dierkes K, Paluch EK. Monitoring actin cortex thickness in live cells. Biophysical Journal. 2013;105:570–580. doi: 10.1016/j.bpj.2013.05.057. [DOI] [PMC free article] [PubMed] [Google Scholar]
  8. DeBiasio RL, LaRocca GM, Post PL, Taylor DL. Myosin II transport, organization, and phosphorylation: evidence for cortical flow/solation-contraction coupling during cytokinesis and cell locomotion. Molecular Biology of the Cell. 1996;7:1259–1282. doi: 10.1091/mbc.7.8.1259. [DOI] [PMC free article] [PubMed] [Google Scholar]
  9. DeMay BS, Bai X, Howard L, Occhipinti P, Meseroll RA, Spiliotis ET, Oldenbourg R, Gladfelter AS. Septin filaments exhibit a dynamic, paired organization that is conserved from yeast to mammals. The Journal of Cell Biology. 2011b;193:1065–1081. doi: 10.1083/jcb.201012143. [DOI] [PMC free article] [PubMed] [Google Scholar]
  10. DeMay BS, Noda N, Gladfelter AS, Oldenbourg R. Rapid and quantitative imaging of excitation polarized fluorescence reveals ordered septin dynamics in live yeast. Biophysical Journal. 2011a;101:985–994. doi: 10.1016/j.bpj.2011.07.008. [DOI] [PMC free article] [PubMed] [Google Scholar]
  11. Dorn JF, Zhang L, Phi TT, Lacroix B, Maddox PS, Liu J, Maddox AS. A theoretical model of cytokinesis implicates feedback between membrane curvature and cytoskeletal organization in asymmetric cytokinetic furrowing. Molecular Biology of the Cell. 2016;27:1286–1299. doi: 10.1091/mbc.E15-06-0374. [DOI] [PMC free article] [PubMed] [Google Scholar]
  12. Eggert US, Mitchison TJ, Field CM. Animal cytokinesis: from parts list to mechanisms. Annual Review of Biochemistry. 2006;75:543–566. doi: 10.1146/annurev.biochem.74.082803.133425. [DOI] [PubMed] [Google Scholar]
  13. Ennomani H, Letort G, Guérin C, Martiel JL, Cao W, Nédélec F, De La Cruz EM, Théry M, Blanchoin L. Architecture and connectivity govern actin network contractility. Current Biology. 2016;26:616–626. doi: 10.1016/j.cub.2015.12.069. [DOI] [PMC free article] [PubMed] [Google Scholar]
  14. Fededa JP, Gerlich DW. Molecular control of animal cell cytokinesis. Nature Cell Biology. 2012;14:440–447. doi: 10.1038/ncb2482. [DOI] [PubMed] [Google Scholar]
  15. Fenix AM, Taneja N, Buttler CA, Lewis J, Van Engelenburg SB, Ohi R, Burnette DT. Expansion and concatenation of non-muscle myosin IIA filaments drive cellular contractile system formation during interphase and mitosis. Molecular Biology of the Cell. 2016:1465–1478. doi: 10.1091/mbc.E15-10-0725. [DOI] [PMC free article] [PubMed] [Google Scholar]
  16. Fischer-Friedrich E, Toyoda Y, Cattin CJ, Müller DJ, Hyman AA, Jülicher F. Rheology of the active cell cortex in mitosis. Biophysical Journal. 2016;111:589–600. doi: 10.1016/j.bpj.2016.06.008. [DOI] [PMC free article] [PubMed] [Google Scholar]
  17. Fishkind DJ, Wang YL. Orientation and three-dimensional organization of actin filaments in dividing cultured cells. The Journal of Cell Biology. 1993;123:837–848. doi: 10.1083/jcb.123.4.837. [DOI] [PMC free article] [PubMed] [Google Scholar]
  18. Fletcher DA, Mullins RD. Cell mechanics and the cytoskeleton. Nature. 2010;463:485–492. doi: 10.1038/nature08908. [DOI] [PMC free article] [PubMed] [Google Scholar]
  19. Green RA, Paluch E, Oegema K. Cytokinesis in animal cells. Annual Review of Cell and Developmental Biology. 2012;28:29–58. doi: 10.1146/annurev-cellbio-101011-155718. [DOI] [PubMed] [Google Scholar]
  20. Greenspan HP. On the dynamics of cell cleavage. Journal of Theoretical Biology. 1977;65:79–99. doi: 10.1016/0022-5193(77)90078-9. [DOI] [PubMed] [Google Scholar]
  21. Henson JH, Ditzler CE, Germain A, Irwin PM, Vogt ET, Yang S, Wu X, Shuster CB. The ultrastructural organization of actin and myosin II filaments in the contractile ring: new support for an old model of cytokinesis. Molecular Biology of the Cell. 2017;28:613–623. doi: 10.1091/mbc.E16-06-0466. [DOI] [PMC free article] [PubMed] [Google Scholar]
  22. Janson LW, Kolega J, Taylor DL. Modulation of contraction by gelation/solation in a reconstituted motile model. The Journal of Cell Biology. 1991;114:1005–1015. doi: 10.1083/jcb.114.5.1005. [DOI] [PMC free article] [PubMed] [Google Scholar]
  23. Kamasaki T, Osumi M, Mabuchi I. Three-dimensional arrangement of F-actin in the contractile ring of fission yeast. The Journal of Cell Biology. 2007;178:765–771. doi: 10.1083/jcb.200612018. [DOI] [PMC free article] [PubMed] [Google Scholar]
  24. Képiró M, Várkuti BH, Végner L, Vörös G, Hegyi G, Varga M, Málnási-Csizmadia A. para-nitroblebbistatin, the non-cytotoxic and photostable myosin II inhibitor. Angewandte Chemie International Edition. 2014;53:8211–8215. doi: 10.1002/anie.201403540. [DOI] [PubMed] [Google Scholar]
  25. Laplante C, Huang F, Tebbs IR, Bewersdorf J, Pollard TD. Molecular organization of cytokinesis nodes and contractile rings by super-resolution fluorescence microscopy of live fission yeast. PNAS. 2016;113:E5876–E5885. doi: 10.1073/pnas.1608252113. [DOI] [PMC free article] [PubMed] [Google Scholar]
  26. Le Berre M, Zlotek-Zlotkiewicz E, Bonazzi D, Lautenschlaeger F, Piel M. Methods for two-dimensional cell confinement. Methods in cell biology. 2014;121:213–229. doi: 10.1016/B978-0-12-800281-0.00014-2. [DOI] [PubMed] [Google Scholar]
  27. Lenz M, Thoresen T, Gardel ML, Dinner AR. Contractile units in disordered actomyosin bundles arise from F-actin buckling. Physical Review Letters. 2012;108:238107. doi: 10.1103/PhysRevLett.108.238107. [DOI] [PMC free article] [PubMed] [Google Scholar]
  28. Lenz M. Geometrical origins of contractility in disordered actomyosin networks. Physical Review X. 2014;4:041002. doi: 10.1103/PhysRevX.4.041002. [DOI] [Google Scholar]
  29. Linsmeier I, Banerjee S, Oakes PW, Jung W, Kim T, Murrell MP. Disordered actomyosin networks are sufficient to produce cooperative and telescopic contractility. Nature Communications. 2016;7:12615. doi: 10.1038/ncomms12615. [DOI] [PMC free article] [PubMed] [Google Scholar]
  30. Liu YJ, Le Berre M, Lautenschlaeger F, Maiuri P, Callan-Jones A, Heuzé M, Takaki T, Voituriez R, Piel M. Confinement and low adhesion induce fast amoeboid migration of slow mesenchymal cells. Cell. 2015;160:659–672. doi: 10.1016/j.cell.2015.01.007. [DOI] [PubMed] [Google Scholar]
  31. Lukinavičius G, Reymond L, D'Este E, Masharina A, Göttfert F, Ta H, Güther A, Fournier M, Rizzo S, Waldmann H, Blaukopf C, Sommer C, Gerlich DW, Arndt HD, Hell SW, Johnsson K. Fluorogenic probes for live-cell imaging of the cytoskeleton. Nature Methods. 2014;11:731–733. doi: 10.1038/nmeth.2972. [DOI] [PubMed] [Google Scholar]
  32. Mabuchi I. Cleavage furrow: timing of emergence of contractile ring actin filaments and establishment of the contractile ring by filament bundling in sea urchin eggs. Journal of Cell Science. 1994;107:1853–1862. doi: 10.1242/jcs.107.7.1853. [DOI] [PubMed] [Google Scholar]
  33. Maupin P, Pollard TD. Arrangement of actin filaments and myosin-like filaments in the contractile ring and of actin-like filaments in the mitotic spindle of dividing HeLa cells. Journal of Ultrastructure and Molecular Structure Research. 1986;94:92–103. doi: 10.1016/0889-1605(86)90055-8. [DOI] [PubMed] [Google Scholar]
  34. Mavrakis M, Azou-Gros Y, Tsai FC, Alvarado J, Bertin A, Iv F, Kress A, Brasselet S, Koenderink GH, Lecuit T. Septins promote F-actin ring formation by crosslinking actin filaments into curved bundles. Nature Cell Biology. 2014;16:322–334. doi: 10.1038/ncb2921. [DOI] [PubMed] [Google Scholar]
  35. Mayer M, Depken M, Bois JS, Jülicher F, Grill SW. Anisotropies in cortical tension reveal the physical basis of polarizing cortical flows. Nature. 2010;467:617–621. doi: 10.1038/nature09376. [DOI] [PubMed] [Google Scholar]
  36. McQuilken M, Mehta SB, Verma A, Harris G, Oldenbourg R, Gladfelter AS. Polarized fluorescence microscopy to study cytoskeleton assembly and organization in live cells. Current protocols in cell biology. 2015;67:21–13. doi: 10.1002/0471143030.cb0429s67. [DOI] [PMC free article] [PubMed] [Google Scholar]
  37. Mehta SB, McQuilken M, La Riviere PJ, Occhipinti P, Verma A, Oldenbourg R, Gladfelter AS, Tani T. Dissection of molecular assembly dynamics by tracking orientation and position of single molecules in live cells. PNAS. 2016;113:E6352–E6361. doi: 10.1073/pnas.1607674113. [DOI] [PMC free article] [PubMed] [Google Scholar]
  38. Murrell M, Oakes PW, Lenz M, Gardel ML. Forcing cells into shape: the mechanics of actomyosin contractility. Nature Reviews Molecular Cell Biology. 2015;16:486–498. doi: 10.1038/nrm4012. [DOI] [PMC free article] [PubMed] [Google Scholar]
  39. Murrell MP, Gardel ML. F-actin buckling coordinates contractility and severing in a biomimetic actomyosin cortex. PNAS. 2012;109:20820–20825. doi: 10.1073/pnas.1214753109. [DOI] [PMC free article] [PubMed] [Google Scholar]
  40. Murthy K, Wadsworth P. Myosin-II-dependent localization and dynamics of F-actin during cytokinesis. Current Biology. 2005;15:724–731. doi: 10.1016/j.cub.2005.02.055. [DOI] [PubMed] [Google Scholar]
  41. Noguchi T, Mabuchi I. Reorganization of actin cytoskeleton at the growing end of the cleavage furrow of Xenopus egg during cytokinesis. Journal of cell science. 2001;114:401–412. doi: 10.1242/jcs.114.2.401. [DOI] [PubMed] [Google Scholar]
  42. Piekny A, Werner M, Glotzer M. Cytokinesis: welcome to the Rho zone. Trends in Cell Biology. 2005;15:651–658. doi: 10.1016/j.tcb.2005.10.006. [DOI] [PubMed] [Google Scholar]
  43. Pollard TD. The role of actin in the temperature-dependent gelation and contraction of extracts of Acanthamoeba. The Journal of Cell Biology. 1976;68:579–601. doi: 10.1083/jcb.68.3.579. [DOI] [PMC free article] [PubMed] [Google Scholar]
  44. Reymann AC, Staniscia F, Erzberger A, Salbreux G, Grill SW. Cortical flow aligns actin filaments to form a furrow. eLife. 2016;5:e17807. doi: 10.7554/eLife.17807. [DOI] [PMC free article] [PubMed] [Google Scholar]
  45. Risca VI, Wang EB, Chaudhuri O, Chia JJ, Geissler PL, Fletcher DA. Actin filament curvature biases branching direction. PNAS. 2012;109:2913–2918. doi: 10.1073/pnas.1114292109. [DOI] [PMC free article] [PubMed] [Google Scholar]
  46. Salbreux G, Prost J, Joanny JF. Hydrodynamics of cellular cortical flows and the formation of contractile rings. Physical Review Letters. 2009;103:058102. doi: 10.1103/PhysRevLett.103.058102. [DOI] [PubMed] [Google Scholar]
  47. Schroeder TE. Cytokinesis: filaments in the cleavage furrow. Experimental Cell Research. 1968;53:272–276. doi: 10.1016/0014-4827(68)90373-X. [DOI] [PubMed] [Google Scholar]
  48. Schroeder TE. The contractile ring. II. Determining its brief existence, volumetric changes, and vital role in cleaving Arbacia eggs. The Journal of Cell Biology. 1972;53:419–434. doi: 10.1083/jcb.53.2.419. [DOI] [PMC free article] [PubMed] [Google Scholar]
  49. Schwayer C, Sikora M, Slováková J, Kardos R, Heisenberg CP. Actin rings of power. Developmental Cell. 2016;37:493–506. doi: 10.1016/j.devcel.2016.05.024. [DOI] [PubMed] [Google Scholar]
  50. Stachowiak MR, Laplante C, Chin HF, Guirao B, Karatekin E, Pollard TD, O'Shaughnessy B. Mechanism of cytokinetic contractile ring constriction in fission yeast. Developmental Cell. 2014;29:547–561. doi: 10.1016/j.devcel.2014.04.021. [DOI] [PMC free article] [PubMed] [Google Scholar]
  51. Straight AF, Cheung A, Limouze J, Chen I, Westwood NJ, Sellers JR, Mitchison TJ. Dissecting temporal and spatial control of cytokinesis with a myosin II Inhibitor. Science. 2003;299:1743–1747. doi: 10.1126/science.1081412. [DOI] [PubMed] [Google Scholar]
  52. Vavylonis D, Wu JQ, Hao S, O'Shaughnessy B, Pollard TD. Assembly mechanism of the contractile ring for cytokinesis by fission yeast. Science. 2008;319:97–100. doi: 10.1126/science.1151086. [DOI] [PubMed] [Google Scholar]
  53. Verkhovsky AB, Svitkina TM, Borisy GG. Network contraction model for cell translocation and retrograde flow. Biochemical Society symposium. 1999;65:207–222. [PubMed] [Google Scholar]
  54. Vogel SK, Petrasek Z, Heinemann F, Schwille P. Myosin motors fragment and compact membrane-bound actin filaments. eLife. 2013;2:e00116. doi: 10.7554/eLife.00116. [DOI] [PMC free article] [PubMed] [Google Scholar]
  55. Vrabioiu AM, Mitchison TJ. Structural insights into yeast septin organization from polarized fluorescence microscopy. Nature. 2006;443:466–469. doi: 10.1038/nature05109. [DOI] [PubMed] [Google Scholar]
  56. Wang YL. The mechanism of cortical ingression during early cytokinesis: thinking beyond the contractile ring hypothesis. Trends in Cell Biology. 2005;15:581–588. doi: 10.1016/j.tcb.2005.09.006. [DOI] [PubMed] [Google Scholar]
  57. White JG, Borisy GG. On the mechanisms of cytokinesis in animal cells. Journal of Theoretical Biology. 1983;101:289–316. doi: 10.1016/0022-5193(83)90342-9. [DOI] [PubMed] [Google Scholar]
  58. Wollrab V, Thiagarajan R, Wald A, Kruse K, Riveline D. Still and rotating myosin clusters determine cytokinetic ring constriction. Nature Communications. 2016;7:11860. doi: 10.1038/ncomms11860. [DOI] [PMC free article] [PubMed] [Google Scholar]
  59. Wottawah F, Schinkinger S, Lincoln B, Ananthakrishnan R, Romeyke M, Guck J, Käs J. Optical rheology of biological cells. Physical Review Letters. 2005;94:098103. doi: 10.1103/PhysRevLett.94.098103. [DOI] [PubMed] [Google Scholar]
  60. Wu JQ, Sirotkin V, Kovar DR, Lord M, Beltzner CC, Kuhn JR, Pollard TD. Assembly of the cytokinetic contractile ring from a broad band of nodes in fission yeast. The Journal of Cell Biology. 2006;174:391–402. doi: 10.1083/jcb.200602032. [DOI] [PMC free article] [PubMed] [Google Scholar]
  61. Zhou M, Wang YL. Distinct pathways for the early recruitment of myosin II and actin to the cytokinetic furrow. Molecular Biology of the Cell. 2008;19:318–326. doi: 10.1091/mbc.E07-08-0783. [DOI] [PMC free article] [PubMed] [Google Scholar]
  62. Zinemanas D, Nir A. On the viscous deformation of biological cells under anisotropic surface tension. Journal of Fluid Mechanics. 1988;193:217–241. doi: 10.1017/S0022112088002125. [DOI] [Google Scholar]

Decision letter

Editor: Mohan K Balasubramanian1

In the interests of transparency, eLife includes the editorial decision letter and accompanying author responses. A lightly edited version of the letter sent to the authors after peer review is shown, indicating the most substantive concerns; minor comments are not usually included.

[Editors’ note: a previous version of this study was rejected after peer review, but the authors submitted for reconsideration. The first decision letter after peer review is shown below.]

Thank you for submitting your work entitled "Actomyosin contracts as a network to drive cytokinesis in vertebrate cells" for consideration by eLife. Your article has been reviewed by three peer reviewers, one of whom is a member of our Board of Reviewing Editors and the evaluation has been overseen by a Senior Editor. The reviewers have opted to remain anonymous.

Our decision has been reached after consultation between the reviewers. Based on these discussions and the individual reviews below, we regret to inform you that your work will not be considered further for publication in eLife.

The referees were uniformly positive about the field and the fact that you are using cutting edge tools to investigate the idea originally proposed over 20 years ago by Fishkind and Wang. One of the referees felt that the study would benefit from cutting experiments after low dose Blebbistatin treatment. However, while other reviewers agreed this was a good experiment, they raised too many concerns with how the experiments were done and would like to have seen the raw data as well as experimental details described better. An extract of the discussion is also included for your information. In light of these concerns, we are unable to proceed further. We will be willing to consider a new submission with all details provided, which will be seen by the three referees. I will point out that there will be no guarantees of publication, since the conclusions may or may not hold.

Laser cutting after drug treatment is itself an interesting experiment. However, I feel that this can't correct the major defects of this manuscript such as:

– Lack of raw data: no raw images of the polarity microscopy of a dividing cell have been shown.

– Questionable methodologies for both data acquisition and analysis (inconsistent definitions of anisotropy etc.)

– Oversimplified assumption that all the actin filaments are parallel to the membrane and there is no thickness of the cortex.

Under this circumstance, it is impossible to suggest a defined set of revisions that would sort of guarantee the publication.

Reviewer #1:

Spira et al., present a valuable new approach to spatiotemporally monitor changes in actin filament organization during cleavage furrow ingression. Previously, EM and quantitative fluorescence microscopy–based assays have visualized the formation of discreet foci of actin filaments prior to cleavage furrow formation. The method proposed here, fluorescence polarization microscopy, provides an opportunity to monitor dynamics of actin filament organization during cleavage furrow ingression and link it directly to ring contraction in a live setting. Based on their work the authors conclude that the, (a) actin reorientation appears not to be critical for transducing forces leading to the early stages of cleavage furrow ingression, (b) actin filament reorientation is a consequence of mechanical input from myosin II, and (c) filament reorientation is a consequence of the mechanical coupling along the contractile ring. However I have a few concerns that I would like the authors to address before publication.

The results presented in this manuscript are largely consistent with those observed in other cellular systems such as sea urchin and fission yeast, namely that filament reorganization occurs much later during cleavage furrow ingression and is not necessarily a cause for the initiation of furrow formation which reduces the novelty of the authors' conclusions.

That the actin network transforms from a largely isotropic cortical meshwork in metaphase cells into an anisotropic network shortly after the onset of anaphase onset has already been reported earlier (see Fishkind and Wang, 1993). Understandably, the present work provides important dynamic insights along with data to suggest presence of radial forces along the cell equator that drive ring contraction and as such is interesting.

However the authors should clarify the following concerns before publication. In general, the description of their methods needs better articulation. In particular I would like the authors to clarify on the following points:

Definition of polarization factor p is not clear. Is it the same as anisotropy?

What is r_norm in formula (9)? Is it normalization polarization factor? It is very hard to follow since the description of methods is poorly written.

According to the definition of anisotropy (subsection “Quantification of fluorophore alignment with Confocal LC-PolScope”), why would a random network have 50% anisotropy (Figure 1D)? I would expect I_0 = 1, I_90 = 0, I_45 = 0.5, I_135 = 0.5 and hence a = 1, b = 0, c = 2 and therefore anisotropy = 1.

Figure 1F: Early furrow ingression, the polarization factor varies in a huge range. It is therefore unreliable to say the network is still random.

Figure 1J: looks like anisotropy starts to reduce at 60 sec while ingression starts at ~ 90 sec (Figure 1I). So it does not look like "Contraction of an isotropic actin network initiates cleavage furrow ingression" as claimed.

Discussion section, "Our study shows that disordered actomyosin networks can generate sufficient mechanical tension to initiate cleavage furrow ingression in vertebrate cells": This is of low confidence as mentioned above.

Subsection “Equatorial actin filaments reorient on planar cortex regions”: "While these data do not rule out that local furrowing facilitates actin filament alignment, they show that planar network contraction is sufficient to induce substantial alignment." Comment: the network is not only simply planar, but also part of the ring. Alignment would occur along the ring (and this is expected), including the part on the planar network.

Figure 4A–D, post–cut time should be reported to tell whether cells were imaged at the same post–cut time.

"Mechanical coupling" is mentioned at a few places, but what does it mean? What is coupled to what?

Title: "Actomyosin contracts as a network to drive cytokinesis in vertebrate cells". Comment: The data did not convince if the whole network contracts or part of it forms a ring which then contracts.

Reviewer #2:

Animal cells execute cytokinesis by ingression of the cleavage furrow that is driven by contraction of the ring–like actomyosin network at the cell equator. The details of the dynamic organization of actin filaments in the ring are not well understood. The authors employed fluorescence polarization microscopy to determine the anisotropy of actin filaments in fixed and live cells, and detected gradual alignment of actin filaments during furrow deepening. They also performed laser microsurgery experiments and discovered an anisotropy in the cortical mechanical tension at the cell equator.

Although Fishkind and Wang, 1993 already demonstrated an increase of anisotropy of actin filaments at the equatorial cortex during cytokinesis of mammalian cultured cells using fluorescence polarization microscopy in the 90's, it was in fixed cells with a non–confocal set–up and thus the z– and time–resolution was not high. It is of significant interest to revisit this issue using modern microscopy technology, which has progressed in the last two decades. Indeed, the images of fixed and live interphase cells by a confocal LC–PolScope (Figure 1A and H) are amazing. However, unfortunately, there are many points to be clarified or improved as below, which would prevent publication of this interesting work in the current form. The experimental evidence doesn't seem to be sufficient for discussions with physical terms such as "dissipation" or" force feed–back".

1) Fluorescence polarization microscopy is more powerful for the anisotropy in the X–Y plane than that in a plane parallel to the Z–plane. Indeed, Fishkind and Wang (1993) examined the anisotropy in the X–Y plane in a similar scheme to that used for Figures 3 and 4. Why wasn't the confocal LC–PolScope used for the observation of the bottom of the cell (after fixation if necessary)? How significant is the motion artifacts in dividing cells?

2) In general, the anisotropy measurement depends on the relative scale between the spatial frequency of the target structure and the spatial resolution of the imaging. Imagine an infinitely repeating orthogonal grid of 100 µm interval. If the measurement is done at the scale of 1 mm or larger, the anisotropy of this structure would be uniformly 0. On the other hand, at the resolution of 10 µm, the anisotropy would be non–uniform, i.e., >0 on a line while 0 between the lines. This would result in >0 value after spatial averaging. This means that, even for the same structure, a smaller anisotropy value would be obtained when the spatial resolution becomes lower. Conversely, with a constant spatial resolution, isotropic shrinkage of a network structure would result in a smaller anisotropy value.

In the actual measurement of the cortical actin network, the distribution of the spatial frequencies is complex and can range from ~7 nm (the diameter of a single actin filament), 10~100 nm (filament–to–filament distance in a bundle such as a microvillus, a sarcomere or a stress fiber), or bigger (~µm). The imaging resolution is limited by the optics (wavelength x0.61/NA ~200 nm), the pixel resolution (this depends on the pixel size of the cameras, not clearly described) and the details of image processing/analysis. Roughly speaking, the spatial frequency of a loose actin network would be 50~500 nm and is roughly at the same order with the imaging resolution. Thus, the slight decrease of the anisotropy detected in Figure 1 might be able to be explained as a consequence of the uniform shrinkage of an isotropic network instead of the alignment of the filaments. A good theoretical argument or an experimental demonstration against this possibility should be necessary.

3) Possible influences of the local geometry of the cell surface and the thickness of the cortical actin network on the anisotropy measurement have not been sufficiently considered/discussed. Is the assumption that the cortical actin structure is a smooth sheet without thickness realistic? The enrichment of microvilli in the cleavage furrow has been reported in mammalian cells and sea urchin embryos (eg. Yonemera 1993 https://www.ncbi.nlm.nih.gov/pubmed/8421057 and http://gvondassow.com/Research_Site/Picture_of_the_week/Entries/2010/2/23_Microvilli_on_the_sea_urchin_zygote.html). In the author's own data, the actin cortex seems thicker in the furrow (e.g. Figure 2F). How uniform is the anisotropy along the direction of the thickness (i.e. perpendicular to the cortex)?

4) Related to the above point, a major issue is that not even a single pair (of 0 and 90 degree polarization, or a quadruplet of 0, 45, 90 and 135 degree polarization) of the actual images of dividing cells captured by their fluorescence polarization scopes has been shown. With the LC–PolScope, the anisotropy should be able to be calculated for each camera pixel. On the other hand, it is not obvious whether the averaged value for a 2 µm x 2 µm area, which include significant amounts of the extracellular space and the non–cortical cytoplasm, is an appropriate descriptor of the cortical nisotropy. Representative examples of the actual images of both the fixed and live cells (as they are obtained with different microscope setups and analyzed in different ways) should be presented. For the fixed cells observed by the LC–PolScope, for example, both the pseudo–colored raw polarity images as in Figure 1A and H and the calculated anisotropy images, which must have been made for drawing the Figure 1F and G graphs, should be added in the main figure. Individual grayscale images of different polarity angles should also be shown as figure supplements. For the live observation, examples for the central and the bottom z–sections with or without blebbistatin treatment in time course should be presented.

5) The live anisotropy imaging of the central z–sections (Figure 1I, J and Figure 2E) was performed using a set–up with two linear emission polarizers and analyzed along the outlines of the cells through a lengthy and complex procedure of image analysis, including watershed segmentation and B–spline fitting. A subtle difference in these processes can have a significant influence on the final anisotropy values. More detailed information should be provided, i.e., examples of each steps of image processing, the outline determined by the segmentation, a curve with the anchoring points obtained by the spline–fitting and the angles of the cortical sheet etc. overlaid on the close–up of a furrow, probably as figure supplements. In relation to the above point 3, the lack of the drop of the anisotropy after blebbistatin treatment might be a consequence of the lack of deep ingression and its influence on the calculation of the anisotropy. A proper control to separate biochemical/biophysical effects from the geometrical/image analysis effects would be necessary (e.g. artificial deformation of a metaphase cell). Or, does the blebbistatin show the same effect on the equatorial actin structure at the bottom of the cell observed in the same setup as in Figures 3 and 4?

6) The quantification of the fluorescence anisotropy at the bottom section of the cells (Figure 3H and 4G) was done by a ratiometry between the two images obtained with perpendicularly (0 and 90 degrees) placed linear emission polarizers. By this way, however, the anisotropy in the 45 or 135 degree direction can't be detected. This can easily be understood by imagining a long filament bundle placed at the 45 degree angle, for example. It would look exactly identical in the two images acquired with 0 and 90 degree polarizations, respectively (irrespective of the relative angle of the fluorophore's dipole moment). This highly anisotropic structure can't be distinguished from a uniform isotropic object such as fluorescent plastic with random fluorescence dipole orientation! Actually, "Ratio H/V" in Figure 1—figure supplement 4D is equal to 1 every 90 degrees at 45, 135, 225 and 315 degrees (this also indicates that the axes of polarization are at 0 and 90 degree angles relative to the camera).

The information about the anisotropy in the 45 and 135 degree directions lost at the image acquisition can't be compensated for by post–imaging computational analysis. Indeed, in Fishkind and Wang (1993), the spindle axis of each cell was carefully oriented parallel or perpendicular to the angles of polarization by using a rotatable stage. However, I couldn't find any description about the relative orientation between the angles of polarization and the cell division axis in this manuscript. Was it random (as Figure 1—figure supplement 4D suggests) or adjusted to a fixed angle?

7) Fishkind and Wang (1993) calculated (F_parallel – F_perpendicular)/F_parallel + F_perpendicular) (here, F_ denotes the fluorescence intensity) as a parameter for a preferential orientation of actin filaments instead of the simple ratio, F_parallel/F_perpendicular, which is used in this manuscript. What is the rationale for the simple ratio?

In formula (9), p_iso, which was defined in the formula, is a natural extension of the above formula by Fishkind and Wang while r_corrected is derived from the simple ratio (formula (3)). How could these values be linearly correlated as in formula (9)? What's the rationale for this formula?

8) The above 45 and 135 degree angle issue (point 6) is also relevant for the live imaging of the central z–sections (Figure 1I and J, 2E). The regression with metaphase cortices as a model (Figure 1—figure supplement 4D) is effective for rectifying the over– or under–estimated anisotropy due to the orientation of the cortex. However, it is of no use for restoring the lost anisotropy along the 45 or 135 degree directions that might arise independently of the orientation of the cortex but lost at the acquisition.

9) Release or expulsion of filaments from the contractile ring has been reported in fission yeast and HeLa cells (https://elifesciences.org/content/5/e21383, http://www.nature.com/articles/ncomms11860). Could a similar process be a simpler explanation for the observed decrease of the fluorescence anisotropy at the furrow in the central z–sections (Figure 1)? Actually, filaments roughly perpendicular to the furrow cortex are detected in the Center Section/Late Ingression panel of Figure 3C. This would also be able to account for the lack of the drop in the anisotropy after the blebbistatin treatment (Figure 2).

10) The displacement of the cortex after laser surgery is primarily caused by a viscoelastic response of the remaining cortical network. After the perpendicular cut (Figure 4 A and C), there remained almost no flanking actin structure that linked the upper and lower sides of the cut. On the other hand, after the parallel cut (Figure 4 B and D), there remained massive actin structures next to the lesion. These remaining links between the left and right sides of the lesion might resist against the deformation. Even if the tension was totally isometric, the same results might be observed. In a word, the comparison is not fair. What happens if a circular lesion sufficiently smaller than the width of the ring is made? Does the hole expand anisotropically? Conversely, what would happen if the 'Parallel cut' is made across the entire length of the equator?

Reviewer #3:

The paper by Gerlich and colleagues investigates an important question pertaining to how actin filaments are organized during cytokinesis in cultured mammalian cells. The findings described are interesting, but not totally novel. This is due to the fact that essentially similar findings have been reported by Fishkind and Wang in a seminal paper in JCB in 1993. However, this itself shouldn't undermine the work of Gerlich and colleagues, since they use better time–resolved approaches to re–investigate this important question. I also believe it is important to revisit old classic models with improved technology.

In general, I like the study, but I thought a simple experiment that could have been done is to carry out the laser cutting experiments in low doses of paranitroblebbistatin or jasplakinolide to determine if the tension generated in the aligned filaments is dependent on myosin II or actin disassembly. I realize the authors have shown that the transition to an anisotropic state depends on myosin II activity, but this is done with high doses of pn–blebbistatin. This simple experiment will provide a functional and molecular touch to the filament organization they describe.

[Editors’ note: what now follows is the decision letter after the authors submitted for further consideration.]

Thank you for resubmitting your work entitled "Actomyosin contracts as a randomly oriented network to initiate cytokinesis in vertebrate cells" for further consideration at eLife. Your revised article has been favorably evaluated by Anna Akhmanova (Senior editor) and three reviewers, one of whom, Mohan Balasubramanian is a member of our Board of Reviewing Editors.

The manuscript has been improved but there are a large number of remaining issues that need to be addressed before acceptance, as outlined below.

Please note that even though these concerns are all potentially fixed with some rewriting, it is nonetheless essential that you pay full attention to them and address them. A final decision will be made by the editors and will depend crucially on your responses and modifications to the text.

Essential revisions:

1) The filament sliding model is mentioned in the Introduction as a possible model and the suggestion that the cytokinetic ring contraction might be driven by myosin sliding anti–parallel actin filaments, but the authors don't get back to these ideas in the discussion to disseminate whether their work has helped to shed light on these issues.

2) The authors also fail to discuss their findings with respect to the work of Fishkind and Wang, 1993 which already indicates network alignment in the early anaphase (Figure 6 in Fishkind and Wang, 1993).

3) The claim by the authors that the data indicates that 'cytokinetic cleavage furrow ingression initiates by contraction of a randomly oriented actomyosin network' is misleading as it indicates that a global network contraction would lead to the localized furrow ingression. And the authors and others have shown that locally increased myosin activity is most likely the driving factor (Wollrab et al., 2016). The present data does not show how the contraction of a randomly oriented actin network would lead to the furrow ingression without alignment of filaments.

4) It is not clear how the authors compute the normalized polarization factor. Neither in the results part nor in the Materials and methods section is the formula mentioned.

5) In connection to this are also some comments missing about the precision of the polarization experiments: given the huge spread in the normalization of the polarization factor for aligned actin filaments (0.75–1.5!!!), how sensitive will the method be for changes in the cortex alignment. I.e. how many filaments in the cortex have to be aligned so that the polarization factor differs significantly from the cortex value?

6) Subsection “Contraction of a randomly oriented actin network initiates cleavage furrow ingression”: Given the rather limited time resolution and sensitivity of the polarization measurements, the last statement should be made more carefully (especially as later measurements with TIRF do indicate an earlier filament alignment).

7) Subsection “Contraction of a randomly oriented actin network initiates cleavage furrow ingression”: I don't think that the authors referenced correctly here. I would expect to see: Chugh, P, G. Charras, G. Salbreux, and E.K. Paluch. 2017. Nat. Cell Biol. 19: 689–697. Also, later in the Discussion, as this work studies cortex tension and cytoskeletal architecture.

8) Subsection “Equatorial actin filament reorientation depends on myosin II activity”: It is interesting to see that actin accumulation at the equator is not myosin dependent. But it might be worth a word to mention that the cortex thickness seems not to be altered despite a higher actin content. This indicates again that the actin is aligned.

9) Subsection “Equatorial actin filament reorientation depends on myosin II activity”: In the context of myosin driven actin accumulation, the work of Wollrab et al. should be discussed here as they analysed in detail the recruitment and activity of myosin during ring contraction (Wollrab et al., 2016).

10) Subsection “Equatorial actin filaments reorient on planar cortex regions”: Important, now the authors stated that they detect alignment together with the onset of furrow ingression. It would be good to point out that the improved spatial resolution increased the sensitivity for changes in filament alignment and in contrast to the earlier experiments where they were not able to detect any changes in alignment at such early time points.

11) Subsection “Cortical tension is highly directional at the cell equator”: How did the authors look at cortical flows? What is their definition of long vs short range?

12) Please see figure comments regarding the micro–surgery experiments.

13) Discussion section: The discussion is very hand waving and needs thorough rewriting. It seems that out of nothing, the authors say now that everything is driven by local myosin activity. This is well possible, but then the observed network alignment is not a big deal, and the question remains how the myosin activity is localized to the ring. The authors fail to put their work in context with earlier work, such as Fishkind and Wang, how the experimental improvements help in understanding the network organization during cytokinesis, and how their findings will help to solve the ongoing debate about the most conclusive model.

14) “Our study shows that disordered actomyosin networks can generate sufficient mechanical tension to initiate cleavage furrow ingression in vertebrate cells”: The authors do not test whether the disordered actomyosin network generates enough tension for furrow ingression. Especially the blebbistatin experiments show that there are signals fostering actin filament polymerization at the furrow site without ingression. To support the above statement, one would have to do a laser ablation next to the developing furrow ingression and observe, if and how the ingression evolves further or not.

15) “This suggests that vertebrate cells align the actomyosin network

directly at the site of highest contractility, whereby lateral cortical movements adjacent to the cell equator”: It's not very clear what the authors want to point out here. Cells do not align the actomyosin at the site of contractility, contractility itself aligns generally the actin filaments.

16) “Given that actomyosin rings mediate various other biological processes, including cellular wound healing and developmental morphogenesis, it will be interesting to further investigate the intricate relationship between contractile forces and actin network organization”: Very generic statement. Can be left out.

17) Major point 1: Interpretation of the low anisotropy regions in the mid–plane

The metaphase cell in Figure 1E shows a clear trend that the regions with strong signals in the average image show lower color saturation in the orientation map (white), hence, lower polarisation. This backs up my arguments about the scaling effect (major point 2 in my previous comments), i.e., denser the structure, lower the calculated anisotropy. Apart from the theory, the authors should provide good reasoning for the interpretation of "white" signal at the furrow as perpendicular alignment while those in the metaphase cell are clearly not representing such alignment.

18) Major point 2: Comparison with a previous report

The polarization microscope setups used in this study are most straight–forward and sensitive in detection of the polarization within the X–Y plane. Indeed, the pioneering work with a similar setup by Fishkind and Wang focused on this. Honestly, I don't understand why the authors insist on not taking this approach (e.g. flatten a cell in a way similar to Figure 3) on their LC–Polscope. This should allow straight–forward visualization of the filament alignment and direct comparison with the results by Fishkind and Wang. Anyway, Figure 3 data, in principle, provide a live version of Fishkind and Wang, which is indeed a drastic improvement. Similarities, differences and improvements should be properly discussed in Discussion section, including the difference in the data analyses (simple ratiometry in Figure 3 vs (F_parallel – F_perpendicular)/(F_parallel + F_perpendicular in Fishkind and Wang).

19) Major point 3: Laser surgery in Figure 4

As I pointed out as Major point #10 in my previous comments, the comparison between "perpendicular" vs "parallel" cuts is not fair. Why a smaller round hole was not tried or is not suitable should be explained.

20) Subsection “Contraction of a randomly oriented actin network initiates cleavage furrow ingression”.

As a sample with isotropic fluorescence dipole distribution, we imaged fluorescent plastic (Figure 1C). We then normalized the polarization factor to be in a range between 1 and 0 for maximally aligned fluorophores (stress fibres) and isotropic plastic, respectively.

I expect the isotropic plastic to have a polarisation factor of 0.5 much akin to the metaphase cortex. Is there something specific about the substrate?

21) Figure 1G and 1F.

During late stages of anaphase, the normalised polarisation at the poles appear to be more than 0.6 (mean) in Figure 1F and less than 0.6 in Figure 1G. Can the authors explain the discrepancy?

22) Figure 1G.

The authors seem to let go of a major point by not comparing the normalised potential of either equator or poles for different time points. This would have made a nice point regarding orientation of actin over time.

23) Laser Microsurgery experiment:

This is indeed a very interesting observation. The cut in the parallel direction on the cell cortex doesn't induce cortex movement which is in stark contrast to a similar cut made in the perpendicular orientation. It will however be interesting to see whether the parallel slit can induce outward movement if its horizontal dimension (which is a line currently) is increased. If so, then does this minimum lateral dimension (when outward motion is achieved) correspond to the FWHM of the anisotropic actin network measured in the paper (4.4.um)?

24) As a general interest it would be interesting to know, what happens to these cells after the cut is made. Do these cells show a healing response or abort cytokinesis and undergo cell death.

Issues with figures

Figure 1D: The question marks can be left out.

Figure 1E) The authors might want to discuss why the cortical actin shows parallel alignment along the plasma membrane due to the overall confinement of the actin filaments along the membrane. And that the white area along the furrow indicates the alignment of filaments along the z axis. Since this kind of measurements are not common for the major audience, a careful description and discussion are important.

Figure 1G) Given the spread of the data, tracing the difference of individual cells would be helpful by connecting the corresponding red and blue dots.

Figure 2B: The cell cortex appears jagged and the 0 and 90 degree channels do not seem always properly aligned (very clear at 330sec). Why is that the case? Channel alignment is essential for the polarization analysis.

Figure 2—figure supplement 1E: It would be instructive if the authors could first show the raw intensities before computing the ratio.

Figure 2—figure supplement 1J:Hhow can you obtain negative values for the actin cortex thickness?

Figure 3G: The plot indicates that changes in network orientation appear at about 100sec. this would mean that alignment would go hand in hand with the furrow ingression. The authors should discuss this point as it is in conflict with the earlier conclusion that alignment can be only detected at later time points.

Figure 4C, D: The authors should show a bleach control to show that their ablation protocol really cuts the actin network. They also should provide data to indicate whether the plasma membrane stays intact or not during the procedure.

In addition, it would be very instructive for the authors conclusion to perform a laser ablation of the network adjacent to the cytokinetic ring in the beginning of furrow ingression and to observe whether the contraction progresses or not. If the global contraction of the random actin network is necessary for the cytokinetic ring, then this ablation should perturb the process.

Figure 5: The schematic looks nice, but is not very instructive. In addition, the model is not properly formulated (i.e. in a theoretical way) and the claims are not presented in clear connection to the presented data. How is the equatorial contractility generated in the first place (–> increased local myosin activity)? how to explain lateral cortex displacement without increase of tension (–> less connectivity in the network? Shorter filaments?) How is the higher tension along the equator generated (–>via filament alignment)?

Figure 1—figure supplement 1.

The area for selected at the poles is mentioned as 16um in the figure against 10um in the text (Materials and methods section).

Figure 2D and 2E

Curvature change in Figure 2D appears to reduce post 350 second. No such trend however is observed for Figure 2E for essentially the same measurement.

Figure 2F and 1G.

In Figure 2F, there appears to be no net change in normalised emission ratio, indicative of polarisation, at the poles. However, in Figure 1G, there seems to be a modest increase in normalised polarisation.

Figure 4G.

It would be interesting to know whether the increasing movement of the network on ablation scales with increased actin alignment.

eLife. 2017 Nov 6;6:e30867. doi: 10.7554/eLife.30867.020

Author response


[Editors’ note: the author responses to the first round of peer review follow.]

[…] Reviewer #1:

Spira et al., present a valuable new approach to spatiotemporally monitor changes in actin filament organization during cleavage furrow ingression. Previously, EM and quantitative fluorescence microscopy–based assays have visualized the formation of discreet foci of actin filaments prior to cleavage furrow formation. The method proposed here, fluorescence polarization microscopy, provides an opportunity to monitor dynamics of actin filament organization during cleavage furrow ingression and link it directly to ring contraction in a live setting. Based on their work the authors conclude that the, (a) actin reorientation appears not to be critical for transducing forces leading to the early stages of cleavage furrow ingression, (b) actin filament reorientation is a consequence of mechanical input from myosin II, and (c) filament reorientation is a consequence of the mechanical coupling along the contractile ring. However I have a few concerns that I would like the authors to address before publication.

The results presented in this manuscript are largely consistent with those observed in other cellular systems such as sea urchin and fission yeast, namely that filament reorganization occurs much later during cleavage furrow ingression and is not necessarily a cause for the initiation of furrow formation which reduces the novelty of the authors' conclusions.

That the actin network transforms from a largely isotropic cortical meshwork in metaphase cells into an anisotropic network shortly after the onset of anaphase onset has already been reported earlier (see Fishkind and Wang, 1993). Understandably, the present work provides important dynamic insights along with data to suggest presence of radial forces along the cell equator that drive ring contraction and as such is interesting.

However the authors should clarify the following concerns before publication. In general, the description of their methods needs better articulation. In particular I would like the authors to clarify on the following points:

We thank the reviewer for appreciating our experimental approach and the biological significance of our findings. We are also grateful for pointing out that the methods description should be improved. We have addressed all concerns by extending the documentation of fixed and live cell data in three new supplemental figures (new Figure 1—figure supplement 1 and Figure 2—figure supplement 1 and 2) and by extensive rewriting of the Results and Materials and methods sections, as explained below.

Definition of polarization factor p is not clear. Is it the same as anisotropy?

The terminology was indeed not well explained in the original manuscript. The polarization factor expresses the degree of actin network anisotropy measured by LC-PolScope microscopy, and it is calculated by normalizing the measured fluorophore anisotropy to reference values for fluorescent plastic (polarization factor = 0) and AlexaFluor 488-phalloidin-stained stress fibers (polarization factor = 1). This is now stated in the main text and explained in detail in the Materials and methods section.

What is r_norm in formula (9)? Is it normalization polarization factor? It is very hard to follow since the description of methods is poorly written.

The r norm in formula (9) indicates the normalized emission ratio, which we calculated to measure actin network organization in live mitotic cells with the live-cell confocal set-up. The live-cell confocal set-up excites the probe with the linearly-polarized laser aligned with the optical table and sequentially records two images with perpendicularly-oriented polarization filters in the emission path, horizontal (H) and vertical (V) relative to the optical table. We used this microscope for imaging of cleavage furrow ingression in live cells, as the LC-PolScope acquired images at a substantially slower rate, resulting in motion artefacts.

To clarify the measurement procedures, we included raw images and intermediate processing results to revised Figure 1 and Figure 2 and added supplementary figures illustrating the analysis procedure for both microscopy set-ups. We use the term normalized polarization factor to interpret alignment of actin filaments using the LC-PolScope setup and normalized emission ratio for images acquired with linear emission polarizers in the live-cell set-up.

According to the definition of anisotropy (subsection “Quantification of fluorophore alignment with Confocal LC-PolScope”), why would a random network have 50% anisotropy (Figure 1D)? I would expect I_0 = 1, I_90 = 0, I_45 = 0.5, I_135 = 0.5 and hence a = 1, b = 0, c = 2 and therefore anisotropy = 1.

The analysis methodology and rationale behind the predicted network polarization values was indeed not well explained in the original manuscript. We hypothesized that in a 200 nm-thin metaphase cell cortex, actin filaments are predominantly aligned with the plane of the cell surface, but oriented in random directions parallel to the cell surface. If this model were correct, then this should yield a normalized polarization factor (see above for definition) of 0.5 when the cell cortex is imaged in an orientation perpendicular to the focal plane, based on the mixture of fluorophore dipoles aligned with the focal and cortical plane, as well as dipoles that orient perpendicular to focal plane. We now specify the assumptions about metaphase cortex organization that would predict a polarization factor of 0.5 and present this as a model to be tested by experiments. We further provide extensive illustration of intermediate processing results and rephrased the main text and Materials and methods section for clarification.

Figure 1F: Early furrow ingression, the polarization factor varies in a huge range. It is therefore unreliable to say the network is still random.

We agree that the high variability and low sample number limited the interpretation of the original data set. The variability in the data is likely attributed to both imaging noise and biological variation. To improve the accuracy of median estimation, we acquired and analysed 80 additional cells (revised Figure 1G). Moreover, we binned the data in 4 instead of 3 time windows to achieve higher temporal resolution. The extended data analysis confirms that during early furrow ingression (101-150 s) the network contains randomly oriented actin filaments. These findings are also consistent with our live cell fluorescence ratio measurements shown in Figure 1J. Overall, the extended data corroborates the conclusion that cleavage furrow ingression initiates by contraction of a randomly oriented actin network.

Figure 1J: looks like anisotropy starts to reduce at 60 sec while ingression starts at ~ 90 sec (Figure 1I). So it does not look like "Contraction of an isotropic actin network initiates cleavage furrow ingression" as claimed.

We thank the reviewer for pointing out potential ambiguity of data interpretation by visual inspection. We have therefore performed additional analyses and statistical testing to determine the onsets of actin cytoskeleton re-orientation and cleavage furrow ingression. To objectively measure cleavage furrow ingression, we applied circular fits to cortex at centre position between the segregating chromosome masses (new Figure 2C – E). We then performed statistical testing comparing cortex curvatures of different time points to determine the onset of cleavage furrow ingression. We also performed statistical testing comparing fluorescence anisotropy between different time points to determine the onset of actin network alignment (new Figure 2F). These new data show that furrow ingression initiates at 90 s, while significant actin network only occurs at 120 s after anaphase onset. These measurements corroborate that a randomly oriented actin network initiates cleavage furrow ingression.

Discussion section, "Our study shows that disordered actomyosin networks can generate sufficient mechanical tension to initiate cleavage furrow ingression in vertebrate cells": This is of low confidence as mentioned above.

We agree that the low amount of sample points in the original manuscript was suboptimal. However, our extensive new data and analyses (see response above) provide strong support for this important statement.

Subsection “Equatorial actin filaments reorient on planar cortex regions”: "While these data do not rule out that local furrowing facilitates actin filament alignment, they show that planar network contraction is sufficient to induce substantial alignment." Comment: the network is not only simply planar, but also part of the ring. Alignment would occur along the ring (and this is expected), including the part on the planar network.

This was indeed phrased in a misleading way. We intended to refer to local curvature, which was proposed to be relevant for inward-directed network movement towards the leading edge of the cleavage furrow (Dorn et al., 2016). We thank the reviewer for pointing out that this was unclear. We think that this statement does not add much to the interpretation of our data and therefore removed it from the revised manuscript.

Figure 4A–D, post–cut time should be reported to tell whether cells were imaged at the same post–cut time.

We thank the reviewer for pointing out that the information on post-cut time was missing. The postcut time point is 0.9 s for all images, as indicated in the revised Figure 4A-D.

"Mechanical coupling" is mentioned at a few places, but what does it mean? What is coupled to what?

By the term “mechanical coupling”, we intended to highlight the fact that the contractile cortical zone is continuous along the equatorial cell circumference, as opposed to the orientation perpendicular to the equatorial cortex, where the contractile cortex is adjacent to low contractility cortical regions. To improve clarity, we rephrased the respective sections of the manuscript to avoid this term.

Title: "Actomyosin contracts as a network to drive cytokinesis in vertebrate cells". Comment: The data did not convince if the whole network contracts or part of it forms a ring which then contracts.

Our extensive new data corroborate that cleavage furrow ingression initiates by contraction of a randomly oriented network. At later cytokinesis stages, the degree of actin filament alignment remains relatively low, yet we cannot exclude that a small fraction of filaments forms a ring with parallel filaments. To improve the accuracy of the title, we rephrased: “Actomyosin contracts as a randomly oriented network to initiate cytokinesis in vertebrate cells”.

Reviewer #2:

Animal cells execute cytokinesis by ingression of the cleavage furrow that is driven by contraction of the ring–like actomyosin network at the cell equator. The details of the dynamic organization of actin filaments in the ring are not well understood. The authors employed fluorescence polarization microscopy to determine the anisotropy of actin filaments in fixed and live cells, and detected gradual alignment of actin filaments during furrow deepening. They also performed laser microsurgery experiments and discovered an anisotropy in the cortical mechanical tension at the cell equator.

Although Fishkind and Wang, 1993 already demonstrated an increase of anisotropy of actin filaments at the equatorial cortex during cytokinesis of mammalian cultured cells using fluorescence polarization microscopy in the 90's, it was in fixed cells with a non–confocal set–up and thus the z– and time–resolution was not high. It is of significant interest to revisit this issue using modern microscopy technology, which has progressed in the last two decades. Indeed, the images of fixed and live interphase cells by a confocal LC–PolScope (Figure 1A and H) are amazing. However, unfortunately, there are many points to be clarified or improved as below, which would prevent publication of this interesting work in the current form. The experimental evidence doesn't seem to be sufficient for discussions with physical terms such as "dissipation" or" force feed–back".

We are delighted that the reviewer appreciates our technical approaches and the importance of our findings. We are grateful for the thoughtful comments on where the manuscript needs clarification and the detailed suggestions how to improve the analysis and discussion of our data. We have added extensive new data to better illustrate the analysis procedures and have rephrased the discussion along the lines suggested by the reviewer, as explained in detail below.

1) Fluorescence polarization microscopy is more powerful for the anisotropy in the X–Y plane than that in a plane parallel to the Z–plane. Indeed, Fishkind and Wang (1993) examined the anisotropy in the X–Y plane in a similar scheme to that used for Figures 3 and 4. Why wasn't the confocal LC–PolScope used for the observation of the bottom of the cell (after fixation if necessary)? How significant is the motion artifacts in dividing cells?

Acquisition of a single optical section with the LC-PolScope requires recording of 5 image frames at different polarization angles. Our LC-PolScope implementation enabled to record at a frame rate of 5 s per channel. The >20 s time-lapse between recording the first and last polarization frame resulted in a substantial cortex displacement during cleavage furrow ingression in live cells, which we could not compensate by image registration. For the study of actin organization in live anaphase cells, we hence had to rely on the live-cell set-up with two perpendicularly-oriented polarization filters in the emission path, which was much faster as it did not require synchronization between microscope-controlling software and the LC controller.

Regarding the imaging of flat surfaces, we have now included original image data showing live-cell images of the bottom surface in confined anaphase cells (Figure 3E). We still prefer to use the centre sections for quantifications in most other experiments, as we can then apply accurate cortex segmentation excluding filopodia from the analysis. Moreover, the cell confiner is not compatible with blebbistatin treatment (see point reviewer 2 point 5).

2) In general, the anisotropy measurement depends on the relative scale between the spatial frequency of the target structure and the spatial resolution of the imaging. Imagine an infinitely repeating orthogonal grid of 100 µm interval. If the measurement is done at the scale of 1 mm or larger, the anisotropy of this structure would be uniformly 0. On the other hand, at the resolution of 10 µm, the anisotropy would be non–uniform, i.e., >0 on a line while 0 between the lines. This would result in >0 value after spatial averaging. This means that, even for the same structure, a smaller anisotropy value would be obtained when the spatial resolution becomes lower. Conversely, with a constant spatial resolution, isotropic shrinkage of a network structure would result in a smaller anisotropy value.

In the actual measurement of the cortical actin network, the distribution of the spatial frequencies is complex and can range from ~7 nm (the diameter of a single actin filament), 10~100 nm (filament–to–filament distance in a bundle such as a microvillus, a sarcomere or a stress fiber), or bigger (~µm). The imaging resolution is limited by the optics (wavelength x0.61/NA ~200 nm), the pixel resolution (this depends on the pixel size of the cameras, not clearly described) and the details of image processing/analysis. Roughly speaking, the spatial frequency of a loose actin network would be 50~500 nm and is roughly at the same order with the imaging resolution. Thus, the slight decrease of the anisotropy detected in Figure 1 might be able to be explained as a consequence of the uniform shrinkage of an isotropic network instead of the alignment of the filaments. A good theoretical argument or an experimental demonstration against this possibility should be necessary.

We thank the reviewer for pointing to these potential technical limitations, which we had not discussed in our original manuscript. Our analysis computes the degree and orientation of actin filament alignment within an ROI of 2 µm length and 0.6 µm width. The dominant orientation and the polarization factor are moments of the angular distribution of dipoles over the analysed region. The dominant orientation is the zeroth angular moment (mean) and the polarization factor is the first angular moment (standard deviation) around the mean. If the actin network is assumed to have the highest spatial period of 200 nm (matching the resolution limit of optics), shrinkage of uniform network will not affect measured parameters as the analysis window of 2 µm is an order of magnitude larger. If the actin network is assumed to have even higher spatial period (e.g., 500 nm), we would resolve them. All our data is acquired with Nyquist sampling and we detected the cortex as a continuous stretch of intensity, thus spatial period between filaments in our cells is finer than 200 nm. Hence, the detected changes in fluorescence anisotropy report on net filament orientation within the ROI rather than network contraction.

3) Possible influences of the local geometry of the cell surface and the thickness of the cortical actin network on the anisotropy measurement have not been sufficiently considered/discussed. Is the assumption that the cortical actin structure is a smooth sheet without thickness realistic? The enrichment of microvilli in the cleavage furrow has been reported in mammalian cells and sea urchin embryos (eg. Yonemera 1993 https://www.ncbi.nlm.nih.gov/pubmed/8421057 and http://gvondassow.com/Research_Site/Picture_of_the_week/Entries/2010/2/23_Microvilli_on_the_sea_urchin_zygote.html). In the author's own data, the actin cortex seems thicker in the furrow (e.g. Figure 2F). How uniform is the anisotropy along the direction of the thickness (i.e. perpendicular to the cortex)?

The local geometry of the cell surface and the thickness of the cortical actin network are indeed important aspects that need to be considered to correctly interpret anisotropy measurements. We did indeed exclude microvilli protruding from cortex regions by segmenting thin cortical contours for anisotropy measurements. In the original manuscript, we had illustrated the measurement regions by squares around the actual segmented cortex regions to avoid masking the original image data. We recognize based on the reviewer’s concern that this was misleading, and therefore now indicate the polar and equatorial measurement regions by arrowheads in the main figure and show the actual segmentation masks side-by-side the anisotropy images in Figure 1—figure supplement 1B.

We thank the reviewer for pointing out that changes in cortical thickness might also affect the anisotropy measurements. We had not considered this in our original analysis and hence performed new experiments to measure the cortical thickness based on relative positions of a plasmamembrane-associated marker and an actin marker, as reported in Clark et al., 2013. We measured a cortical thickness of ~200 nm in metaphase cells, which was similar in furrow regions of anaphase cells (new Figure 2—figure supplement 1 G-J). We did detect a significantly thicker cortex in interphase cells as previously reported (Chugh et al., 2017), validating the sensitivity of our measurement procedure. Overall, these data show that the observed changes in fluorescence anisotropies during cytokinesis progression cannot be attributed to changes in cortical thickness.

The reviewer further suggests measuring fluorescence anisotropies along line profiles perpendicular to the cell cortex. As the cortical thickness is below the resolution limit of our microscope, such measurements will not be informative. However, we think that the new data and improved illustration of image segmentation clarify that the detected fluorescence anisotropy changes are not due to changes in cortical thickness or local geometry effects.

4) Related to the above point, a major issue is that not even a single pair (of 0 and 90 degree polarization, or a quadruplet of 0, 45, 90 and 135 degree polarization) of the actual images of dividing cells captured by their fluorescence polarization scopes has been shown. With the LC–PolScope, the anisotropy should be able to be calculated for each camera pixel. On the other hand, it is not obvious whether the averaged value for a 2 µm x 2 µm area, which include significant amounts of the extracellular space and the non–cortical cytoplasm, is an appropriate descriptor of the cortical nisotropy. Representative examples of the actual images of both the fixed and live cells (as they are obtained with different microscope setups and analyzed in different ways) should be presented. For the fixed cells observed by the LC–PolScope, for example, both the pseudo–colored raw polarity images as in Figure 1A and H and the calculated anisotropy images, which must have been made for drawing the Figure 1F and G graphs, should be added in the main figure. Individual grayscale images of different polarity angles should also be shown as figure supplements. For the live observation, examples for the central and the bottom z–sections with or without blebbistatin treatment in time course should be presented.

We thank the reviewer for pointing out the incomplete documentation of raw and processed image data in our original manuscript. In the revised manuscript, we now show representative original images from the LC-PolScope (new Figure 1E and new Figure 1—figure supplement 1), as well as for the live-cell polarization filter setup (new Figure 2B, Figure 2—figure supplement 2, and Figure 3C). We also show the pseudo-colored raw polarity images for cells in cytokinesis (new Figure 1E) and the raw polarity images as calculated for Figure 1F and G (new Figure 1—figure supplement 1B).

Regarding the comment on the squared ROI, we would like to refer to the response to point #3. The graphical illustration of squares in the original figures was misleading, as the actual anisotropy measurements were performed within thin cortical ROIs fitted precisely to the cell contour (new Figure 1—figure supplement 1B).

5) The live anisotropy imaging of the central z–sections (Figure 1I, J and Figure 2E) was performed using a set–up with two linear emission polarizers and analyzed along the outlines of the cells through a lengthy and complex procedure of image analysis, including watershed segmentation and B–spline fitting. A subtle difference in these processes can have a significant influence on the final anisotropy values. More detailed information should be provided, i.e., examples of each steps of image processing, the outline determined by the segmentation, a curve with the anchoring points obtained by the spline–fitting and the angles of the cortical sheet etc. overlaid on the close–up of a furrow, probably as figure supplements. In relation to the above point 3, the lack of the drop of the anisotropy after blebbistatin treatment might be a consequence of the lack of deep ingression and its influence on the calculation of the anisotropy. A proper control to separate biochemical/biophysical effects from the geometrical/image analysis effects would be necessary (e.g. artificial deformation of a metaphase cell). Or, does the blebbistatin show the same effect on the equatorial actin structure at the bottom of the cell observed in the same setup as in Figures 3 and 4?

We thank for the suggestions how to improve the illustration of the image analysis procedure. We have included examples for each step of the image processing pipeline in the revised manuscript (new Figure 2—figure supplement 2) and extended and rephrased the main text and Materials and methods section for clarification.

To address the concern on potential geometry effects, we established a new analysis pipeline to measure cortex curvature at different time points. On this basis, we selected time points in which the absolute curvature of the equatorial cell cortex does not exceed the initial curvature in metaphase (new Figure 2C, D). We found that the polarization ratio significantly dropped at cortex curvatures that did not exceed those of metaphase cells (compare Figure 2D and 2F,G). Hence, the suppression of fluorescence anisotropy changes by blebbistatin cannot be solely explained by geometry effects.

We appreciate the suggestion to image the bottom surface of blebbistatin-treated cells under confinement. However, this is technically not feasible as blebbistatin is inactive in the confiner (i.e., blebbistatin also does not inhibit lateral furrow ingression in the confiner). This is likely due to blebbistatin adsorption to the polymer of the confinement chamber, as has been observed for other chemical compounds.

6) The quantification of the fluorescence anisotropy at the bottom section of the cells (Figure 3H and 4G) was done by a ratiometry between the two images obtained with perpendicularly (0 and 90 degrees) placed linear emission polarizers. By this way, however, the anisotropy in the 45 or 135 degree direction can't be detected. This can easily be understood by imagining a long filament bundle placed at the 45 degree angle, for example. It would look exactly identical in the two images acquired with 0 and 90 degree polarizations, respectively (irrespective of the relative angle of the fluorophore's dipole moment). This highly anisotropic structure can't be distinguished from a uniform isotropic object such as fluorescent plastic with random fluorescence dipole orientation! Actually, "Ratio H/V" in Figure 1—figure supplement 4D is equal to 1 every 90 degrees at 45, 135, 225 and 315 degrees (this also indicates that the axes of polarization are at 0 and 90 degree angles relative to the camera).

The information about the anisotropy in the 45 and 135 degree directions lost at the image acquisition can't be compensated for by post–imaging computational analysis. Indeed, in Fishkind and Wang (1993), the spindle axis of each cell was carefully oriented parallel or perpendicular to the angles of polarization by using a rotatable stage. However, I couldn't find any description about the relative orientation between the angles of polarization and the cell division axis in this manuscript. Was it random (as Figure Supplement 4D suggests) or adjusted to a fixed angle?

This is indeed an important technical concern, which we have taken into account by imaging only cells that had their spindle axis oriented along the linear emission polarizer filters, similar to Fishkind and Wang. We had selected only cells with a spindle axis oriented ± 20 degrees relative to X and Y axes. As this was described somewhat hidden in the Materials and methods section of the original manuscript, we extended the revised Materials and methods section and legend of the respective figures to clarify this concern.

7) Fishkind and Wang (1993) calculated (F_parallel – F_perpendicular)/F_parallel + F_perpendicular) (here, F_ denotes the fluorescence intensity) as a parameter for a preferential orientation of actin filaments instead of the simple ratio, F_parallel/F_perpendicular, which is used in this manuscript. What is the rationale for the simple ratio?

In formula (9), p_iso, which was defined in the formula, is a natural extension of the above formula by Fishkind and Wang while r_corrected is derived from the simple ratio (formula (3)). How could these values be linearly correlated as in formula (9)? What's the rationale for this formula?

In contrast to Fishkind and Wang, we use a polarized excitation beam to excite fluorescent dipoles. This makes the calculation of anisotropy more difficult and we cannot use the formula reported in Fishkind and Wang (1993). Because of this limitation, we measured relative changes of actin filament orientation over time based on a simple ratio between the images acquired with the horizontal and the vertical emission polarizers. We extended and rewrote the Materials and methods section to clarify how we calculated anisotropies with the two different microscope set-ups used in our study.

8) The above 45 and 135 degree angle issue (point 6) is also relevant for the live imaging of the central z–sections (Figure 1I and J, 2E). The regression with metaphase cortices as a model (Figure supplement 4D) is effective for rectifying the over– or under–estimated anisotropy due to the orientation of the cortex. However, it is of no use for restoring the lost anisotropy along the 45 or 135 degree directions that might arise independently of the orientation of the cortex but lost at the acquisition.

This is indeed a very important point that was not sufficiently discussed in the original manuscript. In these experiments, we also only imaged cells with a spindle axis of ± 20 degrees relative to the main X/Y axes of the image. This is now explained more clearly in the revised figure legend and extended Materials and methods section.

9) Release or expulsion of filaments from the contractile ring has been reported in fission yeast and HeLa cells (https://elifesciences.org/content/5/e21383, http://www.nature.com/articles/ncomms11860). Could a similar process be a simpler explanation for the observed decrease of the fluorescence anisotropy at the furrow in the central z–sections (Figure 1)? Actually, filaments roughly perpendicular to the furrow cortex are detected in the Center Section/Late Ingression panel of Figure 3C. This would also be able to account for the lack of the drop in the anisotropy after the blebbistatin treatment (Figure 2).

As explained in response to #3 and #4, we calculated fluorescence anisotropy in thin ROIs fitted to the cell cortex contour (see new Figure 1—figure supplement 1 and Figure 2—figure supplement 2). Filaments protruding into the cytoplasm hence do not affect the detected anisotropies in these regions.

10) The displacement of the cortex after laser surgery is primarily caused by a viscoelastic response of the remaining cortical network. After the perpendicular cut (Figure 4 A and C), there remained almost no flanking actin structure that linked the upper and lower sides of the cut. On the other hand, after the parallel cut (Figure 4 B and D), there remained massive actin structures next to the lesion. These remaining links between the left and right sides of the lesion might resist against the deformation. Even if the tension was totally isometric, the same results might be observed. In a word, the comparison is not fair. What happens if a circular lesion sufficiently smaller than the width of the ring is made? Does the hole expand anisotropically? Conversely, what would happen if the 'Parallel cut' is made across the entire length of the equator?

We thank the reviewer for pointing out that the local enrichment of F-actin in regions surrounding the cut could limit cortex displacement. We revisited the original data and found no evidence of higher accumulation levels of F-actin in regions surrounding the cut in either of the cutting directions. Hence, we do think that the measured differences in initial outward movement reflect an asymmetric distribution of tension.

We had previously performed experiments with cutting path lengths across the entire width of the equator, but found that such large cortical disruption causes cell explosion. While we agree that cutting small rings would be interesting, we currently do not have the resources to perform this experiment, as the first author of this study, who has carried out all laser microsurgery experiments, has already left the laboratory. We are convinced that the current large data set of >80 laser microsurgery experiments clearly demonstrates the asymmetric distribution of cortical tension at the cell equator and hope that the reviewer agrees that the proposed experiment is not essential for publication.

Reviewer #3:

The paper by Gerlich and colleagues investigates an important question pertaining to how actin filaments are organized during cytokinesis in cultured mammalian cells. The findings described are interesting, but not totally novel. This is due to the fact that essentially similar findings have been reported by Fishkind and Wang in a seminal paper in JCB in 1993. However, this itself shouldn't undermine the work of Gerlich and colleagues, since they use better time–resolved approaches to re–investigate this important question. I also believe it is important to revisit old classic models with improved technology.

In general, I like the study, but I thought a simple experiment that could have been done is to carry out the laser cutting experiments in low doses of paranitroblebbistatin or jasplakinolide to determine if the tension generated in the aligned filaments is dependent on myosin II or actin disassembly. I realize the authors have shown that the transition to an anisotropic state depends on myosin II activity, but this is done with high doses of pn–blebbistatin. This simple experiment will provide a functional and molecular touch to the filament organization they describe.

We thank the reviewer for the positive evaluation of our manuscript. We appreciate the suggestion to perform laser cutting in the presence of low-dose para-nitroblebbistatin or jasplakinolide. Unfortunately, these experiments are technically not feasible, as laser cutting requires cell confinement and the cell confiner chambers are not compatible with drug treatment (i.e., blebbistatin does not suppress cleavage furrow ingression). This is likely due to adsorption of the chemical to the polymer used for construction of the confinement chamber, as noted for other chemical compounds.

[Editors' note: the author responses to the re-review follow.]

Essential revisions:

1) The filament sliding model is mentioned in the Introduction as a possible model and the suggestion that the cytokinetic ring contraction might be driven by myosin sliding anti–parallel actin filaments, but the authors don't get back to these ideas in the Discussion to disseminate whether their work has helped to shed light on these issues.

We agree that it would be good to extend the Discussion and have revised it accordingly:

“Prior fluorescence polarization microscopy had shown preferential orientation of actin filaments along the cytokinetic cleavage furrow of vertebrate cells. […] The late onset and low degree of actin filament alignment within the equatorial cortex suggests a network contraction mechanism underlying cytokinetic cleavage furrow ingression in vertebrate cells, yet our data cannot rule out the possibility that at late cytokinesis stages some actin filaments form antiparallel arrays underneath a randomly oriented actin network.”

2) The authors also fail to discuss their findings with respect to the work of Fishkind and Wang, 1993 which already indicates network alignment in the early anaphase (Figure 6 in Fishkind and Wang, 1993).

We thank the reviewer for suggesting to discuss our findings in more depth, particularly regarding the relationship to the prior work by Fishkind and Wang. Figure 6 of the Fishkind and Wang study reports actin filament alignment at the bottom surface of strongly adherent NRK cells and classifies mitotic stages based on Hoechst-stained chromosomes without information on the cleavage furrow ingression state. The data hence do not provide information on whether actin filaments of the equatorial actomyosin cortex align before or after the onset of cleave furrow ingression. Moreover, Fishkind and Wang do not provide reference data from a structure with aligned actin filaments (e.g., stress fibers), and it hence remains unclear to which degree the filaments in equatorial actin network align. The authors of the prior study were also concerned about the limitation of their widefield set-up, which suffers from strong out-of-focus background noise. In the extended and revised Discussion section now comment on the technical innovations and put our findings in direct comparison to the Fishkind and Wang study:

“Prior fluorescence polarization microscopy had shown preferential orientation of actin filaments along the cytokinetic cleavage furrow of vertebrate cells. […] Yet, in combination with the fixed cell data, these experiments establish a detailed kinetic profile of actin network organization during cytokinesis progression.”

3) The claim by the authors that the data indicates that 'cytokinetic cleavage furrow ingression initiates by contraction of a randomly oriented actomyosin network' is misleading as it indicates that a global network contraction would lead to the localized furrow ingression. And the authors and others have shown that locally increased myosin activity is most likely the driving factor (Wollrab et al., 2016). The present data does not show how the contraction of a randomly oriented actin network would lead to the furrow ingression without alignment of filaments.

We thank the reviewer for pointing out that our model might be misconceived without specification of the equatorial position of the contractile network. We therefore rephrased the title for clarification: “Cytokinesis in vertebrate cells initiates by contraction of an equatorial actomyosin network composed of randomly oriented filaments”. We also rephrased Abstract, Introduction, and the legend of Figure 5 to specify the equatorial position of the contractile actomyosin network.

4) It is not clear how the authors compute the normalized polarization factor. Neither in the results part nor in the Materials and methods section is the formula mentioned.

This formula was indeed missing and we are grateful that the referee pointed this out. We have added the formula for the normalized polarization factor pnorm to the revised Materials and methods part.

5) In connection to this are also some comments missing about the precision of the polarization experiments: given the huge spread in the normalization of the polarization factor for aligned actin filaments (0.75–1.5!!!), how sensitive will the method be for changes in the cortex alignment. I.e. how many filaments in the cortex have to be aligned so that the polarization factor differs significantly from the cortex value?

The variability of individual polarization measurements is indeed high. The large sample number, however, enables an accurate estimation of the mean. To indicate the accuracy of the calculated means, we added bars indicating s.e.m. to the revised Figure 1G and comment on this in the main text: “The polarization measurements varied quite substantially between individual cells, yet owing to the relatively large sample sizes, we obtained accurate estimates of the mean for each of the respective stages and cellular positions (s.e.m. ranging between 0.01 – 0.03, Figure 1G).”

6) Subsection “Contraction of a randomly oriented actin network initiates cleavage furrow ingression”: Given the rather limited time resolution and sensitivity of the polarization measurements, the last statement should be made more carefully (especially as later measurements with TIRF do indicate an earlier filament alignment).

To address this concern, we rephrased the concluding sentence of this paragraph: “Overall, these observations indicate that the orientation of actin filaments in the equatorial network driving initial stages of constriction is indistinguishable from the random orientation observed in the cortex of metaphase cells.”

7) Subsection “Contraction of a randomly oriented actin network initiates cleavage furrow ingression”: I don't think that the authors referenced correctly here. I would expect to see: Chugh, P., G. Charras, G. Salbreux, and E.K. Paluch. 2017. Nat. Cell Biol. 19: 689–697. Also, later in the Discussion, as this work studies cortex tension and cytoskeletal architecture.

This was a technical mistake, as we of course intended to cite Chugh et al. in l. 140. We thank the reviewer for pointing this out and corrected it in the revised manuscript. Regarding the comment on the Discussion section, it is not clear to us where we should add another reference to Chugh et al. If the reviewer provides specific instructions, we would be happy to revise the Discussion accordingly.

8) Subsection “Equatorial actin filament reorientation depends on myosin II activity”: It is interesting to see that actin accumulation at the equator is not myosin dependent. But it might be worth a word to mention that the cortex thickness seems not to be altered despite a higher actin content. This indicates again that the actin is aligned.

The accumulation of actin in a cortex of constant width indeed implies that the filament density must increase. We added a comment to the revised manuscript, in the paragraph in which we present the cortex width measurements: “Importantly, however, we did not detect a significant difference between the thickness of the equatorial cortex of metaphase and anaphase cells (Figure 2—figure supplement 1J), indicating that equatorial actin accumulations in anaphase cells must be due to increased local filament density.” We do not think that the cortex width measurements provide direct information on the filament alignment state and hence prefer not to comment on alignment in this paragraph.

9) Subsection “Equatorial actin filament reorientation depends on myosin II activity”: In the context of myosin driven actin accumulation, the work of Wollrab et al. should be discussed here as they analysed in detail the recruitment and activity of myosin during ring contraction (Wollrab et al., 2016).

Following the suggestion, we reference this paper at the respective section: “This is consistent with small-scale organization within the actomyosin ring, where pronounced myosin II clusters also do not locally enrich actin to the same extent.” We would like to clarify that we do not claim that myosin drives actin accumulation (as the reviewer implies in the comment), but rather suggest that myosin II mediates reorientation of actin filaments within the equatorial cell cortex.

10) Subsection “Equatorial actin filaments reorient on planar cortex regions”: Important, now the authors stated that they detect alignment together with the onset of furrow ingression. It would be good to point out that the improved spatial resolution increased the sensitivity for changes in filament alignment and in contrast to the earlier experiments where they were not able to detect any changes in alignment at such early time points.

This was formulated imprecisely, as the anisotropy in this experiment does not increase earlier compared to the other experiments performed at central optical slices. Figure 3F shows that actin accumulates at the equator at ~90 s after anaphase onset, whereas the normalized emission ration increases only at ~120 s after anaphase onset (Figure 3G; comparing post-anaphase onset frames to the metaphase interval -100 to 0 s and considering the relatively high s.d.). We rephrased the text for clarification.

11) Subsection “Cortical tension is highly directional at the cell equator”: How did the authors look at cortical flows? What is their definition of long vs short range?

We investigated cortical flows by kymographs and used the term long-range to refer to flow outside of the central region within about 5 μm of the cell equator. Figure 4B in our original manuscript showed only a small equatorial region, and it was hence not clear what we meant by long-range flow. For better documentation, we provide a new kymograph with a longer profile (new Figure 4B) and omit the term “long-range”, as the revised figure directly visualizes the limited flow outside of the central regions.

12) Please see figure comments regarding the micro–surgery experiments.

We addressed all comments on the laser cutting experiments as explained below in the section on figures.

13) Discussion section: The discussion is very hand waving and needs thorough rewriting. It seems that out of nothing, the authors say now that everything is driven by local myosin activity. This is well possible, but then the observed network alignment is not a big deal, and the question remains how the myosin activity is localized to the ring. The authors fail to put their work in context with earlier work, such as Fishkind and Wang, how the experimental improvements help in understanding the network organization during cytokinesis, and how their findings will help to solve the ongoing debate about the most conclusive model.

We completely rewrote the discussion to clarify that cleavage furrow ingression is driven by local actomyosin contractility at the cell equator. The revised and extended Discussion section now explains in detail how our work relates to prior studies, in particular the study of Fishkind and Wang. We also discuss in detail our technical improvements.

14) “Our study shows that disordered actomyosin networks can generate sufficient mechanical tension to initiate cleavage furrow ingression in vertebrate cells”: The authors do not test whether the disordered actomyosin network generates enough tension for furrow ingression. Especially the blebbistatin experiments show that there are signals fostering actin filament polymerization at the furrow site without ingression. To support the above statement, one would have to do a laser ablation next to the developing furrow ingression and observe, if and how the ingression evolves further or not.

Our data show that the initiation of a cleavage furrow occurs in the absence of detectable actin filament alignment along the cell equator. We agree that it is suboptimal to include a statement on tension in the same sentence, and we have therefore removed this part of the sentence to separately discuss it in subsequent paragraphs. In the revised manuscript, we state: “Our study shows that the initial phase of cleavage furrow ingression is mediated by equatorial contraction of a disordered actomyosin network…”

15) “This suggests that vertebrate cells align the actomyosin network

directly at the site of highest contractility, whereby lateral cortical movements adjacent to the cell equator”: It's not very clear what the authors want to point out here. Cells do not align the actomyosin at the site of contractility, contractility itself aligns generally the actin filaments.

We thank the reviewer for indicating that this sentence was not very clear. We rephrased it to: “This suggests that during human cell cytokinesis, the actomyosin network aligns directly at the site of highest contractility, whereby lateral cortical movements adjacent to the cell equator might reflect drag imposed by highest network contractility at the equator.”

16) “Given that actomyosin rings mediate various other biological processes, including cellular wound healing and developmental morphogenesis, it will be interesting to further investigate the intricate relationship between contractile forces and actin network organization”: Very generic statement. Can be left out.

We prefer to keep this statement to point a broad readership towards potential implications of our work outside the cytokinesis field.

17) Major point 1: Interpretation of the low anisotropy regions in the mid–plane

The metaphase cell in Figure 1E shows a clear trend that the regions with strong signals in the average image show lower color saturation in the orientation map (white), hence, lower polarisation. This backs up my arguments about the scaling effect (major point 2 in my previous comments), i.e., denser the structure, lower the calculated anisotropy. Apart from the theory, the authors should provide good reasoning for the interpretation of "white" signal at the furrow as perpendicular alignment while those in the metaphase cell are clearly not representing such alignment.

We thank the reviewer for requesting clarification about a potential correlation between mean fluorescence intensity and the calculated polarization factor. Figure 1E shows a visualization of two parameters – mean fluorescence and polarization – in a single image, which is difficult to interpret quantitatively. In the revised manuscript, we hence provide an additional display of the same data in separate image panels for average fluorescence intensity and polarization, respectively (new Figure 1—figure supplement 1C). These images clearly show that at early anaphase there is no correlation between fluorescence intensity and the calculated anisotropy, validating that the reduction of polarization measured at later stages of furrow ingression indeed indicates reorientation of actin filaments.

18) Major point 2: Comparison with a previous report

The polarization microscope setups used in this study are most straight–forward and sensitive in detection of the polarization within the X–Y plane. Indeed, the pioneering work with a similar setup by Fishkind and Wang focused on this. Honestly, I don't understand why the authors insist on not taking this approach (e.g. flatten a cell in a way similar to Figure 3) on their LC–Polscope. This should allow straight–forward visualization of the filament alignment and direct comparison with the results by Fishkind and Wang. Anyway, Figure 3 data, in principle, provide a live version of Fishkind and Wang, which is indeed a drastic improvement. Similarities, differences and improvements should be properly discussed in Discussion, including the difference in the data analyses (simple ratiometry in Figure 3 vs (F_parallel – F_perpendicular)/(F_parallel + F_perpendicular in Fishkind and Wang).

We thank the reviewer for pointing out that we should point out more clearly how our method compares to the prior study. We have extended the Discussion section accordingly:

“The quantification of actin filament order at defined time points of cytokinesis has been established through several technical innovations. […]Yet, in combination with the fixed cell data, these experiments establish a detailed kinetic profile of actin network organization during cytokinesis progression.”

19) Major point 3: Laser surgery in Figure 4

As I pointed out as Major point #10 in my previous comments, the comparison between "perpendicular" vs "parallel" cuts is not fair. Why a smaller round hole was not tried or is not suitable should be explained.

When implementing the laser microsurgery assays, we tried many different cutting geometries. We found that only experiments with thin line geometries yielded interpretable results: when scanning 2D area geometries with the pulsed high-energy laser, we either completely exploded the cells or did not induce measurable displacement of the cortex.

To further address the concern of the reviewer, we have included new data from cells that were cut along a linear path oriented at 45 degrees relative to the cleavage furrow (new Figure 4—figure supplement 1H). These experiments show a diagonal cortical displacement, whereby the most pronounced displacement was oriented along the direction of the cell equator. The new data substantiate that the cortical tension is highest along the direction of the cell equator.

20) Subsection “Contraction of a randomly oriented actin network initiates cleavage furrow ingression”.

As a sample with isotropic fluorescence dipole distribution, we imaged fluorescent plastic (Figure 1C). We then normalized the polarization factor to be in a range between 1 and 0 for maximally aligned fluorophores (stress fibres) and isotropic plastic, respectively.

I expect the isotropic plastic to have a polarisation factor of 0.5 much akin to the metaphase cortex. Is there something specific about the substrate?

In fluorescent plastic, the fluorophore dipoles are randomly oriented in all three spatial dimensions, which we use as a reference for a completely isotropic sample. The cell cortex of mitotic HeLa cells is relatively thin (~200 nm), which might confine actin filaments into a flat network. If the actin network contains filaments oriented along the cell surface, but with random orientations within the surface plane, this should yield a polarization factor of 0.5.

We rephrased the main text for clarification:

“The actin cortex underlying the plasma membrane of mitotic cells is relatively thin, which might confine actin filaments into a flat network. […] As each camera image pixel records signal from many fluorophores, this should yield a normalized polarization factor close to 0.5 along the metaphase cell cortex.”

21) Figure 1G and 1F.

During late stages of anaphase, the normalised polarisation at the poles appear to be more than 0.6 (mean) in Figure 1F and less than 0.6 in Figure 1G. Can the authors explain the discrepancy?

The reason for the (very small) difference in the mean polarisation at the poles is that the initial dataset of 22 cells (as shown in Figure 1F) was extended by 17 additional cells for a more accurate estimation of the mean as shown in Figure 1G. The sample size of 22 for Figure 1G is indicated in the legend.

22) Figure 1G.

The authors seem to let go of a major point by not comparing the normalised potential of either equator or poles for different time points. This would have made a nice point regarding orientation of actin over time.

This might be interesting, yet the increase in normalized polarization factor at the poles is small. We now comment on this in the revised main text:

“We also noticed a small increase of normalized polarization factor at the poles during late stages of cytokinesis, which might reflect cortical reorganization when cells reattach to the glass substratum during mitotic exit.”

23) Laser Microsurgery experiment:

This is indeed a very interesting observation. The cut in the parallel direction on the cell cortex doesn't induce cortex movement which is in stark contrast to a similar cut made in the perpendicular orientation. It will however be interesting to see whether the parallel slit can induce outward movement if its horizontal dimension (which is a line currently) is increased. If so, then does this minimum lateral dimension (when outward motion is achieved) correspond to the FWHM of the anisotropic actin network measured in the paper (4.4.um)?

When we developed the laser microsurgery assays, we tried many different geometries and found that exposing broader 2D areas to the pulsed high-energy laser leads to immediate explosion of cells, whereby the edge of the cut cortex cannot be tracked. We therefore can only use thin lines for the laser microsurgery experiments.

To address the reviewer’s question about alternative cutting geometries, we added new data with a cutting line that is oriented at 45 degrees relative to the cleavage furrow (Figure 4—figure supplement 1H). This shows a diagonal cortical displacement following the orientation of the cell equator. These new data substantiate that the tension is distributed aniostropically whereby the peak tension is aligned with the cell equator.

24) As a general interest it would be interesting to know, what happens to these cells after the cut is made. Do these cells show a healing response or abort cytokinesis and undergo cell death.

We provide this information in the revised main text: “Time-lapse microscopy showed that following the rapid cortical displacement after laser cutting, most cells repaired the cell cortex and resumed furrow ingression to completion (8 out of 12 cells within 10 min; 2 cells stopped furrow ingression and 2 cells died).”

Issues with figures

Figure 1D: The question marks can be left out.

We removed the question marks as suggested.

Figure 1E) The authors might want to discuss why the cortical actin shows parallel alignment along the plasma membrane due to the overall confinement of the actin filaments along the membrane. And that the white area along the furrow indicates the alignment of filaments along the z axis. Since this kind of measurements are not common for the major audience, a careful description and discussion are important.

We now discuss the geometrical considerations and data shown in Figure 1E in more detail:

“The canonical “purse-string” model of cytokinesis proposes that actin filaments align along the cell equator to drive furrow ingression by anti-parallel sliding (Figure 1D). […] At late stages of cytokinesis, we indeed observed a pronounced reduction of the normalized polarization factor at the cell equator (Figure 1E, 201-300 s, cortex area with low color saturation; quantification in 1F), consistent with preferential orientation of actin filaments along the cell equator.”

Figure 1G) Given the spread of the data, tracing the difference of individual cells would be helpful by connecting the corresponding red and blue dots.

We thank for the suggestion how to improve data visualization. Given the large number of cells, however, we found that connecting pairs of dots does not help with the data interpretation. To give the reader additional information on the accuracy of the data, we added bars indicating s.e.m. to the revised Figure 1G.

Figure 2B: The cell cortex appears jagged and the 0 and 90 degree channels do not seem always properly aligned (very clear at 330sec). Why is that the case? Channel alignment is essential for the polarization analysis.

The slight misalignment between some cortical regions in the two image channels is caused by sequential image acquisition, while the cleavage furrow moves in live cells. In our quantitative analysis, we compensate for this by using line widths that contain all signal from both channels. We now comment on this in the revised Materials and methods section: “This segmentation contour line had a width that completely contained the cortex signal even when the two image channels were slightly shifted owing to cleave furrow ingression during their sequential acquisition (e.g., Figure 2B, control, 290 s).”

Figure 2—figure supplement 1E: It would be instructive if the authors could first show the raw intensities before computing the ratio.

Without the normalization of individual data points through calculating H/V ratios, the raw intensities for individual channels appear very noisy and do not convey meaningful information, in our view. We have included the plot of raw intensities below but do not think it is helpful to incorporate this into the manuscript.

Author response image 1.

Author response image 1.

Figure 2—figure supplement 1J:How can you obtain negative values for the actin cortex thickness?

The negative values represent measurement noise and based on the reviewer’s comment we realize that it would be more accurate to re-label the Y-axis in this plot. For this figure, we calculated the difference between the center positions of Gaussian functions fitted to the MyrPalm and SiR-actin channels, respectively. We used line profiles oriented perpendicularly to the cell cortex, drawn from the inside towards the outside of cells. This yields positive values when the SiR-actin center position lies on the cytoplasmic face relative to the MyrPalm position. The negative values result from line profiles where the center position of SiR-actin was determined to lie on the extracellular face relative to the MyrPalm position, most likely reflecting measurement noise. We clarified this by rephrasing the axis label to “Radial displacement (MyrPalm – SiR-actin) (nm)”.

Figure 3G: The plot indicates that changes in network orientation appear at about 100sec. this would mean that alignment would go hand in hand with the furrow ingression. The authors should discuss this point as it is in conflict with the earlier conclusion that alignment can be only detected at later time points.

We disagree with the reviewer’s interpretation of the data shown in this plot. Compared to the metaphase interval (-100 to 0 s), this plot does not show an increase in normalized emission ratio until ~120 s post anaphase onset (considering the variability indicated by the shaded areas, indicating s.d.). We clarified this in the main text.

Figure 4C, D: The authors should show a bleach control to show that their ablation protocol really cuts the actin network. They also should provide data to indicate whether the plasma membrane stays intact or not during the procedure.

We have included a bleach control, showing that photobleaching of Actin-EGFP with a conventional 488 nm laser results in homogeneous recovery in the bleached region without lateral cortical displacement (new Figure 4—figure supplement 1F). Hence, the lateral displacement is a specific response to cutting with the pulsed laser.

We have also added new data showing that the pulsed laser also cuts the plasma membrane, as imaged by Myr-Palm-EGFP (new Figure 4—figure supplement 1G).

In addition, it would be very instructive for the authors conclusion to perform a laser ablation of the network adjacent to the cytokinetic ring in the beginning of furrow ingression and to observe whether the contraction progresses or not. If the global contraction of the random actin network is necessary for the cytokinetic ring, then this ablation should perturb the process.

The laser microsurgery does not consistently cause persistent damage of the actomyosin ring, as most cells resumed cytokinesis some time after laser microsurgery, even when the central region of the actomyosin ring was destroyed. We provide these information in the revised main text: “Timelapse microscopy further showed that following the rapid cortical displacement after laser cutting, most cells repaired the cell cortex and resumed furrow ingression to completion (8 out of 12 cells within 10 min; 2 cells stopped furrow ingression and 2 cells died).” In light of these observations, we do not think that the suggested experiment will be informative. However, we have added new laser microsurgery data with a diagonal cutting path, which provides further insight into the distribution of cortical tension (new Figure 4—figure supplement 1H).

Figure 5: The schematic looks nice, but is not very instructive. In addition, the model is not properly formulated (i.e. in a theoretical way) and the claims are not presented in clear connection to the presented data. How is the equatorial contractility generated in the first place (–> increased local myosin activity)? how to explain lateral cortex displacement without increase of tension (–> less connectivity in the network? Shorter filaments?) How is the higher tension along the equator generated (–>via filament alignment)?

We revised the model figure and rephrased the Discussion section for clarification: “In this model, the activation of myosin II at the cell equator would induce local contractility in a cortical network of randomly oriented actin filaments. Along the cell equator, each given point experiences counteracting contractile forces from neighboring regions, which would build up high levels of mechanical tension along the circumference of the cell. In the direction perpendicular to the cell equator, highly contractile equatorial cortex regions connect to neighboring regions of lower contractility, which would move towards the equator without building high levels of tension. The resulting asymmetric network deformation could explain the filament reorientation towards the direction of the cell equator, which might in turn further increase the contractile forces oriented along this direction.”

Figure 1—figure supplement 1.

The area for selected at the poles is mentioned as 16um in the figure against 10um in the text (Materials and methods section).

We used 16 μm line paths for the analyses of polar regions. We corrected the Materials and methods section accordingly.

Figure 2D and 2E

Curvature change in Figure 2D appears to reduce post 350 second. No such trend however is observed for Figure 2E for essentially the same measurement.

Figure 2D shows an example curve from a single cell, whereas Figure 2E shows the mean and s.d. of the entire dataset of 18 cells. The shaded gray area in Figure 2E (indicating s.d.) reveals a high variability in the curvature at late furrow ingression stages (>250 s), which is largely due to the variable geometry by which the two daughter cells organize relative to each other. Some sister cells move apart and then elongate their intercellular bridge, resulting in a reduction of curvature (as for the cell shown in Figure 2D). However, this variability does not affect on our analysis of SiR-actin polarization, as we only consider early stages of furrow ingression (indicated by green areas).

Figure 2F and 1G.

In Figure 2F, there appears to be no net change in normalised emission ratio, indicative of polarisation, at the poles. However, in Figure 1G, there seems to be a modest increase in normalised polarisation.

These differences might be due to the different F-actin staining methods used in the two experiments (Alexa Fluor 488-phalloidin versus SiR-actin) or the different microscope set-up. As the differences in polar actin network anisotropy are only minor, we do not think that this compromises the interpretation of our data at the cleavage furrow, which is consistent in both types of experiments.

Figure 4G.

It would be interesting to know whether the increasing movement of the network on ablation scales with increased actin alignment.

The increase in initial outward movement indeed correlates with an increase in normalized emission ratio. We now show this in a new Figure 4 panel J.

Associated Data

    This section collects any data citations, data availability statements, or supplementary materials included in this article.

    Supplementary Materials

    Source code 1.
    elife-30867-code1.zip (32.5KB, zip)
    DOI: 10.7554/eLife.30867.015
    Transparent reporting form
    DOI: 10.7554/eLife.30867.016

    Articles from eLife are provided here courtesy of eLife Sciences Publications, Ltd

    RESOURCES