Abstract
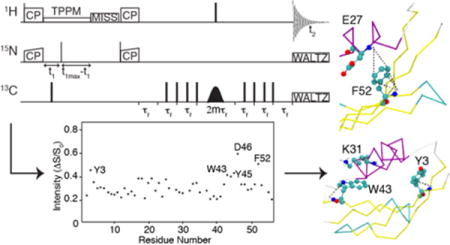
Rotational echo double resonance (REDOR) is a highly successful method for heteronuclear distance determination in biological solid-state NMR, and 1H detection methods have emerged in recent years as a powerful approach to improving sensitivity and resolution for small sample quantities by utilizing fast magic-angle spinning (>30 kHz) and deuteration strategies. In theory, involving 1H as one of the spins for measuring REDOR effects can greatly increase the distance measurement range, but few experiments of this type have been reported. Here we introduce a pulse sequence that combines frequency selective REDOR (FSR) with 1H detection. We demonstrate this method with applications to samples of uniformly 13C, 15N, 2H-labeled alanine and uniformly 13C, 2H, 15N-labeled GB1 protein, back-exchanged with 30% H2O and 70% D2O, employing a variety of frequency-selective 13C pulses to highlight unique spectral features. The resulting, robust REDOR effects provide (1) tools for resonance assignment, (2) restraints of secondary structure, (3) probes of tertiary structure, and (4) approaches to determine the preferred orientation of aromatic rings in the protein core.
TOC image
Introduction
Magic-angle spinning (MAS) solid-state NMR (SSNMR) spectroscopy is a powerful technique for elucidating the structures of insoluble proteins, especially amyloid fibrils and membrane proteins, and small molecule ligand-bound biological complexes1–7. Three-dimensional (3D) structure determination of proteins generally relies upon large numbers of semi-quantitative distances and is greatly enhanced by the availability of quantitative distance restraint measurements. Rotational echo double resonance (REDOR) is a well-known SSNMR method for measuring heteronuclear distances8–9, and it has been used extensively for studies of small molecules, proteins and bimolecular complexes10–12. Analogous TEDOR approaches have been developed13 and applied to the determination of high-resolution protein structures14–15. The measurable distance depends on the gyromagnetic ratio (γ) of the nuclei. Since 1H has the highest gyromagnetic ratio of any stable isotope, the longest theoretical distance range for REDOR would be achievable with 1H-19F pairs, as demonstrated by Hong and co-workers16 utilizing low-γ nucleus detection, followed by 1H-31P and 1H-13C.
Utilizing 1H as the detected nucleus in such REDOR cases potentially adds another advantage of increased sensitivity. Significant technological advances in the field of SSNMR over the last decade have enabled the routine use of 1H-detected experiments for biomolecular structure determination17–20. The two main factors that have advanced 1H detection are (ultra)-fast magic angle spinning (MAS), ranging from 30 to >110 kHz21 and complete or partial deuteration of the protein21–22. The 1H line width is inversely proportional to the spinning rate, and so even fully protonated samples yield sub-ppm line widths at 30 to 40 kHz MAS17,23. Deuteration and partial back-exchange with H2O further reduce the average 1H-1H dipolar couplings and in combination with fast MAS rates enhance the resolution of the 1H-detected spectrum and transverse relaxation times (T2)24–25. State-of-the-art approaches now can often yield ~0.1 ppm or better amide 1H linewidths18,20–22.
Previous 1H-X REDOR studies have emphasized spectral filtering based on coupling magnitude26–28. The initial implementation, called medium and long distance heteronuclear correlation (MELODI-HETCOR), focused on suppressing the one-bond 1H-13C correlation through dephasing of 1H magnetization by REDOR π pulses on 13C, and detecting medium- and long-range 1H-13C correlations in a HETCOR spectrum26. This method was applied at moderate MAS rates (6 to 10 kHz), requiring a frequency-switched Lee-Goldburg (FSLG)29 sequence to suppress the 1H-1H homonuclear couplings. An additional crucial requirement for this experiment is a partially 13C-labeled protein.
Here we introduce a modified pulse sequence that produces a 15N-1H correlation spectrum in which the peak intensities depend on selective REDOR dephasing from 13C. Optimal resolution is obtained in a deuterated protein with fast MAS, negating the need for multiple pulse decoupling approaches for removing 1H-1H homonuclear couplings. Further, due to the increased 1H T2 relaxation times, the 1H magnetization can be dephased for a longer time (on the order of 15–20 ms), in principle enabling longer 1H-X distances to be detected with this pulse sequence (up to 15–20 Å). But since the coupling magnitudes are so large (>1 kHz) for many structurally informative distances (vide infra), even REDOR applied for ~1 ms is more than sufficient to reveal a variety of unique effects that depend on the details of protein structure. Band-selectivity of the REDOR dephasing30 is achieved with frequency-selective soft π-pulses applied to the 13C nuclei. In addition to backbone (Cα and C’) selective versions for spectral filtering, we also evaluate cases in which the π-pulses are applied to the methyl and aromatic regions. These results provide insights into resonance assignment, secondary and tertiary structure, and preferred sidechain orientations.
Experimental Methods
Preparation of uniformly 13C, 15N, 2H-labeled Ala
13C3, D4, 15N labeled L-Ala was purchased from Cambridge Isotope Laboratories (Andover, MA), exchanged into 99.9% D2O, lyophilized and then re-crystallized by slow evaporation of a saturated (~250 mg/mL) solution at room temperature. The crystals were crushed to make a fine powder sample and 4 mg was packed in a 1.6 mm FastMAS rotor (Revolution NMR, LLC, Fort Collins, CO).
Preparation of uniformly 13C, 15N, 2H-labeled GB1
Uniformly 13C, 15N, 2H labeled (U-CDN) GB1 protein was expressed in E. coli cells and purified according to Ref.31. The purified protein was dialyzed into 30:70 H2O:D2O buffer, concentrated to ~25 mg/mL and precipitated with 2-methyl-2,4-pentanediol (MPD) and isopropanol (IPA) solution according to Ref.32. Microcrystals were ultracentrifuged and ~4 mg packed into a 1.6 mm FastMAS rotor (Revolution NMR, LLC, Fort Collins, CO).
1H-Detected frequency selective REDOR (FSR) pulse sequence
The pulse sequence (Fig. 1) starts with adiabatic cross-polarization (CP)33 from 1H to 15N, followed by evolution in t1 with low power TPPM 1H decoupling34–35. After evolution, the 15N magnetization is stored along the z-axis in a constant time manner, and MISSISSIPPI solvent suppression is applied36, followed by 15N-to-1H CP. The FSR30 period starts with in-phase 1H magnetization, which evolves under REDOR by applying two π-pulses per rotor period on the dephasing channel (13C in this case). The 13C-13C dipolar interactions present in a fully 13C labeled protein will be reintroduced by the application of the π-pulse trains on 13C and hence will lead to some additional signal decay. We also attempted versions with one π pulse per rotor period on each channel (Fig. S1) or all the π pulses on 1H; both resulted in less satisfactory performance due to 1H-1H recoupling effects. A simultaneous hard π-pulse on the 1H channel and a soft frequency selective π-pulse on the dephasing channel are applied in the middle of the REDOR period (after the first train of REDOR π-pulses, with the hard π-pulse centered on the soft π-pulse), with extra rotor periods before and after the REDOR to ensure an in-phase echo for detection with minimal baseline distortion. The soft pulse on 13C will also lead to partial removal of the recoupled 13C-13C interaction. The S0 experiment is performed with no REDOR π-pulse train on the dephasing channel, and the S experiment is performed with all the REDOR π-pulses. The 1H magnetization is then detected in the direct dimension with WALTZ decoupling37 applied to both 15N and 13C.
Fig. 1.
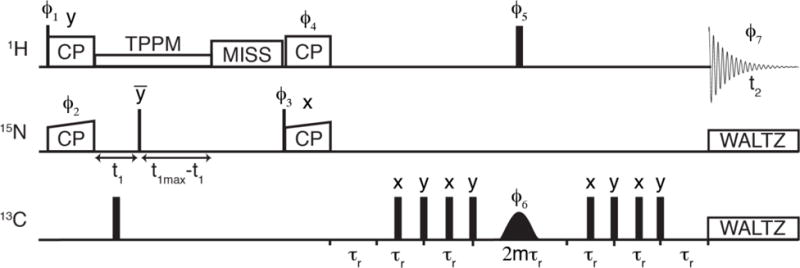
Pulse sequence for 1HN-detected frequency selective REDOR spectroscopy. The 1H magnetization is transferred to 15N for indirect evolution and then transferred back to 1H for detection. A REDOR period is added before detection to dephase the 1H magnetization with nearby 13C atoms (more details in text). The phase cycles were as follows: ϕ1 = x,x,-x,-x; ϕ2 = x,x,x,x,-x,-x,-x,-x; ϕ3 = y,-y; ϕ4 = y,y,-x,-x; ϕ5 = y,y,x,x,x,x,y,y,-x,-x,y,y,y,y,-x,-x,-y,-y,-x,-x,-x,-x,-y,-y,x,x,y,y,y,y,x,x; ϕ6 = x,y,x,y,-x,-y,-x,-y; ϕ7 = x,-x,-y,y,x,-x,-y,y,-x,x,y,-y,-x,x,y,-y
Solid State NMR (SSNMR) Spectroscopy
Experiments on U-CDN Ala were carried out at 11.7 T (500 MHz 1H frequency) on a Varian (Walnut Creek, CA and Loveland, CO) VNMRS spectrometer with a 1.6 mm HCDN FastMAS probe. Experiments on U-CDN GB1 (30% H2O back exchanged) were carried out at 17.6 T (750 MHz 1H frequency) on Varian VNMRS spectrometer with a 1.6 mm HFXY FastMAS probe configured in HFCN mode. On both the instruments, the spinning was controlled at 33333 ± 10 Hz by a Varian MAS controller. The variable temperature gas was maintained at 0 °C resulting in an approximate sample temperature of 15–20 °C. 13C chemical shifts were referenced externally with adamantane at 40.48 ppm for the methylene signal38.
1H detected FSR on U-CDN Ala
The π/2 pulse widths were 1.4 μs for 1H, 3.6 μs for 15N, 1.4 μs for 13C. The contact time for 1H-to-15N CP transfer and 15N-to-1H CP transfer was 1.6 ms. The indirect dimension was not digitized in this experiment (since there is only one 15N frequency). The soft (Gaussian) π pulse was applied for 600 μs Gaussian pulse with Gaussian shape and a maximum nutation frequency of ~5.2 kHz power on the 13C channel. The REDOR π-pulse widths were 2.8 μs. The 13C channel transmitter frequency was set to three different values for exciting different 13C atoms in Ala, 13Cα (50 ppm), 13CO (175 ppm) and 13CH3 (20 ppm). The dephasing time was varied from 0 to 1.2 ms. 64 scans were collected for each experiment.
1H site-specific T2 measurements on U-CDN GB1
The 15N-1H 2D experiment with a 1H refocusing π-pulse before detection was used to measure the 1H T2 for each residue. The echo time was varied in 18 steps from 60 μs to 21.6 ms. The contact time for 1H-to-15N CP transfer was 900 μs and 15N-to-1H CP transfer was 360 μs. The indirect 15N dimension was digitized to 23 ms and the 1H acquisition time was set to 20 ms. ~10 kHz of decoupling power through TPPM decoupling was applied on 1H during indirect evolution on 15N.
1H detected FSR on U-CDN GB1
The contact time for 1H-to-15N CP transfer was set to 900 μs and 15N-to-1H CP transfer was set to 360 μs. The indirect 15N dimension was digitized to 23 ms. TPPM decoupling (~10 kHz, 50° phase, 50 μs pulse width) was applied on 1H during indirect evolution on 15N. The S0 experiment was performed with a refocusing hard π-pulse on 1H and a soft Gaussian π pulse (600 μs duration) on the 13C channel. The S experiment was performed with additional REDOR π-pulse (4 μs pulse width) trains on the 13C channel. Four versions of the experiment were performed, each with the 13C channel transmitter frequency set to a particular region: 13Cα (50 ppm), 13CO (175 ppm) and 13CH3 (20 ppm) and aromatics (130 ppm). The bandwidth of the soft pulse was ~15 ppm. 15N-1H 2D S0 and S spectra for each transmitter frequency were collected with REDOR times ranging from 240 μs to 1.2 ms.
Data Processing
The 1H-detected FSR 1D spectra collected on Ala were processed in Mnova NMR software (MESTRELAB 2014), with polynomial baseline correction. 2D spectra were processed using NMRPipe39 with back linear prediction and polynomial baseline correction applied to the direct dimension. Lorentzian-to-Gaussian apodization, phase-shifted sine bells and zero filling were applied to both dimensions.
Microsoft Excel for Mac 2011 (version 14.7.1) software was used to plot and fit the 1H T2 values assuming a single exponential decay. Error analysis was performed by fitting the natural log of the intensities with the Excel ‘LINEST’ function to extract the standard error associated with the slope of the linear fit (slope is equivalent to 1/T2). The standard error was then converted to standard deviation and propagated to determine the standard deviation associated with T2 of each residue.
Results and Discussion
REDOR effects on residual amino protons in U-CDN Ala
We initially tested the pulse sequence with U-CDN Ala, a small model compound with ~0.1% residual amino group protons from the crystallization. The low protonation level greatly reduces the average 1H-1H dipolar couplings, resulting in line widths of 0.5 ppm or less at 33.333 kHz MAS rate. Thus, we obtained site-specific 13C-dephased 1HN spectra (Fig. 2), allowing us to evaluate the specificity of the REDOR effect with selective pulses. The 13Cα is an average of ~2.2 Å from the amino 1H (assuming three-site hopping in the fast limit), the shortest 13C-1H distance available in this sample, and so with the 13Cα frequency selective pulse, the 1HN signal shows almost complete dephasing (ΔS/S0 = 0.7) already at 360 μs (Fig. 2a). The 13CH3 and the 13CO are each effectively ~2.8 Å from the amino (taking motionally averaging into account), and in these cases a slightly smaller dephasing (ΔS/S0 = 0.5) is observed when the REDOR π pulses are on the 13CH3 and 13CO region (Fig. 2b,c).
Fig. 2.

Application of 1H detected FSR pulse sequence on uniformly 2H, 13C, 15N labeled Ala (residual protonation level is 1%). The 1HN 1D spectra are shown when the REDOR π pulse trains are on (a) 13Cα region, (b) 13CO region, and (c) 13CH3 region. S0 spectrum is in black (collected without REDOR π pulses on 13C channel) and S spectrum is in red (collected with REDOR π pulses on 13C channel)
1H-15N correlation spectrum of GB1 at 30% protonation level
The 1H line width in fully protonated and 100% back-exchanged GB1 protein at 40 kHz MAS was reported as ~1 ppm17 and at least 0.2 ppm24 respectively, with partial overlap especially in central region of the spectrum (115-126 ppm 15N and 8.0-9.5 ppm 1H), as well as in the Thr residues which were systematically broader due to the high level of sidechain protonation. Akbey et al.22 demonstrated that the optimal combination of 1H resolution and sensitivity at ~30 kHz MAS is in the range of 30% to 40% H2O back-exchange. We therefore utilized a 30% protonation level for the U-CDN GB1 sample, resulting in a 15N-1H spectrum (Fig. 3) that is almost entirely resolved. The 1H line widths are typically 0.1 ppm (60 to 80 Hz at 750 MHz 1H frequency); roughly 20 Hz of this line width is contributed from the magnetic field inhomogeneity (based on the 13C line width in adamantane of ~5 Hz). Even the central region is mostly resolved, with only a few partially overlapped peaks (like K31/D36 and K4/A23/A34). The fractional back-exchange has an especially large benefit for Thr residues, and the individual amine protons of the Asn/Gln side chains are resolved.
Fig. 3.
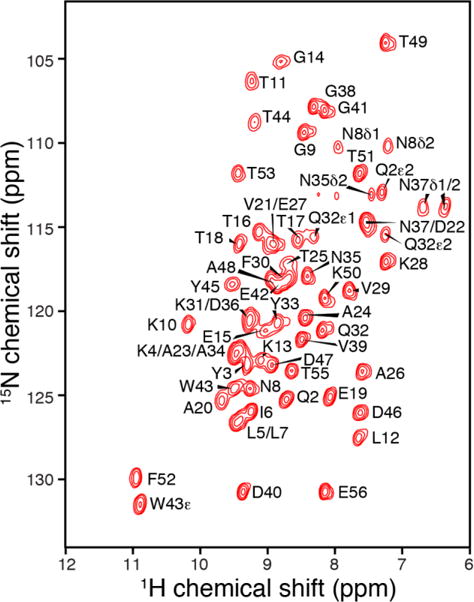
15N-1H 2D spectrum of uniformly 13C, 15N, 2H labeled GB1 protein, back-exchanged with 30% H2O. The high level of deuteration of GB1 allows optimal resolution in 1H dimension.
As expected, based on the overall improvements in the resolution of the 1H-15N spectrum, the T2 values were also greatly improved relative to 100% back-exchanged sample studied previously24. We measured the bulk 1HN T2 of GB1 to be around 13 ms (measured with a Hahn echo directly before acquisition. with 15N-filtering). We also measured site-specific T2 values with a series of 2D 1H-15N correlation spectra with incremented Hahn echo times prior to detection (Fig. S2). In this manner, we were able to determine site-specific T2 values for 43 backbone amide sites, which range from 3 to 83 ms (Fig. 4). Even the fastest relaxing sites (e.g., T25, Y45) had more than sufficient echo lifetimes to enable application of the REDOR experiment directly on the 1H transverse magnetization. In the following sections we demonstrate the magnitude of these REDOR effects and the utility for assignment and conformational analysis.
Fig. 4.
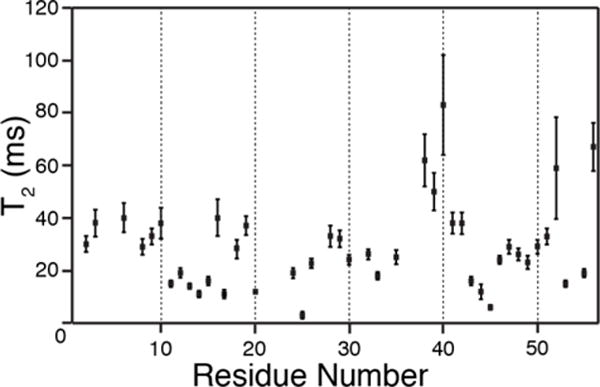
Site-specific T2 measurements of backbone amide 1H in uniformly 2H, 13C, 15N labeled GB1 protein, back exchanged to 30% amide 1H. The transverse relaxation time varies from 3 ms (T25) to 83 ms (D40). The residues that are not observable or overlapped in a hNH 2D spectrum are not shown here. The error bars represent standard deviation calculated using linear regression model (described in text in details)
1H{13C} REDOR effects in GB1 spectra
Dephasing by 13Cα emphasizes backbone correlations
Three versions of the 13C-dephased, 1H-detected REDOR experiment are illustrated in Fig. 5, for different soft pulse bandwidths and mixing times, presented as difference spectra (S0-S). First we examined the 13Cα-dephased version, which results in strong REDOR effects at only 240 (Fig. 5a) to 360 μs (Fig. 5b), as expected due to the short 1HN to 13Cα distance (~2.1-2.2 Å) and corresponding dipolar coupling of ~3 kHz. All the residues show significant REDOR effects, with roughly a third (18) exhibiting >50% dephasing (ΔS/S0 > 0.5) at 240 μs, and most of the remaining (32 additional) sites reaching this threshold by 360 μs. These spectra are effective for providing a filtered spectrum including only the backbone, since the sidechain amine sites show significant dephasing only at 600 μs (Fig. 5c). For example, the N37-Hδ1 (ΔS/S0 = 0.3), N37-Hδ2 (ΔS/S0 = 0.5) and W43-Hε (ΔS/S0 = 0.3) signals appear with significant intensity. In general, helical Asn/Gln residues have shorter distances from the sidechain amines to the backbone 13Cα atoms (3.2-4.2 Å distance between amine 1H and intraresidue Cα or i±1 residue Cα) than the sidechain amine of those residues in β-strands (4-5.5 Å distance between amine 1H and intraresidue 13Cα). In GB1, Q2 and N8 are on β-strands, whereas Q32, N35 and N37 are on the helix. In particular, the intraresidue distances to Cα are 3.2 Å for Q32-Hε1, 3.4 Å for N37-Hδ1, and 4.2 Å for N35-Hδ2. In addition to the short intraresidue distances, helical Asn/Gln residues can have relatively short interresidue Cα distances; both D36 (4.2 Å) and A34 (4.3 Å) Cα sites contribute to the N37δ1 dephasing, which is the strongest among all the sidechain signals here.
Fig. 5.
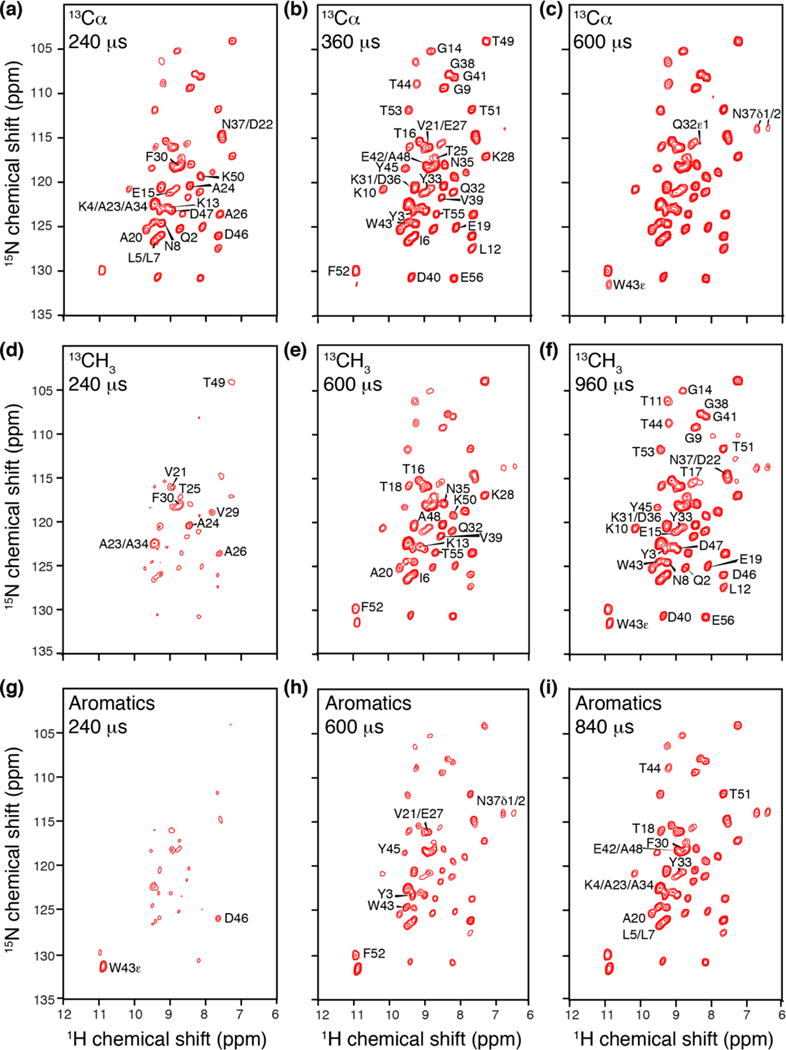
13C dephased 15N-1H REDOR difference spectra (S0-S) collected on uniformly 2H, 13C, 15N labeled GB1 protein, back exchanged with 30% 1HN. (a–c) Spectra with 13Cα dephasing at 240 μs, 360 μs and 600 μs respectively. (d–f) Spectra with 13C(methyl) dephasing at 240 μs, 600 μs and 960 μs. (g–i) 13C(aromatic) dephasing at 240 μs, 600 μs and 840 μs.
Extent of methyl-13C dephasing depends on secondary structure
The second version of the experiment was performed with methyl-specific dephasing. It is notable that even for small methyl-bearing residues (Ala, Thr and Val), the 1HN and 13C(methyl) are separated by at least three bonds and therefore the internuclear distance depends on the backbone ϕ angle (for all cases) and additionally on the χ1 angle for Thr and Val. This is notable and unlike the 15N-13Cβ distance in Ala, for example, which is ~2.5 Å and invariant to dihedral angles, or the 15N-13Cγ distances in Thr and Val which depend only on χ1. As a result of the 1HN-13C(methyl) conformation dependence, at 240 μs REDOR time (Fig. 5d) the methyl-bearing helical residues (A23/A34, A24, T25, A26 and V29) appear with greatest intensity (ΔS/S0 > 0.2), along with some loop (V21 and T49) and residues neighboring methyls (F30). No β-strand residues show up at this short REDOR time; thus the effect in this case begins to provide a restraint on secondary structure. At increasing mixing time (Fig. 5e) the magnitude of the REDOR effect increases (ΔS/S0 > 0.5) and additional methyl-bearing residues (I6, T16, T18, A20, V39, A48 and T55) show up prominently. In addition there are sites that begin to report on longer-range interactions, such as K13 and Q32. After 960 μs of dephasing (Fig. 5f), almost all the backbone amide 1H start showing strong modulation in intensity (ΔS/S0 > 0.5). Thus the most informative mixing times for the methyl-dephased version of the experiment are in the range 240 to 600 μs.
Aromatic dephasing reveals tertiary contacts
Performing the aromatic-selective version selects for 13C sites that are at least (for the 13Cγ) four bonds from the intraresidue 1HN and often (for the remainder of the ring) closer to the amides of neighboring or long-range residues. This observation is immediately apparent in Fig. 5g, since GB1 has six aromatic residues (Y3, F30, Y33, W43, Y45 and F52), yet roughly 15 peaks show similar intensities at short REDOR time, and none of the aromatic residues show strong attenuation in intensity of their own backbone amide 1H. In fact, the two strongest REDOR effects are observed to W43-Hε (which has two aromatic 13C sites, 13Cδ1 and 13Cδ2, within ~2.2 Å bonds of the Hε) and, surprisingly, D46. (We will discuss this observation further in the following section). Within 600 μs or aromatic REDOR 13C dephasing (Fig. 5h), the backbone amide 1HN signals of the aromatic residues appear, and Y3, W43, Y45 and F52 exhibit ΔS/S0 > 0.4. Few other non-aromatic amino acids like V21/E27, N37 (sidechain) also show substantial REDOR effects at this time point, and the magnitude continues to increase as expected at 840 μs (Fig. 5i).
Quantitation of REDOR effects and structural interpretation
In order to investigate the more nuanced site-specific details of the REDOR effects observed above, we examined the intensity changes (ΔS/S0) of the 15N-1H correlations by residue number at 600 μs for the methyl and aromatic versions of the experiment (Fig. 6). The plot of the methyl-dephased data (Fig. 6a) illustrates the extent of backbone and sidechain 1HN sites that have been dephased. To examine the detailed variations in REDOR effects and their relationships to the structural elements, we modeled the 1HN positions using WHATIF web server (Add Protons to the Structure)40 and the high-resolution crystal structure (PDB 2QMT). Then we considered the distances from 1HN to methyl 13C sites. Almost all backbone 1HN sites are within 5 Å of some methyl groups, and so the average ΔS/S0 value is ~0.4, but some sites show significantly larger effects (ΔS/S0 > 0.6). For example, helical Ala residues exhibit nearly the shortest possible intraresidue HN-C(methyl) distance, which is 2.5 Å because a ϕ angle of -60° results in an eclipsed HN-Cβ (HN-N-Cα-Cβ dihedral of ~0°). Therefore A23 and A34 exhibit a REDOR effect of >0.6 at 600 μs, and even larger effects are observed for A24 and A26, which have additional interresidue HN-C(methyl) distances of < 3.5 Å. Specifically, the A24-HN to A23-Cβ distance is 3.3 Å and the A26-HN to A20-Cβ distance is 3.2 Å (Fig. 7a).
Fig. 6.
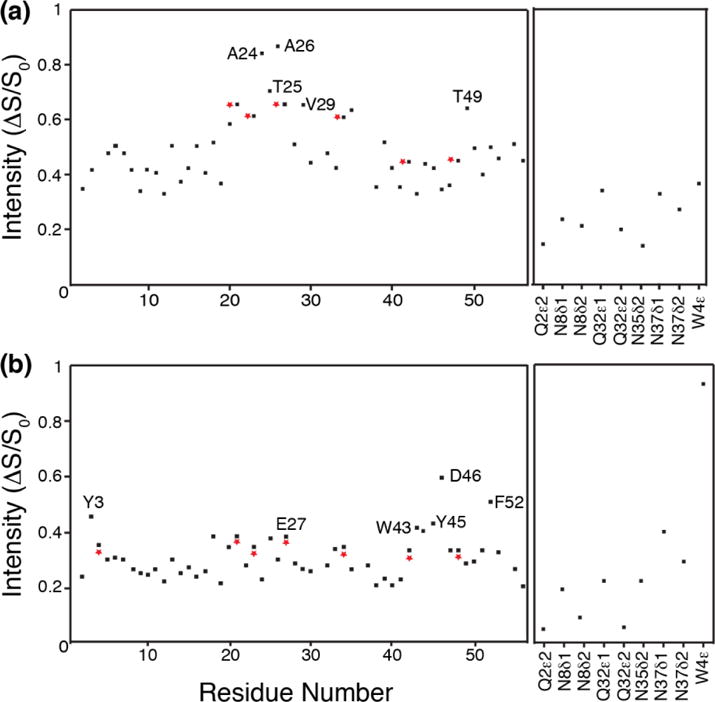
Plot of S/S0 intensity vs backbone amide (left) and sidechain (right) amino protons in uniformly labeled 2H, 13C, 15N labeled GB1 protein, back-exchanged with 30% amide protons. (a) shows the plot for 13CH3 dephasing for 600 us, and (b) shows the plot for aromatic 13C dephasing for 600 us. The residues showing maximum dephasing have been labeled. Red asterisks indicate that the corresponding residues have overlapped peaks in the 15N-1H spectrum.
Fig. 7.
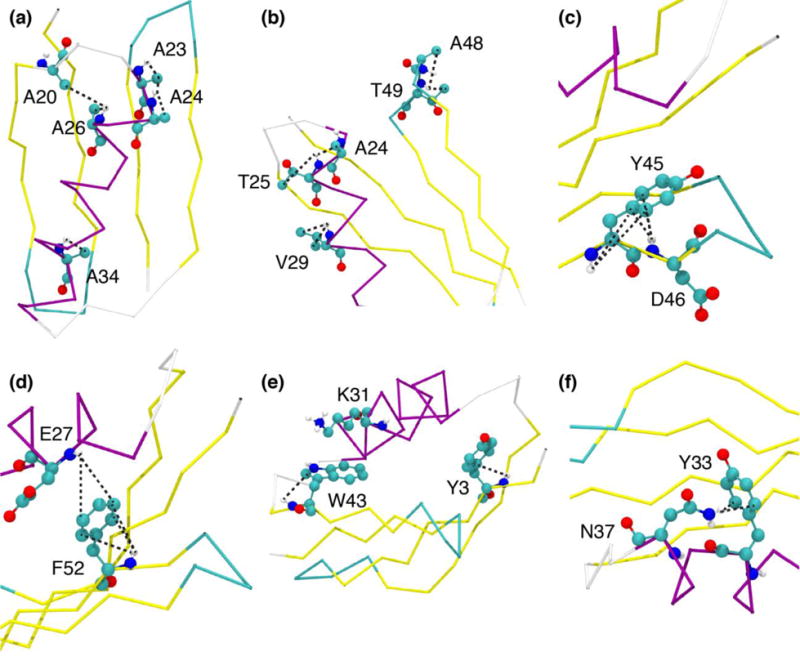
(a–f): GB1 structure illustrating origins of REDOR effects for the methyl bearing and aromatic residues. (a–b) shows a few methyl bearing residues Ala (a) and Thr,Val (b), (c) shows Y45 and D46, (d) shows F52 and E27, (e) shows Y3, K31 and W43, (f) shows Y33 and N37. The black dotted lines indicate the distances between 1HN and C(methyl) (a–b) and C(aromatics) (c–f). Figure f shows distances to sidechain amino 1H of N37. All the figures have been rendered in VMD.
For Thr and Val residues, the HN-C(methyl) distances range from 2.6 to 3.0 Å for eclipsed or gauche conformations. For example, T49 (despite being present in a turn), has a HN-Cγ2 methyl distance of 3 Å, as well as an interresidue T49HN-A48Cβ distance of 3.3 Å, leading to leading to a strong REDOR effect of ~0.65 at 600 μs. V29, within the helix, has ΔS/S0 > 0.6, arising from the HN-Cγ1 distance of 2.9 Å (the HN-Cγ2 distance is 4 Å). T25 is another helical residue that demonstrates a large ΔS/S0 (>0.7), in this case due to the short interresidue distance of 3.0 Å from T25-HN to A24-Cβ, which is significantly shorter than the T25HN-Cγ2 intraresidue distance of 4 Å (Fig. 7b). Thus the strongest methyl-13C-dephased REDOR effects (ΔS/S0 between 0.6 and 0.8 at ~600 μs) arise from Ala residues in helical conformations or from some Thr/Val residues with favorable conformations. A number of other methyl-bearing residues or neighbors of methyl-bearing residues show REDOR effects are between 0.4-0.6.
Dynamics plays an important role in determining the REDOR effects shown by methyl groups. The C3 axes of the methyl groups can undergo libration, thereby attenuating the 1HN-13C dipolar couplings. The methyl bearing residues whose side chains are extended in the solvent and not buried within the protein core will show such librational motions. One particular example in GB1 protein consists of V21 and V29. V21 is in a turn, with the 1HN-Cγ1 distance as 2.6 Å and 1HN-Cγ2 distance as 3 Å. Hence, V21 should show larger REDOR effect than V29. But as mentioned in Shi et al.32, the side chain of V21 is more mobilized than that of V29. This should explain the similar REDOR effects shown by V21 and V29.
Fig 6b plots the S/S0 intensity versus the residue number for the backbone 1HN and sidechain amino group 1H for aromatic residues at 600 μs. The strong 13C-13C dipolar interactions present in a fully 13C labeled protein results in an average ΔS/S0 of 0.2. The residue showing the biggest REDOR effect (ΔS/S0 ~0.6) at 600 μs is surprisingly not an aromatic residue, but a neighboring one, D46, which we attribute to the Y45 aromatic ring being trans relative to its intraresidue 1HN (distances >4.3 Å) but in much closer proximity to D46HN; the distances from D46HN to Y45Cδ2, Y45Cγ and Y45Cδ1 are 3 Å, 3.3 Å and 4.1 Å respectively (Fig. 7c). Hence, the REDOR effect shown by Y45 is ~0.45. F52 shows the strongest intraresidue REDOR effects among the aromatic residues (ΔS/S0 ~ 0.5), given a gauche conformation and F52HN-Cδ1 distance of 3 Å, as well as other aromatic carbons within 4.5 Å of the amide. The F52 aromatic ring is also responsible for dephasing of the E27HN which is ~4.3 Å from the F52Cε (Fig. 7d); the E27 REDOR effect of 0.4 is second strongest among the non-aromatic residues. Y3 and W43 are the two other aromatic residues that have intraresidue REDOR effects > 0.4. Both Y3 and W43 aromatic rings are in a gauche conformation with respect to the HN (Fig 7e). Y3 1HN- Cγ distance is 3.4 Å. W43 1HN-Cδ1 distance is 3.5 Å. A surprising observation among the sidechain amines is N37δ1, which shows a REDOR effect of ~0.4, due to its orientation relative to the Y33 aromatic ring (Fig. 7f); the N37Hδ1 to Y33Cδ distance is 3.3 Å.
To summarize, for aromatic residues with gauche conformations, the HN REDOR effects are between 0.4 and 0.6 at 600 μs. This is observed for Y3, W43 and F52 in GB1. Substantially weaker intraresidue REDOR effects are observed for trans conformations (Y33 and Y45), and in these cases the neighboring (i+1) residues can show larger effects, as we observed for A34 and D46. In some cases, long-range effects are detected involving the sidechain protons, such as in the case of N37.
We note that for the aromatic version of the experiment utilized here, the soft pulse was centered among the aromatic signals at ~130 ppm, with a bandwidth of ~15-16 ppm, thus exciting the region from ~122 to ~138 ppm. This region encompasses the majority of aromatic frequencies, but with some notable exceptions. For example, we might expect some attenuation of REDOR effects for Tyr Cε sites with upfield shifts (~120 ppm), and clearly the Tyr Cζ at ~160 ppm is outside of the range noted here. For Trp, the Cδ atoms were inverted by the soft pulses here, but Cγ (110 ppm) was outside of the bandwidth and other carbons would be near the edge of the soft pulse (Cε at 120 ppm or 140 ppm and Cζ at 120 ppm). Finally the Phe Cγ atom is near the edge at 140 ppm. It is apparent that the effects are sensitive to this range of offset, and given this large range of possible excitable frequencies, further selectivity could be achieved with soft pulses centered at ~160 ppm or ~110 ppm in order to detect backbone correlations in a residue-specific manner. For example, narrower bandwidth pulses could be used to detect the W43Cζ long-range distances, such as the K31HN (Fig 7e). There are many additional opportunities for more selectivity and given the long T2 values observed, detection of at least 10 Å distances may be feasible.
Conclusions
The 1H-detected FSR pulse sequence introduced here is a broadly applicable technique for measuring long-range distances in SSNMR and leverages the high sensitivity of 1H detection in combination with fast MAS. The REDOR difference spectra are collected as 2D 15N-1H planes, so majority of the residues in the protein can be site-specifically resolved. Involving 1H as one of the nuclei in the dipolar coupled spin pair also enhances the distance measurement range. No multiple pulse sequences are required for effective 1H-1H dipolar decoupling, given the fast MAS rates and deuteration. Another advantage of deuteration is enhancement of echo lifetimes of the detected nucleus (1H), thereby increasing potential distance measurement range.
This method can be used with backbone 13C dephasing for purposes of spectral filtering, and the methyl- and aromatic-selective versions give insights into the secondary and tertiary structure of the protein. Specifically, the dephasing by the methyl bearing residues is stronger in general for helical residues, particularly Ala, and Thr or Val residues helical/loop regions can also yield strong REDOR effects (ΔS/S0 > 0.6) at 600 μs dephasing time. The aromatic-specific version gives some initial insights into tertiary structure, since aromatic rings can be significantly closer to neighboring or long-range amides than intraresidue amides (e.g., Y33, Y45). This information can also restrain the side chain orientation of the aromatic ring with respect to its own backbone amide proton, based on the relative REDOR magnitude.
We envision that this approach can be extended to incorporate 31P or 19F dephasing in the case of phospholipids or fluorinated drugs bound to proteins. Notably, the detection range for 1H{19F} REDOR effects with >10 ms 1H T2 values would be well in excess of 15 Å. We also anticipate that the large REDOR effects observed here could facilitate 3D TEDOR studies13 on sparsely 13C-isotopically labeled samples15. Sparse labeling in this case would be necessary in order to minimize signal loss due to recoupling of 13C-13C interactions from directly attached pairs. Using these approaches, 1H-detected FSR has excellent potential for improving biomolecular SSNMR-based structure determination with enhanced sensitivity, resolution and distance measurement range.
Supplementary Material
Acknowledgments
This work was funded by National Institutes of Health (NIH) grant R01-GM123455 to C.M.R. We also thank Dr. Xiangyan Shi for preparation of the GB1 sample.
Footnotes
Supporting Information
Supporting Information includes two figures. Fig. S1 demonstrates the disadvantage of applying REDOR π-pulse trains on 1H channel. Fig. S2 shows plots and fits of 1H T2 of six residues in GB1 protein.
Contributor Information
Manali Ghosh, Department of Chemistry, University of Illinois at Urbana-Champaign, 600 South Mathews Avenue, Urbana, IL 61801, USA.
Chad M. Rienstra, Department of Chemistry, University of Illinois at Urbana-Champaign, 600 South Mathews Avenue, Urbana, IL 61801, USA; Center for Biophysics and Quantitative Biology, University of Illinois at Urbana-Champaign, 600 South Mathews Avenue, Urbana, IL 61801, USA; Department of Biochemistry, University of Illinois at Urbana-Champaign, 600 South Mathews Avenue, Urbana, IL 61801, USA.
References
- 1.Petkova AT, Ishii Y, Balbach JJ, Antzutkin ON, Leapman RD, Delaglio F, Tycko R. A Structural Model for Alzheimer’s β-Amyloid Fibrils Based on Experimental Constraints from Solid-State NMR. Proc Natl Acad Sci U S A. 2002;99:16742–16747. doi: 10.1073/pnas.262663499. [DOI] [PMC free article] [PubMed] [Google Scholar]
- 2.Schutz AK, Soragni A, Hornemann S, Aguzzi A, Ernst M, Bockmann A, Meier BH. The Amyloid-Congo Red Interface at Atomic Resolution. Angew Chem Int Ed Engl. 2011;50:5956–5960. doi: 10.1002/anie.201008276. [DOI] [PubMed] [Google Scholar]
- 3.Lu JX, Qiang W, Yau WM, Schwieters CD, Meredith SC, Tycko R. Molecular Structure of β-Amyloid Fibrils in Alzheimer’s Disease Brain Tissue. Cell. 2013;154:1257–1268. doi: 10.1016/j.cell.2013.08.035. [DOI] [PMC free article] [PubMed] [Google Scholar]
- 4.Prade E, Bittner HJ, Sarkar R, Lopez Del Amo JM, Althoff-Ospelt G, Multhaup G, Hildebrand PW, Reif B. Structural Mechanism of the Interaction of Alzheimer Disease Aβ Fibrils with the Non-Steroidal Anti-Inflammatory Drug (NSAID) Sulindac Sulfide. J Biol Chem. 2015;290:28737–28745. doi: 10.1074/jbc.M115.675215. [DOI] [PMC free article] [PubMed] [Google Scholar]
- 5.Tuttle MD, Comellas G, Nieuwkoop AJ, Covell DJ, Berthold DA, Kloepper KD, Courtney JM, Kim JK, Barclay AM, Kendall A, et al. Solid-State NMR Structure of a Pathogenic Fibril of Full-Length Human α-Synuclein. Nat Struct Mol Biol. 2016;23:409–415. doi: 10.1038/nsmb.3194. [DOI] [PMC free article] [PubMed] [Google Scholar]
- 6.Walti MA, Ravotti F, Arai H, Glabe CG, Wall JS, Bockmann A, Guntert P, Meier BH, Riek R. Atomic-Resolution Structure of a Disease-Relevant Aβ(1–42) Amyloid Fibril. Proc Natl Acad Sci U S A. 2016;113:E4976–E4984. doi: 10.1073/pnas.1600749113. [DOI] [PMC free article] [PubMed] [Google Scholar]
- 7.Colvin MT, Silvers R, Ni QZ, Can TV, Sergeyev I, Rosay M, Donovan KJ, Michael B, Wall J, Linse S, et al. Atomic Resolution Structure of Monomorphic Aβ42 Amyloid Fibrils. J Am Chem Soc. 2016;138:9663–9674. doi: 10.1021/jacs.6b05129. [DOI] [PMC free article] [PubMed] [Google Scholar]
- 8.Gullion T, Schaefer J. Rotational-Echo Double-Resonance NMR. J Magn Reson. 1989;81:196–200. doi: 10.1016/j.jmr.2011.09.003. [DOI] [PubMed] [Google Scholar]
- 9.Gullion T, Schaefer J. Detection of Weak Heteronuclear Dipolar Coupling by Rotational-Echo Double-Resonance Nuclear-Magnetic-Resonance. Adv Magn Reson. 1989;13:57–83. [Google Scholar]
- 10.Pan Y, Gullion T, Schaefer J. Determination of C-N Internuclear Distances by Rotational-Echo Double-Resonance NMR of Solids. J Magn Reson. 1990;90:330–340. [Google Scholar]
- 11.Strojek W, Eckert H. Medium-Range Order in Sodium Phosphate Glasses: a Quantitative Rotational Echo Double Resonance Solid State NMR Study. Phys Chem Chem Phys. 2006;8:2276–2285. doi: 10.1039/b518080e. [DOI] [PubMed] [Google Scholar]
- 12.Cegelski L. REDOR NMR for Drug Discovery. Bioorg Med Chem Lett. 2013;23:5767–5775. doi: 10.1016/j.bmcl.2013.08.064. [DOI] [PMC free article] [PubMed] [Google Scholar]
- 13.Jaroniec CP, Filip C, Griffin RG. 3D TEDOR NMR Experiments for the Simultaneous Measurement of Multiple Carbon-Nitrogen Distances in Uniformly 13C, 15N-Labeled Solids. J Am Chem Soc. 2002;124:10728–10742. doi: 10.1021/ja026385y. [DOI] [PubMed] [Google Scholar]
- 14.Nieuwkoop AJ, Wylie BJ, Franks WT, Shah GJ, Rienstra CM. Atomic Resolution Protein Structure Determination by Three-Dimensional Transferred Echo Double Resonance Solid-State Nuclear Magnetic Resonance Spectroscopy. J Chem Phys. 2009;131:095101. doi: 10.1063/1.3211103. [DOI] [PMC free article] [PubMed] [Google Scholar]
- 15.Nieuwkoop AJ, Rienstra CM. Supramolecular Protein Structure Determination by Site-Specific Long-Range Intermolecular Solid State NMR Spectroscopy. J Am Chem Soc. 2010;132:7570–7571. doi: 10.1021/ja100992y. [DOI] [PMC free article] [PubMed] [Google Scholar]
- 16.Wi S, Sinha N, Hong M. Long-Range 1H-19F Distance Measurement in Peptides by Solid-State NMR. J Am Chem Soc. 2004;126:12754–12755. doi: 10.1021/ja0462732. [DOI] [PubMed] [Google Scholar]
- 17.Zhou DH, Shah G, Cormos M, Mullen C, Sandoz D, Rienstra CM. Proton-Detected Solid-State NMR Spectroscopy of Fully Protonated Proteins at 40 kHz Magic-Angle Spinning. J Am Chem Soc. 2007;129:11791–11801. doi: 10.1021/ja073462m. [DOI] [PubMed] [Google Scholar]
- 18.Linser R, Dasari M, Hiller M, Higman V, Fink U, Lopez del Amo JM, Markovic S, Handel L, Kessler B, Schmieder P, et al. Proton-Detected Solid-State NMR Spectroscopy of Fibrillar and Membrane Proteins. Angew Chem Int Ed Engl. 2011;50:4508–4512. doi: 10.1002/anie.201008244. [DOI] [PubMed] [Google Scholar]
- 19.Zhou DH, Nieuwkoop AJ, Berthold DA, Comellas G, Sperling LJ, Tang M, Shah GJ, Brea EJ, Lemkau LR, Rienstra CM. Solid-State NMR Analysis of Membrane Proteins and Protein Aggregates by Proton Detected Spectroscopy. J Biomol NMR. 2012;54:291–305. doi: 10.1007/s10858-012-9672-z. [DOI] [PMC free article] [PubMed] [Google Scholar]
- 20.Stanek J, Andreas LB, Jaudzems K, Cala D, Lalli D, Bertarello A, Schubeis T, Akopjana I, Kotelovica S, Tars K, et al. NMR Spectroscopic Assignment of Backbone and Side-Chain Protons in Fully Protonated Proteins: Microcrystals, Sedimented Assemblies, and Amyloid Fibrils. Angew Chem Int Ed Engl. 2016;55:15504–15509. doi: 10.1002/anie.201607084. [DOI] [PubMed] [Google Scholar]
- 21.Andreas LB, Le Marchand T, Jaudzems K, Pintacuda G. High-Resolution Proton-Detected NMR of Proteins at Very Fast MAS. J Magn Reson. 2015;253:36–49. doi: 10.1016/j.jmr.2015.01.003. [DOI] [PubMed] [Google Scholar]
- 22.Akbey U, Lange S, Trent Franks W, Linser R, Rehbein K, Diehl A, van Rossum BJ, Reif B, Oschkinat H. Optimum Levels of Exchangeable Protons in Perdeuterated Proteins for Proton Detection in MAS Solid-State NMR Spectroscopy. J Biomol NMR. 2010;46:67–73. doi: 10.1007/s10858-009-9369-0. [DOI] [PubMed] [Google Scholar]
- 23.Zhou DH, Graesser DT, Franks WT, Rienstra CM. Sensitivity and Resolution in Proton Solid-State NMR at Intermediate Deuteration Levels: Quantitative Linewidth Characterization and Applications to Correlation Spectroscopy. J Magn Reson. 2006;178:297–307. doi: 10.1016/j.jmr.2005.10.008. [DOI] [PubMed] [Google Scholar]
- 24.Zhou DH, Shea JJ, Nieuwkoop AJ, Franks WT, Wylie BJ, Mullen C, Sandoz D, Rienstra CM. Solid-State Protein-Structure Determination with Proton-Detected Triple-Resonance 3D Magic-Angle-Spinning NMR Spectroscopy. Angew Chem Int Ed Engl. 2007;46:8380–8383. doi: 10.1002/anie.200702905. [DOI] [PMC free article] [PubMed] [Google Scholar]
- 25.Knight MJ, Webber AL, Pell AJ, Guerry P, Barbet-Massin E, Bertini I, Felli IC, Gonnelli L, Pierattelli R, Emsley L, et al. Fast Resonance Assignment and Fold Determination of Human Superoxide Dismutase by High-Resolution Proton-Detected Solid-State MAS NMR Spectroscopy. Angew Chem Int Ed Engl. 2011;50:11697–11701. doi: 10.1002/anie.201106340. [DOI] [PubMed] [Google Scholar]
- 26.Yao XL, Schmidt-Rohr K, Hong M. Medium- and Long-Distance 1H-13C Heteronuclear Correlation NMR in Solids. J Magn Reson. 2001;149:139–143. [Google Scholar]
- 27.Yao XL, Hong M. Dipolar Filtered 1H-13C Heteronuclear Correlation Spectroscopy for Resonance Assignment of Proteins. J Biomol NMR. 2001;20:263–274. doi: 10.1023/a:1011251924874. [DOI] [PubMed] [Google Scholar]
- 28.Kiihne SR, Creemers AF, de Grip WJ, Bovee-Geurts PH, Lugtenburg J, de Groot HJ. Selective Interface Detection: Mapping Binding Site Contacts in Membrane Proteins by NMR Spectroscopy. J Am Chem Soc. 2005;127:5734–5735. doi: 10.1021/ja045677r. [DOI] [PubMed] [Google Scholar]
- 29.Lee M, Goldburg WI. Nuclear-Magnetic-Resonance Line Narrowing by a Rotating Rf Field. Phys Rev. 1965;140:A1261–A1271. [Google Scholar]
- 30.Jaroniec CP, Tounge BA, Herzfeld J, Griffin RG. Frequency Selective Heteronuclear Dipolar Recoupling in Rotating Solids: Accurate 13C-15N Distance Measurements in Uniformly 13C, 15N -Labeled Peptides. J Am Chem Soc. 2001;123:3507–3519. doi: 10.1021/ja003266e. [DOI] [PubMed] [Google Scholar]
- 31.Franks WT, Zhou DH, Wylie BJ, Money BG, Graesser DT, Frericks HL, Sahota G, Rienstra CM. Magic-Angle Spinning Solid-State NMR Spectroscopy of the β1 Immunoglobulin Binding Domain of Protein G (GB1): 15N and 13C chemical shift assignments and conformational analysis. J Am Chem Soc. 2005;127:12291–12305. doi: 10.1021/ja044497e. [DOI] [PubMed] [Google Scholar]
- 32.Shi X, Rienstra CM. Site-Specific Internal Motions in GB1 Protein Microcrystals Revealed by 3D 2H-13C-13C Solid-State NMR Spectroscopy. J Am Chem Soc. 2016;138:4105–4119. doi: 10.1021/jacs.5b12974. [DOI] [PMC free article] [PubMed] [Google Scholar]
- 33.Metz G, Wu XL, Smith SO. Ramped-Amplitude Cross-Polarization in Magic-Angle-Spinning NMR. J Magn Reson Ser A. 1994;110:219–227. [Google Scholar]
- 34.Bennett AE, Rienstra CM, Auger M, Lakshmi KV, Griffin RG. Heteronuclear Decoupling in Rotating Solids. J Chem Phys. 1995;103:6951–6958. [Google Scholar]
- 35.Kotecha M, Wickramasinghe NP, Ishii Y. Efficient Low-Power Heteronuclear Decoupling in 13C High-Resolution Solid-State NMR Under Fast Magic Angle Spinning. Magn Reson Chem. 2007;45:S221–S230. doi: 10.1002/mrc.2151. [DOI] [PubMed] [Google Scholar]
- 36.Zhou DH, Rienstra CM. High-Performance Solvent Suppression for Proton Detected Solid-State NMR. J Magn Reson. 2008;192:167–172. doi: 10.1016/j.jmr.2008.01.012. [DOI] [PMC free article] [PubMed] [Google Scholar]
- 37.Shaka AJ, Keeler J, Freeman R. Evaluation of a New Broad-Band Decoupling Sequence - Waltz-16. J Magn Reson. 1983;53:313–340. [Google Scholar]
- 38.Morcombe CR, Zilm KW. Chemical Shift Referencing in MAS Solid-State NMR. J Magn Reson. 2003;162:479–486. doi: 10.1016/s1090-7807(03)00082-x. [DOI] [PubMed] [Google Scholar]
- 39.Delaglio F, Grzesiek S, Vuister GW, Zhu G, Pfeifer J, Bax A. NMRPipe: a Multidimensional Spectral Processing System Based on UNIX Pipes. J Biomol NMR. 1995;6:277–293. doi: 10.1007/BF00197809. [DOI] [PubMed] [Google Scholar]
- 40.Hekkelman ML, Te Beek TA, Pettifer SR, Thorne D, Attwood TK, Vriend G. WIWS: a Protein Structure Bioinformatics Web Service Collection. Nucleic Acids Res. 2010;38:W719–23. doi: 10.1093/nar/gkq453. [DOI] [PMC free article] [PubMed] [Google Scholar]
Associated Data
This section collects any data citations, data availability statements, or supplementary materials included in this article.


