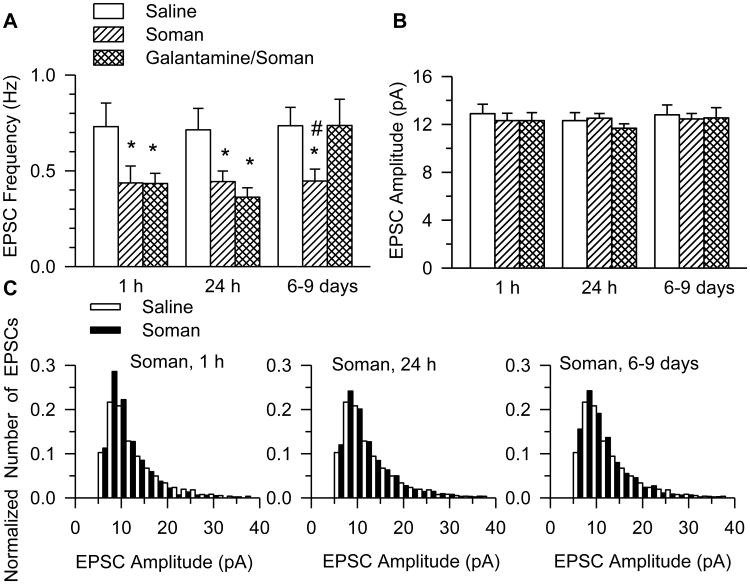
Figure 2. Frequency and amplitude of EPSCs recorded from CA1pyramidal neurons of galantamine-treated and untreated guinea pigs that were challenged with soman.
Graphs show the mean frequency (A) and amplitude (B) of EPSCs recorded from neurons in slices obtained at 1 h, 24 h, or 6-9 days after injection of saline, 1xLD50 soman, or galantamine (8 mg/kg) followed 30 min later by the injection of 1xLD50 soman. Graph and error bars represent mean and SEM, respectively, of results obtained from each of the three treatment groups. The total number of neurons from which recordings were obtained at 1 h, 24 h, and 6-9 days after the injections were, respectively, as follows: 8 (7 guinea pigs), 8 (7 guinea pigs), and 10 (10 guinea pigs) in the saline group; 10 (9 guinea pigs), 17 (15 guinea pigs), and 17 (14 guinea pigs) in the soman group; and 11 (8 guinea pigs), 9 (8 guinea pigs) and 8 (6 guinea pigs) in the galantamine/soman group. According to two-way ANOVA using treatment and testing time as factors, there was a significant main effect of treatment (p < 0.001), no significant main effect of testing time (p = 0.12), and no interaction treatment × testing time (p = 0.18) on the EPSC frequency. Post-hoc Fisher's LSD test for multi-group comparison revealed significant differences between treatments: *, p < 0.05 compared to saline, and #, p < 0.05 compared to galantamine/soman. C. Histograms show the distribution of amplitudes of EPSCs recorded from soman- and saline-injected guinea pigs. Challenge of the guinea pigs with soman did not alter the EPSC amplitude distribution.

