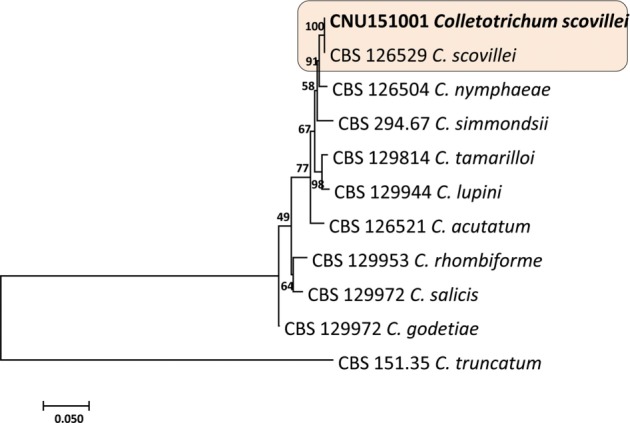
Fig. 2. Phylogenetic tree generated by a maximum parsimony analysis of a combined dataset of internal transcribed spacer (ITS), glyceraldehyde 3-phosphate dehydrogenase (GAPDH), and TUB2 gene sequences of Colletotrichum scovillei and those of other related Colletotrichum spp. described by Damm et al. (2012) [26]. Number beside each branch represent bootstrap values obtained after a bootstrap test with 1,000 replications. Bar indicates the number of nucleotide substitutions. The fungal strain analyzed in current study shown in boldface. C. truncatum (CBS 151.35) served as the out-group.

