

Abstract
Influence of diabetes mellitus (DM) and diabetic retinopathy (DR) on parafoveal retinal thicknesses and their ratios was evaluated. Six retinal layer boundaries were segmented from spectral-domain optical coherence tomography images using open-source software. Five study groups: (1) healthy control (HC) subjects, and subjects with (2) controlled DM, (3) uncontrolled DM, (4) controlled DR and (5) uncontrolled DR, were identified. The one-way analyses of variance (ANOVA) between adjacent study groups (i.e. 1 with 2, 2 with 3, etc) indicated differences in retinal thicknesses and ratios. Overall retinal thickness, ganglion cell layer (GCL) thickness, inner plexiform layer (IPL) thickness, and their combination (GCL+ IPL), appeared to be significantly less in the uncontrolled DM group when compared to controlled DM and controlled DR groups. Although the combination of nerve fiber layer (NFL) and GCL, and IPL thicknesses were not different, their ratio, (NFL+GCL)/IPL was found to be significantly higher in the controlled DM group compared to the HC group. Comparisons of the controlled DR group with the controlled DM group, and with the uncontrolled DR group, do not show any differences in the layer thicknesses, though several significant ratios were obtained. Ratiometric analysis may provide more sensitive parameters for detecting changes in DR.
Keywords: Diabetes mellitus, Diabetic retinopathy, Optical coherence tomography, Macula, Retina, Clinical image analysis
Graphical abstract
Representative segmented OCT image of the human retina.

1. Introduction
Diabetes is a significant disease that has resulted in visual limitations and blindness worldwide[1]. The ocular manifestation of diabetic disease is called diabetic retinopathy (DR), which is the leading cause of vision loss in adults aged 20–74 years[2]. Profound vision loss can result from DR due to retinal detachment, macular edema or macular ischemia, and vitreous hemorrhage from neovascularization (new blood vessel growth)[2]. Early detection of anatomical changes from DR and initiation of treatment prior to the development of permanent damage are key to prevention of vision loss in affected individuals. DR develops from chronic high blood sugar levels, which can present in uncontrolled Diabetes Type 1 after 5 years or at any time following the diagnosis of Diabetes Type 2[3]. In DR, breakdown of the inner blood-retinal barrier with leakage of plasma from small blood vessels is responsible for the swelling of the central retina and the development of diabetic macular edema (DME). In diabetic patients, hemoglobin A1c (HbA1c) is widely used as an index of glycemic control. This can serve as a measure of risk for the development of diabetic complications[4]. Treatments are available for patients with DR and DME, and early detection and intervention for such eye diseases leads to better vision outcomes.
Detection of DR and DME has been revolutionized by the use of optical coherence tomography (OCT) in ophthalmology clinics. OCT is a noninvasive imaging modality extensively used for clinical imaging of the retina[5, 6]. Recent advances in research-based systems have made ultrahigh resolution OCT available with 2.5 – 3.0 micron axial image resolution at ∼ 100,000 axial scans per second[7]. Several image processing based techniques were developed to segment retinal OCT images[8–12], which provide useful information about different internal layers of retina in diagnosing diseases including glaucoma, multiple sclerosis and DR.
The changes from DR include early changes in the retinal thickness which can appear before larger-scale morphological damage develops[13]. Several groups have reported that overall retinal (OR) thickness is decreased in diabetic patients with no or minimal DR compared with healthy controls (HC)[9, 14–16]. This may reflect the neurodegenerative changes in the diabetic retina[9]. The ganglion cell layer (GCL) thickness and the combined thicknesses of the GCL and inner plexiform layer (IPL) remained significantly thinner in patients with Diabetes Type 1 with no or minimal DR, compared to the healthy control (HC) group, which could be explained by a loss of intraretinal neural tissue in the earliest stage of DR[14, 17]. In addition, a decrease in the inner retinal thickness in the macula in Type 1 diabetics with no or minimal DR compared to HC has also been reported. This difference may represent initial ganglion cell (GC) loss in the pericentral areas and retinal nerve fiber layer (RNFL) thinning in the peripheral macula[18]. OCT can predict the early stages of DR by measuring the increase in macular thickness[19].
Further, segmentation of 5 intra-retinal layers of spectral domain (SD) OCT images may be a useful tool to diagnose and monitor early intra-retinal changes in DR such as decrease in RNFL thickness and increase INL/OPL thickness in diabetics without DR or with initial DR, although the outer retina may not be affected in the early stages of diabetes mellitus (DM)[20]. Thinning of the NFL to IPL in obese mice[21], and ganglion cell-inner plexiform layer (GCIPL) in resolved DME eyes compared to no DME eyes[22], have also been reported as predictive markers for diabetic changes. In a recent study, a diagnostic test for referable DR based on central foveal thickness from OCT images was proposed to confirm or rule out the disease[23]. Moreover, significant reductions were also observed in the GC- IPL and RNFL thickness values in patient groups with both no-DR and mild non-proliferative DR (type-2 DM) compared with HC[24]. Potential changes in sub-retinal layers may provide sufficient indication for effective early disease screening. However, it is also reported that OR thickness is not necessarily an early indicator for DM[25].
Although OCT has been used for such retinal thickness analysis, subtle changes in multiple layers is not always perceptible from the analysis. The goal of this study was to investigate subtle changes in retinal layer thicknesses and their ratios from circumferential scans in the parafoveal area. In an earlier report, we presented a ratiometric analysis of layer thicknesses and ratios in the retinas of diabetic and HC subjects that revealed a statistically different set of thickness ratio values for diabetic patients including (ILM-IPL)/(INL-IPL), where ILM was the inner limiting membrane and INL was the inner nuclear layer[26]. The analysis was performed on B-scans through the fovea after manually segmenting 6 layer boundaries, and points corresponding to foveal, parafoveal and perifoveal regions were chosen for the analysis[26]. In the current study, we used circumferential scans through the parafoveal zone that were centered over the fovea to obtain a more dense sampling within this area for analysis than single spatial points chosen from B-scan images. Additionally, the circular scans were more reliably segmented as compared to other macular scans. Further, it normalizes inter-subject variance of overall retinal thickness and subject demographics, and mitigates error due to scan tilt in the image, thus providing access to a larger palette of analysis metrics.
2. Material and methods
2.1 Human subjects
The protocol for this study was reviewed and approved by the Institutional Review Boards at Carle Foundation Hospital and the University of Illinois at Urbana-Champaign. The research adhered to HIPAA standards and all participants signed an informed consent prior to participating in the study. Potential subjects were identified by a Carle Foundation Hospital (Urbana, IL) board-certified ophthalmologist based on history of diabetes and normal OCT evaluations prior to study entry. Baseline evaluation included a detailed medical history regarding general health status, duration of diabetes, glucose level, blood levels of HbA1c, a history with or without diagnosed early-stage DR, or the appearance of micro-aneurysms. A cross-sectional study was performed with enrollment of 64 subjects, consisting of 52 subjects with diabetes and 12 age-matched healthy control (HC) subjects. While there remains ongoing discussions on the numerical levels of HbA1c in controlled versus uncontrolled diabetes, in this study, the subjects with diabetes (including DR) having HbA1c < 7 were considered controlled whereas subjects having HbA1c > 7 were considered uncontrolled, based on the American Diabetic Association definition for controlled. All these subjects were classified into five groups: 1: HC (18 eyes from 12 subjects), 2: controlled DM, no DR (41 eyes from 22 subjects), 3: uncontrolled DM, no DR (24 eyes from 14 subjects), 4: controlled DM, DR (10 eyes from 6 subjects), 5: uncontrolled DM, DR (17 eyes from 10 subjects). Of the 10 subjects in Gr 5, 6 eyes had very subtle changes of cystoid macular edema (CME). We further collected images from three DME eyes with clearly visible evidence of CME and used them as a set of positive control images in our study. SD-OCT imaging and analysis of both eyes were performed for most of the subjects (for 15 subjects, because of our exclusion criteria, only 1 eye was scanned), where the circumferential scan was centered over the fovea and repeated three times by trained technicians. It is to be noted that the number of eyes is not double the number of subjects. We excluded 15 eyes from the study that exhibited inadequate OCT signal strength on baseline scan (empirically < ~85 dB) and those circle scans were not centered on the fovea, and excluded subjects that had other ophthalmologic or neurologic disorders including glaucoma, multiple sclerosis, hypertensive retinopathy, a refractive error greater than 6 diopters, previous ocular surgery, including refractive surgery, or retinal laser treatment. We also discarded most of the OCT images (except for three which were grouped separately) which had evidence of significant DME, since the focus of this study was early detection, and because the segmentation algorithm would likely be erroneous in the case of overt DME due to discontinuous/low contrast layer boundaries. We considered macular edema to be significant based on the clearly visible evidence of CME in any of the OCT images.
Participant recruitment occurred between September 2013 and February 2015. Adults of both genders were recruited as subjects. Subjects were not excluded based on race or ethnicity, and no vulnerable subjects were recruited for this study. Table 1 shows the subject demographics, comparison of ages, and group characteristics, along with blood sugar and HbA1c levels.
Table 1.
Subject demographics and group characteristics.
| Healthy Control | Controlled DM, no DR | Uncontrolled DM, no DR | Controlled DM, DR | Uncontrolled DM, DR | |
|---|---|---|---|---|---|
| Patients/Eyes | 12/18 | 22/41 | 14/24 | 6/10 | 10/17 |
| Age, in years | 67.6 (9.5) | 67.4 (12.9) | 76.6 (10.0) | 65.8 (12.2) | 62.4 (10.7) |
| Age comparison, p-value | n.a. | 0.95 | <0.01 | 0.68 | 0.14 |
| Male/Female | 6/6 | 8/14 | 7/7 | 2/4 | 6/4 |
| A1c level | n.a. | 6.5 (0.3) | 7.6 (0.5) | 6.4 (0.4) | 9.0 (1.9) |
| Fasting glucose level | n.a. | 116 (24) | 156 (37) | 142 (57) | 196 (119) |
2.2 Retinal Imaging and Segmentation
A Food and Drug Administration (FDA) approved commercially available SD-OCT imaging system (Spectralis HRA-OCT, Heidelberg Engineering, Heidelberg, Germany) was used to obtain circumferential scans around the fovea in less than 2 minutes. The scanning was performed by trained Carle ophthalmic technicians. Each image was acquired with 6 μm/pixel lateral and 3.5 μm/pixel axial digital resolution, respectively. The OCT scanning protocol consisted of a 3.9 mm (1536 A-scans) diameter circle scan around the fovea. After converting the images from the proprietary E2E format to Tiff using the commercial viewing software (Heidelberg Eye Explorer, version 1.7.1.0), the OCT images were flattened by manually fitting a line to the Bruch’s membrane (BM). This was done for the ease of visualization and to make all the OCT images similar to be used for segmentation. Around 20 points were selected on the BM to be used for extrapolation using MATLAB™ linear extrapolation function. Figure 1 shows representative circumferential OCT images and corresponding en face fundus images around the fovea, respectively for a)-b) Gr 1; c)-d) Gr 2; e)-f) Gr 3; g)-h) Gr 4; and i)-j) Gr 5. The green arrows show the scan direction, and the circumferential scans were centered over the fovea.
Figure 1.

Representative circumferential OCT images and corresponding en-face fundus images centered on the fovea, respectively for a-b) healthy control; c-d) controlled DM, no DR; e-f) uncontrolled DM, no DR; g-h) controlled DM, DR; and i-j) uncontrolled DM, DR groups. The green circles with arrow show the scan direction and were centered on the fovea with radius of 3.9 mm.
Six (6) retinal layer lines along: i) internal limiting membrane (ILM), ii) nerve fiber layer (NFL), iii) inner plexiform layer (IPL), iv) outer plexiform layer (OPL), v) inner segment ellipsoid (ISe) and vi) BM were automatically segmented using freely available open source code (Optical Coherence Tomography Segmentation and Evaluation GUI (OCTSEG), Pattern Recognition Lab, Friedrich-Alexander University, Erlangen-Nuremberg, Germany) developed based on research work on OCT[27]. We rarely corrected the segmented images manually, but did so when there was an obvious discontinuity in the automatic segmentation or existence of cystoid macular edema (CME). Figure 2(a) shows the flowchart of the presented method, and Fig. 2(b) shows representative segmented retinal layers in the OCT image. The red, light green, orange, dark green, yellow, and blue lines represent the ILM, NFL, IPL, OPL, ISe and BM, respectively. Figure 3 shows segmented retinal layer boundaries of the OCT images for a) Gr 1; b) Gr 2; c) Gr 3; d) Gr 4; and e) Gr 5, respectively, shown in Fig. 1. The OCTSEG software generates a metadata file containing the retinal layer thicknesses at each A-scan location, which was then read and processed in MATLAB™ to prepare the tables for analysis of variance (ANOVA).
Figure 2.

a) Flowchart of the presented method, b) representative segmented retinal layers in the OCT image. The red, light green, orange, dark green, yellow and blue lines represent the ‘internal limiting membrane (ILM)’, ‘nerve fiber layer (NFL)’, ‘inner plexiform layer (IPL)’, ‘outer plexiform layer (OPL)’, ‘inner segment ellipsoid (ISe)’ and ‘Bruch’s membrane (BM)’, respectively.
Figure 3.
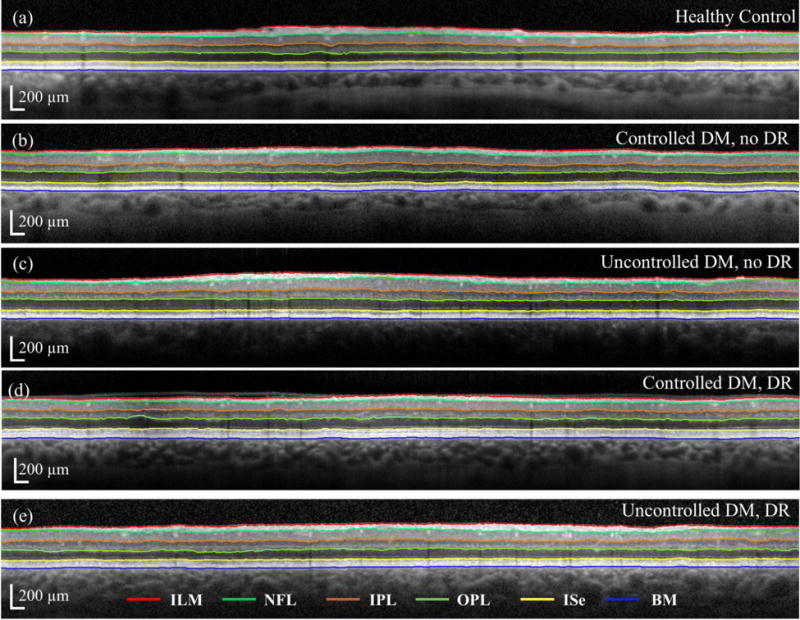
Segmented retinal layers of the OCT images for a) healthy control; b) controlled DM, no DR; c) uncontrolled DM, no DR; d) controlled DM, DR; and e) uncontrolled DM, DR groups, respectively, shown in Fig. 1. The red, light green, orange, dark green, yellow and blue lines correspond to those specified in Fig. 2 caption.
Based on the segmentation results, 15 different retinal layer thickness combinations (ILM-NFL, ILM – IPL, ILM – OPL, ILM – ISe, ILM – BM, NFL – IPL, NFL – OPL, NFL – ISe, NFL – BM, IPL – OPL, IPL – ISe, IPL – BM, OPL – ISe, OPL – BM, and ISe - BM) from the 6 retinal layer boundaries were possible. In a similar way, there were 105 possible retinal layer ratios from the 15 different thicknesses. It is noteworthy to mention that we first renamed all the OCT images with random numbers and then segmented them blindly to avoid any kind of bias. After segmentation, we regrouped the segmented images based on the key for randomization. All segmentations were performed by the same person to avoid variability.
2.3 Statistical Analysis
All statistical analyses were performed using SPSS (Version 22.0, IBM, Chicago, IL) and MATLAB™. Values are presented in the text as mean (standard deviation), unless otherwise noted. A set of ANOVA was run to perform comparisons between HC and DM subjects, and between the DM and DR groups for each of the thicknesses and ratios. Statistical significance was set at p<0.05.
3. Results
3.1 Comparison of retinal layer thicknesses
We compared all the retinal thicknesses (global average) first among the adjacent study groups. Some of these are presented in Table 2, which shows the mean values of thicknesses along with the standard deviations (SD) in parenthesis, and the F and p values from the one-way ANOVA. For Gr 2, ANOVA was performed with respect to the Gr 1 (i); for Gr 3, ANOVA was performed with respect to Gr 2 (ii); for Gr 4, ANOVA was performed with respect to Gr 3 (iii), and for Gr 5, ANOVA was performed with respect to Gr 4 (iv). We also compared the combined DM (controlled and uncontrolled) and DR (controlled and uncontrolled) groups. The thickness between ISe–BM (RPE) appears to be different in the comparison (i), whereas the comparisons (ii) and (iii) reveal several different thicknesses, including GCL (NFL-IPL), IPL (IPL – OPL), GCL+IPL (NFL-OPL) and overall thickness (OT, ILM-ISe), as shown in Table 2. Further, we could not find any difference from comparison (iv) i.e. between Gr 4 and Gr 5. On the other hand, the comparison of thicknesses between all DM and all DR groups show 6 different thicknesses including RNFL (ILM-NFL), GCL, GCL+IPL and OT, as can be seen from Table 2. Figure 4 shows the box plots for different thicknesses among the study groups. The cyan boxes represent the significant thicknesses.
Table 2.
Thicknesses with mean and standard deviation (SD) values in different groups, and the p and F values from one-way ANOVA. For Gr 2, ANOVA is performed with respect to Gr 1; for Gr 3, ANOVA is performed with respect to Gr 2; for Gr 4, ANOVA is performed with respect to Gr 3; and for Gr 5, ANOVA is performed with respect to Gr 4. The p values for the significant thicknesses (p<0.05) are presented in bold text.
| Thicknesses (in μm) | Gr 1 (n=18) | Gr 2 (n=41) | Gr 3 (n=24) | Gr 4 (n=10) | Gr 5 (n=17) | Between all DM and DR | |||||||||
|---|---|---|---|---|---|---|---|---|---|---|---|---|---|---|---|
| Mean (SD) |
Mean (SD) |
p | F | Mean (SD) |
p | F | Mean (SD) |
p | F | Mean (SD) |
p | F | p | F | |
| RNFL (ILM-NFL) | 31.8 (3.3) |
33.1 (3.7) |
0.21 | 1.62 | 34.2 (5.5) |
0.33 | 0.97 | 33.9 (4.8) |
0.87 | 0.03 | 37.4 (5.22) |
0.13 | 2.52 | 0.02 | 5.63 |
| GCL (NFL-IPL) | 74.3 (11.4) |
77.1 (9.4) |
0.33 | 0.98 | 65.5 (8.2) |
<0.01 | 25 | 79.9 (9.1) |
<0.01 | 20.38 | 76.8 (9.09) |
0.51 | 0.45 | 0.03 | 4.89 |
| IPL (IPL – OPL) | 63.0 (4.92) |
62.5 (5.3) |
0.72 | 0.13 | 59.2 (5.3) |
0.02 | 5.87 | 64.9 (8.5) |
0.02 | 5.8 | 63.1 (6.37) |
0.34 | 0.95 | 0.08 | 3.24 |
| OPL (OPL – ISe) | 78.3 (8) |
77.7 (8.4) |
0.81 | 0.06 | 75.1 (11.6) |
0.31 | 1.06 | 72.5 (9.5) |
0.53 | 0.41 | 79.0 (14.97) |
0.56 | 0.35 | 0.95 | 0.00 |
| RPE (ISe – BM) | 65.4 (2.1) |
63.4 (2.9) |
0.01 | 6.95 | 63.0 (3.6) |
0.66 | 0.2 | 64.2 (5.1) |
0.47 | 0.54 | 61.4 (3.64) |
0.28 | 1.21 | 0.29 | 1.13 |
| GCL+IPL (RNFL-OPL) | 137.3 (15.9) |
139.6 (13.1) |
0.57 | 0.33 | 124.7 (12.6) |
<0.01 | 20 | 144.8 (14.5) |
<0.01 | 16.5 | 139.9 (12.2) |
0.33 | 0.33 | 0.02 | 5.43 |
| Overall Retina (ILM-ISe) | 247.7 (22.2) |
250.4 (20.4) |
0.61 | 0.26 | 234.1 (22.0) |
<0.01 | 9 | 251.2 (16.3) |
0.04 | 4.74 | 256.3 (22.4) |
0.93 | 0.01 | 0.05 | 4.04 |
Figure 4.
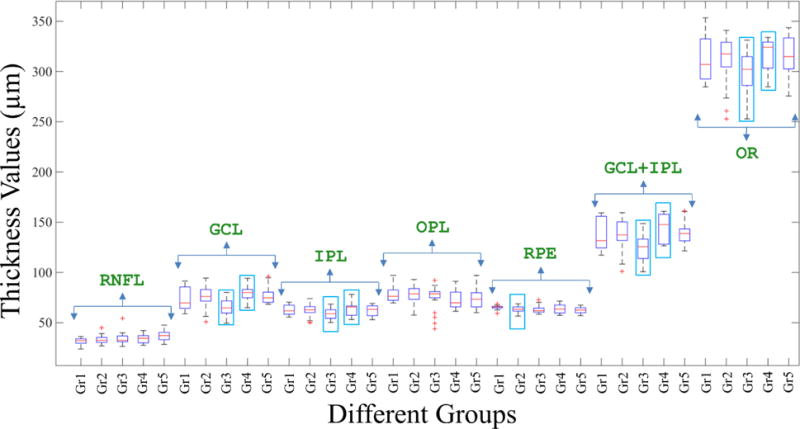
Box plots for different thicknesses among the study groups. The cyan boxes represent the significant thicknesses.
3.2 Comparison of retinal ratios
Different ratios were generated from the retinal thicknesses (global average) and compared among the study groups. We again performed ANOVA for this among the various groups. Table 3 shows some of the ratios with mean and SD in parentheses, in different groups, and the p and F values from one-way ANOVA. Again, for Gr 2, ANOVA was performed with respect to the Gr 1 (v); for Gr 3, ANOVA was performed with respect to Gr 2 (vi); for Gr 4, ANOVA was performed with respect to Gr 3 (vii), and for Gr 5, ANOVA was performed with respect to Gr 4 (viii). Eighteen (18) ratios were found to be different from the comparison (v) i.e. between Gr 1 and Gr 2; however, only the ratio ILM-OPL/IPL-OPL is shown in Table 3. Overall, 67 and 42 ratios were found to be different from the comparisons (vi) and (vii), respectively, and some of them are listed in Table 3, including OT/GCL and OT/(GCL+IPL). Comparison (viii), however, revealed only 6 different ratios and the ratio ILM-OPL/ONFL-OPL is listed in Table 3. Further, the comparison of the ratios between all DM and all DR groups show 60 different ratios including OR/OPL, (GCL+IPL)/OPL and (RNFL+GCL)/IPL, as shown in Table 3. Figure 5 shows the box plots for different ratios among the study groups. The cyan boxes represent the significant thicknesses. Figure 6 shows a representative OCT image after segmentation showing some significant layer thicknesses and ratios.
Table 3.
Some ratios with mean and standard deviation (SD) values in different groups, and the p and F values from one-way ANOVA. For Gr 2, ANOVA is performed with respect to Gr 1; for Gr 3, ANOVA is performed with respect to Gr 2; for Gr 4, ANOVA is performed with respect to Gr 3; and for Gr 5, ANOVA is performed with respect to Gr 4. Overall thickness (OT) is ILM-ISe. The p values for the significant ratios (<0.05) are presented in bold text.
| Ratios | Gr 1 (n=18) | Gr 2 (n=41) | Gr 3 (n=24) | Gr 4 (n=10) | Gr 5 (n=17) | Between all DM and DR | |||||||||
|---|---|---|---|---|---|---|---|---|---|---|---|---|---|---|---|
| Mean (SD) |
Mean (SD) |
p | F | Mean (SD) |
p | F | Mean (SD) |
p | F | Mean (SD) |
p | F | p | F | |
| OR/GCL | 3.41 (0.27) |
3.32 (0.28) |
0.29 | 1.15 | 3.65 (0.27) |
<0.01 | 22.05 | 3.2 (0.24) |
<0.01 | 20.79 | 3.34 (0.31) |
0.25 | 1.41 | 0.24 | 1.41 |
| OR/(GCL+IPL) | 1.82 (0.08) |
1.8 (0.07) |
0.59 | 0.29 | 1.89 (0.1) |
<0.01 | 16.16 | 1.75 (0.1) |
<0.01 | 14.54 | 1.82 (0.08) |
0.07 | 3.59 | 0.39 | 0.75 |
| OR/IPL | 3.97 (0.17) |
4.06 (0.21) |
0.13 | 2.37 | 4.01 (0.25) |
0.37 | 0.83 | 3.96 (0.38) |
0.69 | 0.16 | 4.13 (0.27) |
0.21 | 1.64 | 0.40 | 0.71 |
| OR/OPL | 3.19 (0.26) |
3.25 (0.19) |
0.34 | 0.91 | 3.19 (0.42) |
0.41 | 0.67 | 3.6 (0.54) |
0.02 | 5.6 | 3.42 (0.33) |
0.32 | 1.03 | 0.01 | 7.61 |
| (GCL+IPL)/OPL | 1.78 (0.22) |
1.82 (0.16) |
0.46 | 0.56 | 1.71 (0.31) |
0.07 | 3.33 | 2.11 (0.47) |
0.01 | 8.47 | 1.90 (0.25) |
0.18 | 1.90 | 0.01 | 7.22 |
| ILM-OPL/(GCL+IPL) | 1.24 (0.02) |
1.24 (0.04) |
0.50 | 0.46 | 1.28 (0.05) |
<0.01 | 11.92 | 1.24 (0.04) |
0.02 | 5.72 | 1.27 (0.03) |
0.03 | 5.23 | 0.69 | 0.16 |
| (RNFL+GCL)/IPL | 1.70 (0.13) |
1.79 (0.14) |
0.02 | 5.74 | 1.72 (0.13) |
0.03 | 5.06 | 1.81 (0.28) |
0.21 | 1.62 | 1.87 (0.21) |
0.50 | 0.46 | 0.05 | 4.11 |
Figure 5.

Box plots for different ratios among the study groups. The cyan boxes represent the significant ratios.
Figure 6.

Representative OCT image showing some significant layer thicknesses and ratios.
4. Discussion
Several interesting results were obtained from the ratiometric analysis. We found GCL thinning in Gr 3 compared to Gr 2 along with thinning of GCL+IPL, IPL alone, and overall thickness. Further, the ratio OT/GCL+IPL showed statistical significance in the comparisons between Gr 2 and Gr 3; and, Gr 3 and Gr 4, indicating that there is a thicker overall retina compared to the inner retina in Gr 3.
The fact that thicknesses change significantly between Gr 2 and Gr 3 suggests that these thicknesses may be a retinal indicator of poor glycemic control, and the significant change between groups B and C may be an early indicator for the progression from non-DR to DR. The fact that the control groups show no significant difference only further supports these findings as important. The comparison between the Gr 1 (HC) and Gr 2 shows only that the RPE thickness is different, although there are 18 different ratios including those not involving the RPE thickness. On the other hand, there is no significant difference in any of the thicknesses in Gr 5 compared to Gr 4. However, we found 7 ratios that were different. Similarly, when the two control groups were compared (i.e. Gr 2 and Gr 4), we found 31 significantly different ratios, although there was no significant difference in any of the thicknesses alone (not shown in the table). Therefore, we can potentially use these ratios as markers for early detection of DM and DR, as well as DR severity.
Ratiometric analysis of sub-retinal layer thicknesses may prove to be a more robust indicator than traditional thickness analysis. It is reported that retinal thickness measurements in normal-appearing eyes vary by patient age, sex, ethnicity, and refractive error[28]. Our ratiometric analyses normalize the inter-subject variance of overall retinal thickness and demographics, mitigates error due to scan tilt in the image, and provides access to a larger palette of analysis metrics[26]. The premise behind the circle scan around the fovea rather than around the optic nerve head (ONH) was to mitigate the effects of the vasculature on the analysis. Vessel diameter variations makes scans around the ONH more complicated.
Furthermore, we wanted to look at the effects of diabetes, with or without DR, on the macula and not around the optic nerve head. The choice of a circle scan rather than a 3D volume scan is due to better spatial sampling around the radius of interest. To obtain similar data from a volume cube, the scanning and sampling would need to be very dense (for example, about 700 B-scans each consisting of 1536 A-scans within 3.9 mm length centered around the fovea to extract equivalent circle scan of 1536 pixels). Further, a circle scan around the fovea was a more efficient (faster, less motion artifact, less subject discomfort) than an equally dense sampled volume of the macula. Based on results from our initial study[26], we were only interested in locations about a given radius (3.9 mm) from the fovea.
The results from the ratiometric analysis are encouraging for future efforts to diagnose or screen for diabetes at an early stage, before symptoms or gross retinal abnormalities occur. Previous studies have investigated layer thicknesses in the retina to draw conclusions about the presence of DR, however, an analysis of the ratios of these layer thicknesses is a more robust measure. Our initial study showed that the parafoveal region provides the highest number of significant ratios[26], and thus the circle scan provided a better spatial sampling around the radius of interest in the current study.
Most of the subjects in this study did not have many CME changes. It is possible that there were some eyes with a large degree of macular distortion from DME that fall outside of the scan location, which would lead to a false negative result. This can be due to a number of factors, but mostly due to the fact that the circle scan only acquires data from one small portion of the macula and is not representative of the entire macula. We specifically selected patients that did not visually have a large degree of macular distortion from DME. If CME was present at a severe stage, it is likely that the segmentation algorithm would have failed due to too many discontinuous regions in the circle scan. We therefore segmented 3 eyes with severe DME using the software and corrected images manually at the locations of discontinuity due to cystoid. We called this the positive control group and compared the group with the HC group. There was clear evidence of cystoid thickening in the ONL at the beginning and end of the line scans for these 3 eyes. The comparison shows 6 obvious and significant thicknesses and 28 obvious and significant ratios. However, some of the non-significant ratios in this comparison appeared significant in other comparisons. We accepted this result since not all the comparisons were done with respect to the HC, and there may be changes in the thicknesses that lead to significant ratio changes in those comparisons.
The main point for the positive control testing is to show that our segmentation algorithm works as expected when we visually see a change in the retinal OCT image, suggesting that it may be predictive too, even when we do not visually see a change. It can be noted that the comparison of the positive control group with the next most advanced group (Gr 5 i.e. uncontrolled DM, DR) reveals that many thicknesses and ratios in the positive control group are statistically different from Gr 5 (not shown in the table), and thus implies that there are statistical differences with all the other groups too.
From the analysis, we found that there was not a particular ratio or a set of ratios that were consistently and significantly different in all the comparisons. As we performed the comparison among the successive groups, many ratios were found to be significant, but these same ratios were not consistently significant across all group comparisons. While comparing the Gr 2 with Gr 1, we found that the ratio (RNFL+GCL)/IPL was significantly higher in the former group, although none of the thicknesses involved in the ratio were significant. Thus, this ratio could potentially be an indicator for early diabetic effects on the retina prior to the development of clinical retinopathy, which would correlate with published literature of early inner layer retina changes within diabetic patients. When comparing the Gr 4 with Gr 3, the ratio OR/OPL was found to be significantly higher in the former group, this reflects changes in the outer retinal structures. While the OR thickness was significantly different, the OPL thickness did not change much between the groups. Therefore, the overall effect on the ratio is indicative of these changes, as can be seen from the p-values (for the ratio, the p-value is 0.02, whereas for the OR and OPL thicknesses, the p-values are 0.04 and 0.53, respectively). The same ratio is again significant when comparing all DM and DR eyes. The same is true is for the ratio (GCL+IPL)/OPL. Therefore, such ratios are may be more sensitive in detecting early DR.
Recently, we introduced ratiometric analysis to compared multiple sclerosis (MS) patients with HC subjects[29]. In that study, the ratiometric analysis revealed differences in several retinal layer thickness ratios in the cohort of MS subjects without a history of optic neuritis (ON) compared to HC subjects, and there was no difference in standard retinal nerve fiber layer thickness (RNFLT). The difference in such ratios between HC subjects and those with mild MS-disability, without a difference in RNFLT, further suggested the possibility of using layer ratiometric analysis for detecting these early retinal changes in MS. Ratiometric analysis appeared to be useful and potentially more sensitive for detecting disease changes in MS.
In this previous study, we used peripapillary OCT scans (a 3.9-mm-diameter circumferential scan centered on the optic nerve head), instead of the circumferential OCT scan around the fovea in the preset study. While our present ratiometric study was guided by the previous success of ratiometric analysis, our present work is novel in its application to different retinal layers and the subtle changes associated with early diabetic retinopathy. Just as the OCT hardware technology has made significant contributions to many types of retinal diseases, we believe that this ratiometric approach, and other novel software-based analysis algorithms, will likely have an equally significant impact on multiple retinal diseases in the future.
5. Conclusion
In this paper, we have investigated different retinal thicknesses and their ratios for diabetic human subjects with or without DR, based on measurements from a macular circumferential OCT scan centered around the fovea. The ANOVA indicated differences in thicknesses and ratios in some of the comparisons between the adjacent study groups. Some of the ratios were significantly different between groups when the standard thickness measurements were not significantly different, and thus the ratios can be considered as more sensitive parameters for early detection of DM and DR, and even for detecting the severity in DR.
Supplementary Material
Acknowledgments
We thank Eric Chaney for his assistance with managing our IRB protocol and Darold Spillman from the Beckman Institute for Advanced Science and Technology, and Imaging at Illinois, for providing logistical, operations, and information technology support for this project. We also thank Chieli Maldonado and Zach Dupureur from Carle Foundation Hospital for downloading the OCT scans and de-identifying them. This research was supported in part by a grant from the National Institutes of Health (NIBIB R01 EB013723, S.A.B.). Additional information can be found at http://biophotonics.illinois.edu.
Footnotes
Supporting Information
Additional supporting information on the thicknesses and ratios may be found in the online version of this article at the publisher’s website.
Author biographies Please see Supporting Information online.
References
- 1.Olk J, Carol M, Lee JB. Diabetic retinopathy: practical management. Lippincott; Philadelphia: 1993. [Google Scholar]
- 2.Mohamed Q, Gillies MC, Wong TY. JAMA. 2007;298:902–916. doi: 10.1001/jama.298.8.902. [DOI] [PubMed] [Google Scholar]
- 3.Klein R, Klein BE, Moss SE, Davis MD, DeMets DL. Arch Ophthalmol. 1984;102:527–532. doi: 10.1001/archopht.1984.01040030405011. [DOI] [PubMed] [Google Scholar]
- 4.Herman WH. J Diabetes Sci Technol. 2009;3:656–660. doi: 10.1177/193229680900300406. [DOI] [PMC free article] [PubMed] [Google Scholar]
- 5.Huang D, Swanson EA, Lin CP, Schuman JS, Stinson WG, Chang W, Hee MR, Flotte T, Gregory K, Puliafito CA, et al. Science. 1991;254:1178–1181. doi: 10.1126/science.1957169. [DOI] [PMC free article] [PubMed] [Google Scholar]
- 6.Schuman JS, Puliafito CA, Fujimoto JG, Duker JS. Optical Coherence Tomography of Ocular Diseases. 3rd. New Jersey: SLACK Incorporated; 2013. [Google Scholar]
- 7.Potsaid B, Gorczynska I, Srinivasan VJ, Chen Y, Jiang J, Cable A, Fujimoto JG. Opt Exp. 2008;16:15149–15169. doi: 10.1364/oe.16.015149. [DOI] [PMC free article] [PubMed] [Google Scholar]
- 8.Koozekanani D, Boyer K, Roberts C. IEEE Trans Med Imag. 2001;20:900–916. doi: 10.1109/42.952728. [DOI] [PubMed] [Google Scholar]
- 9.Asefzadeh B, Fisch BM, Parenteau CE, Cavallerano AA. Clin Exp Ophthalmol. 2008;36:455–463. doi: 10.1111/j.1442-9071.2008.01769.x. [DOI] [PubMed] [Google Scholar]
- 10.Loduca AL, Zhang C, Zelkha R, Shahidi M. Am J Ophthalmol. 2010;150:849–855. doi: 10.1016/j.ajo.2010.06.034. [DOI] [PMC free article] [PubMed] [Google Scholar]
- 11.Saidha S, Syc SB, Durbin MK, Eckstein C, Oakley JD, Meyer SA, Conger A, Frohman TC, Newsome S, Ratchford JN, Frohman EM, Calabresi PA. Mult Scler. 2011;17:1449–1463. doi: 10.1177/1352458511418630. [DOI] [PubMed] [Google Scholar]
- 12.Kafieh R, Rabbani H, Hajizadeh F, Abramoff MD, Sonka M. J Ophthalmol. 2015;2015:259123. doi: 10.1155/2015/259123. [DOI] [PMC free article] [PubMed] [Google Scholar]
- 13.Chen YW, Li JF, Yan Y, Shen X. BMC Ophthalmol. 2016;16:12. doi: 10.1186/s12886-016-0186-4. [DOI] [PMC free article] [PubMed] [Google Scholar]
- 14.Biallosterski C, van Velthoven ME, Michels RP, Schlingemann RO, DeVries JH, Verbraak FD. Br J Ophthalmol. 2007;91:1135–1138. doi: 10.1136/bjo.2006.111534. [DOI] [PMC free article] [PubMed] [Google Scholar]
- 15.Browning DJ, Fraser CM, Clark S. Ophthalmol. 2008;115:533–539. doi: 10.1016/j.ophtha.2007.06.042. [DOI] [PubMed] [Google Scholar]
- 16.Oshitari T, Hanawa K, Adachi-Usami E. Eye. 2009;23:884–889. doi: 10.1038/eye.2008.119. [DOI] [PubMed] [Google Scholar]
- 17.van Dijk HW, Kok PH, Garvin M, Sonka M, Devries JH, Michels RP, van Velthoven ME, Schlingemann RO, Verbraak FD, Abramoff MD. Invest Ophth Vis Sci. 2009;50:3404–3409. doi: 10.1167/iovs.08-3143. [DOI] [PMC free article] [PubMed] [Google Scholar]
- 18.van Dijk HW, Verbraak FD, Kok PH, Garvin MK, Sonka M, Lee K, Devries JH, Michels RP, van Velthoven ME, Schlingemann RO, Abramoff MD. Invest Ophthalmol Vis Sci. 2010;51:3660–3665. doi: 10.1167/iovs.09-5041. [DOI] [PMC free article] [PubMed] [Google Scholar]
- 19.Hannouche RZ, Avila MP. Arq Bras Oftalmol. 2009;72:433–438. doi: 10.1590/s0004-27492009000400002. [DOI] [PubMed] [Google Scholar]
- 20.Vujosevic S, Midena E. J Diabetes Res. 2013;2013:905058. doi: 10.1155/2013/905058. [DOI] [PMC free article] [PubMed] [Google Scholar]
- 21.Zhi Z, Chao JR, Wietecha T, Hudkins KL, Alpers CE, Wang RK. Invest Ophthalmol Vis Sci. 2014;55:1024–1030. doi: 10.1167/iovs.13-12864. [DOI] [PMC free article] [PubMed] [Google Scholar]
- 22.Bonnin S, Tadayoni R, Erginay A, Massin P, Dupas B. Invest Ophthalmol Vis Sci. 2015;56:978–982. doi: 10.1167/iovs.14-15503. [DOI] [PubMed] [Google Scholar]
- 23.Azrak C, Baeza-Díaz MV, Palazón-Bru A, Hernández-Martínez C, Navarro-Navarro A, Martínez-Toldos JJ, Gil-Guillén VF. Medicine. 2015;94:e1579. doi: 10.1097/MD.0000000000001579. [DOI] [PMC free article] [PubMed] [Google Scholar]
- 24.Carpineto P, Toto L, Aloia R, Ciciarelli V, Borrelli E, Vitacolonna E, Di Nicola M, Di Antonio L, Mastropasqua R. Eye. 2016;30:673–679. doi: 10.1038/eye.2016.13. [DOI] [PMC free article] [PubMed] [Google Scholar]
- 25.Kashani AH, Zimmer-Galler IE, Shah SM, Dustin L, Do DV, Eliott D, Haller JA, Nguyen QD. Am J Ophthalmol. 2010;149:496–502. doi: 10.1016/j.ajo.2009.09.025. [DOI] [PMC free article] [PubMed] [Google Scholar]
- 26.Shelton R, Taibl J, Shemonski N, Sayegh S, Boppart SA. Invest Ophthalmol Vis Sci. 2013;54:2428. [Google Scholar]
- 27.Mayer MA, Hornegger J, Mardin CY, Tornow RP. Biomed Opt Exp. 2010;1:1358–1383. doi: 10.1364/BOE.1.001358. [DOI] [PMC free article] [PubMed] [Google Scholar]
- 28.Chalam KV, Bressler SB, Edwards AR, Berger BB, Bressler NM, Glassman AR, Grover S, Gupta SK, Nielsen JS. Invest Ophthalmol Vis Sci. 2012;53:8154–8161. doi: 10.1167/iovs.12-10290. [DOI] [PMC free article] [PubMed] [Google Scholar]
- 29.Bhaduri B, Nolan RM, Shelton RL, Pilutti LA, Motl RW, Boppart SA. J Biomed Opt. 2016;21:95001. doi: 10.1117/1.JBO.21.9.095001. [DOI] [PMC free article] [PubMed] [Google Scholar]
Associated Data
This section collects any data citations, data availability statements, or supplementary materials included in this article.